MQL5 Wizard Techniques you should know (Part 71): Using Patterns of MACD and the OBV
Introduction
The Moving Average Convergence Divergence oscillator, a trend tracking oscillator (MACD) is paired with the On Balance Volume oscillator (OBV). These two complement each other since one tracks trend while the other measures volume. We perform tests using the pair GBP JPY on the year 2023 with the year 2024 serving as a forward walk test window. Our ‘training’ or optimization for the year 2023; besides seeking the ideal pattern signal weight; also seeks entry price gaps and take-profit targets. This is all done while no stop-loss is being used, meaning we rely solely on the close threshold weight of the custom signal class to close any positions that are no longer inline with their open thesis.
The test reports presented below show profits mostly but this does not necessarily mean successful forward walks because the test period also includes the period over which the Expert Advisors are optimized. This has been our approach throughout these series and is set to continue. Therefore, readers need to consider this when interpreting the test report results; besides the very short test window.
We test 10 signal patterns, one at a time, that are guided by these rules:
Indexing is from 0 to 9 allowing us to easily compute the map value for their exclusive use by the Expert Advisor. For instance, if a pattern is indexed 1 then we have to set the parameter ‘PatternsUsed’ to 2 to the power 1 which comes to 2. If the index is 4 then this is 2 to the power 4 which comes to 16, and so on. The maximum value that this parameter can be assigned, meaningfully, is 1023 since we have only 10 parameters. Any number between 0 and 1023 that is not a pure exponent of 2 would represent a combination of more than one of these 10 patterns.
The MACD
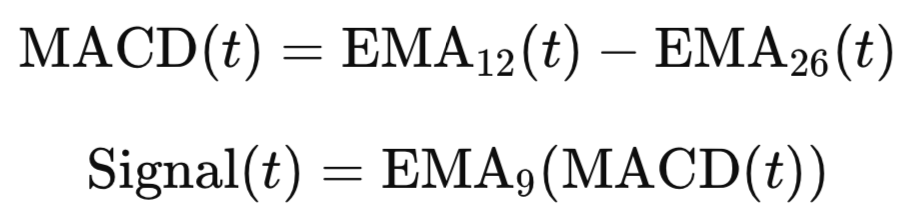
The MACD is meant to measure the difference between two exponential moving averages. It primarily shows the trend direction, although the argument could be made that it also tracks momentum. The MACD line aka histogram is the core of this indicator. The additional buffer, engaged by this indicator, that is referred to as the signal-line, is simply a smoothed version of the MACD line/ histogram. It helps spot the indicators turning points and therefore any buy/ sell signals. Positive histogram values indicate a bullish trend; while the negative would be bearish.
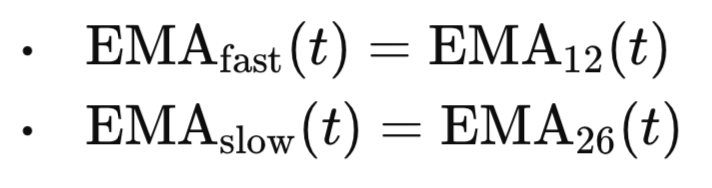
This indicator’s use is with the histogram crossover with the signal line, an important trading signal; zero-line crossings of the histogram that often suggest shifts in trend; and divergences between price trend and the histogram’s trend. Typical settings for the fast and slow EMA periods are 12 and 26 respectively. The signal often uses a smoothing period of 9. We are sticking to these default metrics for our testing purposes, however readers can look into this, if they need adjustment, particularly in cases where the MACD is paired with another indicator that uses a different by significant indicator period(s). Its formula is as follows:
If:
Then:
Where:
- t is the current time step or bar index
- EMA12(t) is the 12-period Exponential Moving Average of Closing Prices
- EMA26(t) is the 26-period Exponential Moving Average of Closing Prices
- MACD(t) is the difference between fast and slow EMAs
- EMA9(MACD(t)) is the 9-period Exponential Moving Average of the MACD aka the Signal-Line
The OBV
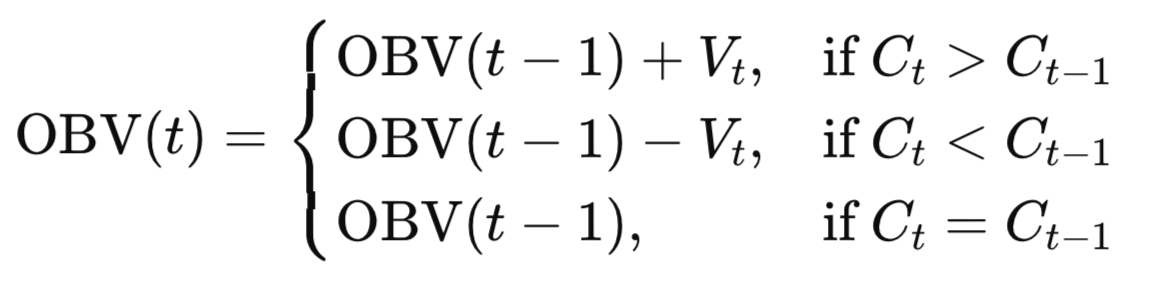
The main purpose of this oscillator is to measure buying and selling pressure by taking cumulative total volume into account. Its core idea is if price closes higher, this is a sign of bullish pressure and therefore more volume is credited to the OBV. If we have a lower close, then the volume gets deducted. No price change means the indicator remains the same. Its interpretation therefore is straightforward, with a rising OBV serving to confirm an uptrend, while a declining OBV would indicate a bearish trend. Also, a divergence between OBV and price can indicate a potential trend reversal.
It is cumulative in nature, starting typically at zero and then accumulating volume changes over time. For forex traders, the used volumes in these accumulations are tick volumes and not real volumes, given the ‘decentralized’ nature of forex trading. Broad uses to traders therefore are trend confirmation, divergence spotting, and sharpening of entries/ exits to positions based on volume levels. The formula for this indicator is given as follows:
Where:
- OBV(t) is the On-Balance Volume at a time t
- OBV(t-1) is the On-Balance-Volume from a previous time step
- Vt is the Volume at time t
- Ct is the closing price at time t
With the indicators defined, let's look at their signal patterns.
MACD Crossover and Trending OBV
Our first pattern uses a strategy that brings together the MACD crossover with the OBV trend direction. MACD crossovers tend to be crucial as they spot potential trend reversals. The OBV trend direction is used to signal a volume based confirmation, serving as a filter on false MACD signals. The bullish signal is thus when the MACD makes a U turn with the histogram closing above the signal line. This is confirmed if it was below the signal on the prior bar. In tandem, the OBV would be rising, a sign of bullish volume accumulation, strengthening the long case. We implement this as follows in MQL5:
//+------------------------------------------------------------------+
//| Check for Pattern 0.                                             |
//+------------------------------------------------------------------+
bool CSignalMACD_OBV::IsPattern_0(ENUM_POSITION_TYPE T)
{  if(T == POSITION_TYPE_BUY && MACD_UP(X()) && OBV(X()) > OBV(X() + 1))
   {  return(true);
   }
   else if(T == POSITION_TYPE_SELL && MACD_DN(X()) && OBV(X()) < OBV(X() + 1))
   {  return(true);
   }
   return(false);
}
The sell signal logic also has a crossover, with the MACD closing below the signal line having been above it on the prior bar. A bearish crossover. This also happens when the OBV is falling given that volume distribution would be negative, strengthening the bearish case. This pattern is meant to spot momentum and volume confirmed setups in trending/breakout markets. It can also be engaged in filtering out MACD noise in choppy/ sideways markets thanks to the volume import.
There are some edge cases to watch out for, though, OBV can generate false directions in low-volume sessions. Also, the MACD can lag during reversals that are sharp and this can result in, possibly, late entries. Optimizing for the year 2023 and performing a 2023.01.01 to 2025.01.01 test run with just this pattern, where parameter for patterns-used is assigned 1, gives us the following report. It did not forward walk.

Below is a tabulation of recommendations for possible use when engaging pattern-0.
| Topic | Recommendation |
|---|---|
| Timeframe | It should work best in the 1-hour to 4-hour timeframe range. Use on minute timeframes should be avoided unless it is paired with a larger timeframe indicator. |
| Indicator Settings | It is always preferred to stick with typical MACD settings of (12,26,9). If real volume data is available, then that would be preferred for the OBV. |
| Entry Rule | Entries should typically be at candle close and mid-candle entries should be avoided, especially on the smaller timeframes. |
| Stop Loss | These can be put at recent swing high/ low. Dynamic ATR can also be used in sizing these. |
| Take Profit | A risk-reward of 1 to 1.5 can be used in sizing the trailing stop and locking in gains. |
| Confirmation | Possible third party indicator for signal confirmation could be RSI or MA slope. |
| News Filter | Entries before high impact news should be eschewed whenever possible. |
| Back testing | Extensive testing is critical to this pattern, as it is highly reliant on volume structure. |
Besides the use recommendations above, this pattern could also use some enhancement. These can include the addition of a divergence filter, although separate patterns that explore this are considered below. We could add a cooldown period or a debounce period in which we prevent repeat signals from being registered; where, for instance, we only allow one signal for every x candles. Finally, we could also use slope or rate-of-change to ascertain that the MACD and/or OBV are not flat-lining at the time of signalling.
MACD Centreline Crossover + OBV Breakout
Our next pattern, indexed 1, is meant to sense MACD zero-line crossings as filtered with volume pressure extremes registered by OBV. This combination marks early trend reversals that are supported by long or short volume conditions. The buy signal is then MACD histogram crosses the zero bound from below to close above it. This is also referred to as a bullish zero-line crossover, where the histogram changes from negative readings to positive readings. It marks a shift in momentum.
It is important to note that the MACD gives off plenty of these signals, which is why a check on the OBV to establish if it is at all-time highs in a period going back to the MACD’s fast period, 12, is important. In other words, the current OBV value needs to be equivalent or higher than its 12-period maximum. We implement this in MQL5 as follows:
//+------------------------------------------------------------------+
//| Check for Pattern 1.                                             |
//+------------------------------------------------------------------+
bool CSignalMACD_OBV::IsPattern_1(ENUM_POSITION_TYPE T)
{  int _index = -1;
   m_obv.Refresh(-1);
   if(T == POSITION_TYPE_BUY && MACD(X()) > 0.0 && MACD(X() + 1) < 0.0 && OBV(X()) >= m_obv.MaxValue(0, X(), 12, _index))
   {  return(true);
   }
   else if(T == POSITION_TYPE_SELL && MACD(X()) < 0.0 && MACD(X() + 1) > 0.0 && OBV(X()) <= m_obv.MinValue(0, X(), 12, _index))
   {  return(true);
   }
   return(false);
}
Likewise, the sell signal conditions are when the MACD crosses the zero from above to close below it, a momentum shift transition, from positive to negative; while the OBV is also bottoming. The current OBV would be at or below its 12-period low, a sign of strong sell-side volume. Strategic insights from this could be; that MACD zero-line crossings are more powerful than signal-line crossings since they represent a net direction shift; OBV range filtering ensures confirmation by seeing to it that volume is not just directional but is sufficiently elevated; and it's designed to early catch entry points into new trends, with setups like breakouts or swings. Our testing for this pattern give us the following report. It did not forward walk:

Below is a tabulation of use-recommendations for pattern-1.
| Aspect | Recommendation |
|---|---|
| Timeframe | This pattern is best suited for the timeframes 1-hour, 4-hour, and Daily. Lower time frames are bound to whipsaw with false signals a lot. |
| Market Conditions | It is effective in trend reversal regimes or early trend formation points. Not suited in tight range markets. |
| Stop-Loss Strategy | The use of recent swing low for longs and swing high for shorts can help with this help in dynamically sizing this. |
| Position Size | This should be gradual, and stepped, since initial signals tend to be more transient than definitive. |
| Confirmation | RSI or Moving Average Slope use can also help supplement this pattern with confirmation for sharper entries. |
| Avoid Overfitting | The OBV window, which we use as 12, should be kept relatively short in order to keep it more dynamic. |
| News Filter | High-impact news may distortive to volume readings — thus when possible, entries should be put off by at least 30 minutes before and after major news events. |
| Back testing Window | Testing over a variety of volatility regimes is also important, given the volume sensitivity. |
MACD Divergence + OBV Uptrend
Our third pattern detects small bullish/bearish reversals by confirming price rejections with MACD directions and OBV volume pressure. Its focus is on relative position changes, not absolute levels, as we’ve had above in pattern-1. The buy signal conditions are prices making lower lows, which sets up a potential liquidity sweep or fake-out coupled with rising MACD histogram and increasing OBV volume pressure. All these three indicators merge to form a bullish divergence scenario. We implement this in MQL5 as follows:
//+------------------------------------------------------------------+
//| Check for Pattern 2.                                             |
//+------------------------------------------------------------------+
bool CSignalMACD_OBV::IsPattern_2(ENUM_POSITION_TYPE T)
{  if(T == POSITION_TYPE_BUY && Low(X()) < Low(X() + 1) && MACD(X()) > MACD(X() + 1) && OBV(X()) > OBV(X() + 1))
   {  return(true);
   }
   else if(T == POSITION_TYPE_SELL && High(X()) > High(X() + 1) && MACD(X()) < MACD(X() + 1) && OBV(X()) < OBV(X() + 1))
   {  return(true);
   }
   return(false);
}
Similarly, the sell signal conditions are price making higher highs with MACD falling from increasing bearish under currents, that are backed by a falling OBV. Again, this suggests a bearish divergence as price spikes higher but lacks strength from momentum and volume. A few trading insights could be picked from this. First, this is a short-term reversal exhaustion that simply uses volume and momentum confirmations. Secondly, it works well in trend pause zones like third Elliot wave or at important support/ resistance areas. Thirdly, it is ideal for fade trades or mean-reversion setups. Testing of this pattern also did not give us a positive forward walk. Below is the report:

A list of use recommendations is shared below.
| Topic | Recommendation |
|---|---|
| Timeframe | Suitable frames here are 1-hour or 30-minute for the short term reversal trades with Daily coming in for swing setups. |
| Signal Context | Pattern is best capitalised on when near recent highs/ lows or in key S/R zones. |
| Confirmation Candle | Waiting for a reverse candle such as a hammer or shooting star can help sharpen this. |
| Stop-Loss Strategy | These can be placed beyond recent low or high for longs and shorts respectively. |
| Profit Target | This can be Mid-channel or at recent structure level, depending on the entry point. |
| Avoid During Trends | Trading against strong candles should be avoided as this is a counter trend signal. |
| Combine with RSI | RSI divergence can be incorporated to strengthen signal by sharpening entries. |
| Back test Volatile Assets | Assets most suitable for this pattern could include most commodities and some commodity linked indices as well. |
MACD Histogram Reversal + OBV Support
The fourth signal pattern is meant to grab short-term trend continuation after a temporary correction in MACD momentum. It dwells on pullbacks of momentum that are confirmed by OBV direction. The buy signal conditions, for this bullish continuation pattern, are the MACD histogram increasing over the previous value; with the previous value having been also less than the MACD before it. This happens when the OBV is on an ascendancy. This bullish pattern marks a momentum dip and rise, with volume to back the recovery - a classic sign of a trend continuation. We implement this in MQL5 as follows:
//+------------------------------------------------------------------+
//| Check for Pattern 3.                                             |
//+------------------------------------------------------------------+
bool CSignalMACD_OBV::IsPattern_3(ENUM_POSITION_TYPE T)
{  if(T == POSITION_TYPE_BUY && MACD(X()) > MACD(X() + 1) && MACD(X() + 1) < MACD(X() + 2) && OBV(X()) > OBV(X() + 1))
   {  return(true);
   }
   else if(T == POSITION_TYPE_SELL && MACD(X()) < MACD(X() + 1) && MACD(X() + 1) > MACD(X() + 2) && OBV(X()) < OBV(X() + 1))
   {  return(true);
   }
   return(false);
}
Conversely, the sell signal conditions are indicated by an MACD fall; with the previous bar having indicated an upward tick in the MACD; while the OBV is in decline from sell-side volume pressure. This bearish pattern often suggests a brief bullish correction during a downtrend got ‘overwhelmed’ and the sellers regained control. Possible insights from this are that, this pattern grabs snap backs that resume trend direction, a setup that can be of use to traders who are trend followers or scalpers. They enter on resumption rather than breakout. It works well in ‘clean’ trends without a lot of whipsawing. This pattern also did not forward walk. Its test report is presented below:

Extra use recommendations for this pattern when fine-tuning, preferably for solo use as opposed to combining with other patterns, are shared below.
| Topic | Recommendation |
|---|---|
| Timeframe | Could be ideal for 15-minute to 1-hour trend-following systems. |
| Context | Should strictly be applied in established directional markets, with consolidation markets avoided. |
| Entry Timing | Waiting a significant candle formation, such as Marubozu or the engulfing, should be preferred. |
| SL/TP Strategy | Stop-loss can be just beyond the pull-back level, with take profit targets at a multiple of this stops-distance. |
| Volume Filter | Confirmation that the OBV rise/fall is not flattish but meaningful can make a difference in the long haul. |
| Avoid Repetition | Re-entry if the pattern keeps reoccurring without trend should be avoided. |
| Pairing with MA Filter | As a supplement filter, an EMA can help establish/ confirm the trend. |
| Volatility Filter | The ATR or Bollinger can in addition be used to gauge trend strength. |
MACD Consolidation + OBV Surge
Pattern-4, our fifth, is a zero-line MACD hover detection signal that works together with OBV direction breakout. It seeks to pinpoint periods of MACD neutrality, where there is a sense of balance between the bulls and the bears. It then checks if these periods were followed by a major volume driven breakout. The buy signal interpretation is when the MACD has peaked and troughed within a tight window while close to the zero bound. Once this happens, we then look out for an OBV move higher that is at least 0.5% greater than its prior reading. The pattern is meant to suggest smart money accumulation is about to move price higher after some consolidation. We implement this in MQL5 as follows:
//+------------------------------------------------------------------+
//| Check for Pattern 4.                                             |
//+------------------------------------------------------------------+
bool CSignalMACD_OBV::IsPattern_4(ENUM_POSITION_TYPE T)
{  int _index = -1;
   m_macd.Refresh(-1);
   if(m_macd.MaxValue(0, X(), 3, _index) >= 0.0 && m_macd.MinValue(0, X(), 3, _index) <= 0.0)// && fabs(m_macd.MinValue(0, X(), 3, _index) - m_macd.MaxValue(0, X(), 3, _index)) <= High(X()) - Low(X()))
   {  if(T == POSITION_TYPE_BUY && OBV(X()) >= 1.005 * OBV(X() + 1))
      {  return(true);
      }
      else if(T == POSITION_TYPE_SELL && OBV(X()) <= 0.995 * OBV(X() + 1))
      {  return(true);
      }
   }
   return(false);
}
The sell signal, like the buy also has the MACD hovering about the zero with no clear trend. OBV then trends 0.5% lower than its prior reading as a sign of a huge spike in selling pressure. These events are meant to portend an impending breakdown in the range. What makes pattern-4 special is its low-latency trigger because of its lagged volume confirmation requirement. It does not give off a lot of signals. This helps in avoiding the fake-outs of price-only breakout systems. Testing it also presented few trades that did not forward walk.

Use case guidance, for this pattern is shared below.
| Category | Recommendation |
|---|---|
| Market Conditions | It is useful in markets that are consolidating prior to breakout. |
| Timeframes | The 1-hour to 4-hour timeframes could be ideal for more ‘clean’ signals. |
| Confirmation | It can be used together with candlestick breakout or even the Bollinger Band expansion. |
| Volume Quality | It is crucial to ensure the OBV is not flattish or noisy; smooth trending is important. |
| Risk Control | Placing SL just shy of range low (for buy) or high (for sell) can be used. |
| Volatility Filter | Supplementing with ATR or price compression logic can help in range spotting. |
MACD Positioning to Zero + OBV Rally
Next, is a signal pattern that is a volume-supported, counter-trend setup. Its hallmarks are the MACD moving in the opposite direction to price’s trend; with its positioning to the zero being taken into account. OBV needs to confirm that the volume is in favour of the move. Pattern-5 is designed to grab early momentum changes while remaining cautious given that the MACD histogram is still in the opposing half. The buy signal is MACD increasing, a sign long momentum is picking up, but with its value still below the zero level. The last point means our market is still in bearish regime. A rising OBV signals accumulating buyers. It can be interpreted as a bullish recovery within a bearish context. We implement this as follows in MQL5:
//+------------------------------------------------------------------+
//| Check for Pattern 5.                                             |
//+------------------------------------------------------------------+
bool CSignalMACD_OBV::IsPattern_5(ENUM_POSITION_TYPE T)
{  if(T == POSITION_TYPE_BUY && MACD(X()) > MACD(X() + 1) && MACD(X()) < 0.0 && OBV(X()) > OBV(X() + 1))
   {  return(true);
   }
   else if(T == POSITION_TYPE_SELL && MACD(X()) < MACD(X() + 1) && MACD(X()) > 0.0 && OBV(X()) < OBV(X() + 1))
   {  return(true);
   }
   return(false);
}
The sell signal, the counter-bullish, features MACD falling, while still in positive territory, and the OBV is also tapering off. A bearish fade in a bullish regime. The case for pattern-5 is that it cautiously targets early reversals while using volume as a conviction. Does not require full cross-overs. It can be used in conjunction with the following suggestions. This pattern also does not forward walk from our limited testing and its report is presented below.

| Area | Recommendation |
|---|---|
| Timeframes | H1-hour, and 4-hour could work however, the daily avoids noise and can show clearer trend context. |
| Volume Filter | Could be necessary in the even that the OBV is flat. |
| Avoid in Volatile Swings | This pattern is not meant for the highly volatile markets. |
| Pair With Trend Filter | Can be complemented with MA or the ADX to confirm trend context. |
| Entry Timing | Waiting for candle confirmation or a major break above a significant low or high. |
| Trade Management | Using a tight stop loss, or even using partial exits, can be safe given this pattern’s reversal nature. |
MACD Steady trending Relative to Zero + OBV Extreme
Our seventh pattern, that is indexed 6, is a trend-volume climax detection pattern. It spots a strong trend in a given direction, where the MACD sticks to a particular side of the zero line, and it pairs this with peaks in OBV volume. It seeks trend continuations. The buy signal is registered where the MACD remains positive for 12 bars, while concurrently the OBV is close to or above its 12-candle high, implying buyers are aggressively accumulating. This can be interpreted as the market being in a steady bullish momentum, with volume portending trend continuation. We implement this as follows in MQL5:
//+------------------------------------------------------------------+
//| Check for Pattern 6.                                             |
//+------------------------------------------------------------------+
bool CSignalMACD_OBV::IsPattern_6(ENUM_POSITION_TYPE T)
{  int _index = -1;
   m_macd.Refresh(-1);
   m_obv.Refresh(-1);
   if(T == POSITION_TYPE_BUY && m_macd.MinValue(0, X(), 12, _index) > 0.0 && OBV(X()) >= m_obv.MaxValue(0, X(), 12, _index))
   {  return(true);
   }
   else if(T == POSITION_TYPE_SELL && m_macd.MinValue(0, X(), 12, _index) < 0.0 && OBV(X()) <= m_obv.MaxValue(0, X(), 12, _index))
   {  return(true);
   }
   return(false);
}
The sell signal characteristics are the inverse, with the MACD being sub-zero for 12 candles or more and the OBV also being close to or at its 12-candle low. This is interpreted as a market under steady bearish control, as the OBV confirms that sellers are driving price with strong volume. This signal pattern also did not forward walk, bringing the total that have failed with this indicator pairing to 7 this far. Its report is below.

Pattern-6’s usage recommendations are also shared below:
| Area | Recommendation |
|---|---|
| Use in Trending Markets | Pattern-6 thrives in strong, directional markets. Flat or range-bound markets are a no-no. |
| Momentum Strength | An optional filter to confirm strength can be the ADX, with readings above 25 being a prerequisite for entry. |
| Combine with Price Action | Breakout candles, inside bars, or pin bar rejections in S/R zones can be considered. |
| Volume Validity | OBV should show a steady slope with no spiky/flat OBV patterns. |
| Exit Strategy | The use of trailing stops or exiting at Fibonacci extension can be considered. |
MACD Hidden Divergence + OBV Extreme
Our eighth signal pattern, has its buy characteristics set by declining price lows, rising MACD, and an upward trending OBV. This can be interpreted as price not dropping low enough while volume was increasing and the bullish momentum was in play as evidenced by the MACD. We code this as follows in MQL5.
//+------------------------------------------------------------------+
//| Check for Pattern 7.                                             |
//+------------------------------------------------------------------+
bool CSignalMACD_OBV::IsPattern_7(ENUM_POSITION_TYPE T)
{  if(T == POSITION_TYPE_BUY && Low(X()) > Low(X() + 1) && MACD(X()) < MACD(X() + 1) && OBV(X()) > OBV(X() + 1))
   {  return(true);
   }
   else if(T == POSITION_TYPE_SELL && High(X()) < High(X() + 1) && MACD(X()) > MACD(X() + 1) && OBV(X()) < OBV(X() + 1))
   {  return(true);
   }
   return(false);
}
The sell setup conversely has rising highs, a declining MACD and a falling OBV. Like the bullish, it points to a hidden divergence. Of all our ten signal patterns, for this article, this is the only one that forward walks profitably. Its test report is shared below.

Recommendations on further fine-tuning or improving this pattern are also shared below:
| Area | Best Practice |
|---|---|
| Confirm with Structure | This pattern could be sharpened by opening trades trend lines, S/R, or Fibonacci zones. |
| Stack with Other Signals | Adverse excursions could also be minimised by incorporating RSI divergence or candle reversal patterns such as the hammer, engulfing, etc. |
| Avoid in Strong Trends | This is not a trend-following pattern, so scalpers need to steer clear. |
| Use Stop-Loss Wisely | Placing stops beyond recent swing high/low assumes short-term reaction, not long-term trend change. |
MACD Signal Crossover and OBV Support
Our penultimate signal pattern has its buy conditions satisfied when the MACD is above 0 following a U turn upward. This also happens with OBV indicating positive volume flow. It is a bullish momentum shift that is confirmed by volume expansion. We code this as follows in MQL5:
//+------------------------------------------------------------------+
//| Check for Pattern 8.                                             |
//+------------------------------------------------------------------+
bool CSignalMACD_OBV::IsPattern_8(ENUM_POSITION_TYPE T)
{  if(T == POSITION_TYPE_BUY && MACD(X() + 1) > 0.0 && MACD_UP(X())  && OBV(X()) > OBV(X() + 1))
   {  return(true);
   }
   else if(T == POSITION_TYPE_SELL && MACD(X() + 1) < 0.0 && MACD_DN(X())  && OBV(X()) < OBV(X() + 1))
   {  return(true);
   }
   return(false);
}
The sell signal has the MACD in bearish territory, below zero, following an n-turn downward. OBV would also be falling from selling volume pressure. This pattern, unfortunately, like most in this article, is also unable to forward walk profitably. Its report is given below:

Possible measures that can be taken to improve its performance are tabulated below:
| Focus Area | Suggestion |
|---|---|
| Entry Timing | Trade immediately after MACD crossover only if OBV agrees. Avoid lag. |
| Volume Validation | OBV should not contradict or even mis-align with the crossover. Flat or diverging OBV should be avoided. |
| Combine With Price Structure | Like many signals, this pattern is more potent at key S/R levels. |
| Avoid Ranges | In sideways markets, MACD crossover signals can be noisy despite OBV confirmation. Trade on trending assets. |
| Stop Placement | Use ATR or recent candle highs/lows to place dynamic stops — pattern implies trend pickup, not just bounce. |
MACD Signal Crossover at zero and OBV Surge
Our final pattern, pattern-9, is a trend reversal signal that tries to pick the beginning of a new trend. Early entry after trend shift is meant to maximize capturing of profits, but one, as always, needs to be wary of adverse excursions. The buy signal is when the MACD crosses zero from below to close above it in the midst of a u-turn. OBV would also be appreciating noticeably, north of 5 percent. We implement the MQL5 as follows:
//+------------------------------------------------------------------+
//| Check for Pattern 9.                                             |
//+------------------------------------------------------------------+
bool CSignalMACD_OBV::IsPattern_9(ENUM_POSITION_TYPE T)
{  if(T == POSITION_TYPE_BUY && MACD(X() + 1) < 0.0 && MACD(X()) > 0.0 && MACD_UP(X())  && OBV(X()) >= 1.005 * OBV(X() + 1))
   {  return(true);
   }
   else if(T == POSITION_TYPE_SELL && MACD(X() + 1) > 0.0 && MACD(X()) < 0.0 && MACD_UP(X())  && OBV(X()) <= 0.995 * OBV(X() + 1))
   {  return(true);
   }
   return(false);
}
The sell-pattern that mirrors the bullish would also have the MACD cross the zero from above to close below it in an n-turn. OBV would concurrently drop by a sizeable percent. We are using 5% as this threshold is very sensitive, however readers can experiment with different values. Unfortunately, with our small test window of 2 years, this pattern was also not able to forward walk profitably. Its report is given below:

It could be improved by any of the following measures, as we have also argued for the other 9 patterns above as well.
| Category | Best Practice |
|---|---|
| Asset Selection | Best used on instruments with strong daily volume—major forex pairs, indices, and highly liquid stocks or cryptocurrencies. |
| Market Conditions | Should be avoided in sideways markets, where MACD zero-line crossovers can generate many false signals. Combination with trend indicators like ADX could be more significant. |
| Volume Thresholds | The OBV filter (e.g., 0.5%) can be tuned basing on the market. Higher thresholds can be adopted for volatile assets like crypto. |
| Trade Management | Use of dynamic stop-loss (e.g., based on ATR or swing lows/highs) can be applied. Set initial take-profit based on risk-reward (e.g., 1:2) can be considered. |
| Filtering Noise | To improve reliability, combine Pattern-9 with candlestick confirmations, as also mentioned with the other signal patterns above. |
Conclusion
We have introduced the indicator pairing of a trend and volume indicator for this article, with dismal test results. Forward walks on a 50-50 test data split are always a stretch when the test data window is as small as ours , however these results when compared to other indicator pairings we have looked at in the past are clearly below par. We typically, follow-up indicator pairing introductions with applications of supervised learning and since, based on our last iteration, we now look at patterns that failed to forward walk; we are spoiled for choice in the next article.
| name | description |
|---|---|
| WZ-71.mq5 | Wizard Assembled Expert Advisor whose header indicates files used in a.ssembly |
| SignalWZ-71.mqh | Custom Signal Class file of Indicator Pairing |
Warning: All rights to these materials are reserved by MetaQuotes Ltd. Copying or reprinting of these materials in whole or in part is prohibited.
This article was written by a user of the site and reflects their personal views. MetaQuotes Ltd is not responsible for the accuracy of the information presented, nor for any consequences resulting from the use of the solutions, strategies or recommendations described.
- Free trading apps
- Over 8,000 signals for copying
- Economic news for exploring financial markets
You agree to website policy and terms of use