Wave Trend Oscilator

# Wave Trend Oscillator (WTO) User Guide

## Overview
Wave Trend Oscillator is a powerful technical analysis tool used to analyze price momentum and trend direction. It visualizes market conditions using two main lines (WT1 and WT2) and a histogram.

## Components
1. **WT1 (Green Line)**: Main trend indicator
2. **WT2 (Red Line)**: Signal line
3. **Histogram (Blue)**: Shows the difference between WT1 and WT2
4. **Arrows**: Mark crossover points
   - Green Arrow: WT1 crosses above WT2 (Buy signal)
   - Red Arrow: WT1 crosses below WT2 (Sell signal)
5. **Overbought/Oversold Levels**:
   - OB1 (60): Overbought level 1
   - OB2 (53): Overbought level 2
   - OS1 (-60): Oversold level 1
   - OS2 (-53): Oversold level 2

## Parameters
- **n1 (10)**: Channel length
- **n2 (21)**: Average length
- **obLevel1 (60)**: Overbought level 1
- **obLevel2 (53)**: Overbought level 2
- **osLevel1 (-60)**: Oversold level 1
- **osLevel2 (-53)**: Oversold level 2
- **scaleMinimum (-100)**: Minimum scale value
- **scaleMaximum (100)**: Maximum scale value
- **autoScale (true)**: Auto scaling

## Signal Types

### 1. Crossover Signals
- **Buy Signal**: WT1 crosses above WT2 (green arrow)
- **Sell Signal**: WT1 crosses below WT2 (red arrow)

### 2. Overbought/Oversold Signals
- **Overbought**: WT1 exceeds OB1 level
- **Oversold**: WT1 falls below OS1 level

### 3. Momentum Signals
- **Strong Trend**: Histogram width increasing
- **Trend Weakening**: Histogram width decreasing

## Trading Strategies

### 1. Basic Crossover Strategy
- Buy when WT1 crosses above WT2
- Sell when WT1 crosses below WT2

### 2. Overbought/Oversold Strategy
- Consider selling when WT1 exceeds OB1 level
- Consider buying when WT1 falls below OS1 level

### 3. Momentum Confirmation
- Confirm crossover signals with histogram width
- Expanding histogram indicates strong trend

## Risk Management
- Set stop-loss levels for each signal
- Reduce position size in overbought/oversold areas
- Adjust position size according to trend direction

## Recommendations
1. Use this indicator in combination with other technical analysis tools
2. Test on different timeframes
3. Optimize parameters according to market conditions
4. Never neglect risk management rules

This guide explains the basic usage of the Wave Trend Oscillator. You can use this information to develop your own trading strategy.

おすすめのプロダクト
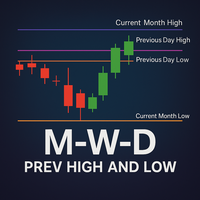
一目で分析を強化! このインジケーターは、価格が最近反発または突破した重要なレベルを自動的に描画し、手動でラインを引くことなくサポートとレジスタンスのゾーンを表示します。チャートに適用するだけで、各期間の過去の高値・安値ラインが表示されます。 各ラインの意味 Previous Month High ‣ 前月高値:前の月の期間内で記録された最高価格。 Previous Month Low ‣ 前月安値:前の月の期間内で記録された最安価格。 Previous Week High ‣ 前週高値:前の週の期間内で記録された最高価格。 Previous Week Low ‣ 前週安値:前の週の期間内で記録された最安価格。 Previous Day High ‣ 前日高値:直前の取引日の最高価格。 Previous Day Low ‣ 前日安値:直前の取引日の最安価格。 なぜ使うのか? グラフを開いた瞬間に 反発 と 突破 を検出。 実績あるゾーンで 利確 と 損切り を設定。 SMC や ICT 戦略に必須、市場構造をベースにエントリーと決済を最適化。 スキャルピング 、 スイング
概要 外国為替や金融市場では、迅速な反応と正確な意思決定が非常に重要です。しかし、標準のMetaTrader 5端末は最小でも1分のチャートしかサポートしておらず、トレーダーが市場の変動に敏感であることを制限しています。この問題を解決するために、 秒単位チャートキャンドルインジケーター を導入しました。このインジケーターを使用すれば、1秒から30秒の市場の動向をサブチャートで簡単に表示・分析できます。 主な機能 複数の秒単位タイムフレームのサポート :このインジケーターは、以下のタイムフレームを選択でき、さまざまな取引戦略に対応します: S1 : 1秒 S2 : 2秒 S3 : 3秒 S4 : 4秒 S5 : 5秒 S10 : 10秒 S15 : 15秒 S20 : 20秒 S30 : 30秒 リアルタイム更新 :秒単位チャートはリアルタイムで更新され、各瞬間に最新の市場情報を提供します。これにより、迅速な取引判断が可能になります。 ユーザーフレンドリーなインターフェース :インジケーターはサブチャートに表示され、直感的で使いやすいです。異なるタイムフレームに素早く切り替えて市場を迅速
Iron Entry — Real-Time Signal Engine with Trend Filter & Momentum Candles Why You Should Choose This Indicator Most signal tools redraw their arrows after the fact, by the time you notice a "signal," it's already changed or vanished. Iron Entry doesn't do that. This indicator locks in its pivots and signals the moment they close, and once printed, they never move, disappear, or repaint.  What you see live is exactly what stays on your chart tomorrow, next week, and next year. That means you c
Introduction This indicator detects volume spread patterns for buy and sell opportunity. The patterns include demand and supply patterns. You might use each pattern for trading. However, these patterns are best used to detect the demand zone (=accumulation area) and supply zone (=distribution area). Demand pattern indicates generally potential buying opportunity. Supply pattern indicates generally potential selling opportunity. These are the underlying patterns rather than direct price action. T
ProTrade Control MT5 Buy this product and get a chance to win one of our other products! https://www.mql5.com/tr/users/bilisimprofesoru/seller Your Complete Trade Control Center ProTrade Control MT5 is a comprehensive trade management panel developed for traders who use manual and semi-automated trading methods. It allows you to manage order placement, risk calculation, position management, trailing stop, break-even, partial closing, scheduling, and many other functions through a single profes
Equity Shield 2 for MT5 Equity Shield 2 monitors your account limits while you trade. Set daily drawdown, maximum drawdown, daily profit and account profit targets, then track your remaining room live from one on-chart panel. When an enabled limit is reached, Equity Shield 2 can close your open positions and alert you. Built for prop firm challenges and traders who want an additional layer of account protection. Account protection Monitor up to four account limits: Daily drawdown Maximum accoun
SignalReplicator は、Telegram チャンネルのシグナルをご自身の MetaTrader 5 口座にコピーします。チャンネルがシグナルを投稿すると、あなたのロットとあなたの制限で、ターミナルに注文が入ります。スマホに張り付く必要はなく、エントリーに遅れることもありません。 Telegram の API キーもボットも不要です。普通の Telegram アプリと同じように、電話番号と Telegram から届くコードでログインするだけで、あなたのアカウントが参加しているすべてのチャンネルとグループ(非公開や VIP も含む)を読み取れます。 仕組み 1. SignalReplicator のリーダーアプリ(無料、購入に含まれます)があなたの PC で動作し、あなたのアカウントで選んだ Telegram チャンネルを読み取ります。読み取るだけで、投稿したり誰かにメッセージを送ったりすることはありません。 2. チャンネルが "BUY XAUUSD 4182 SL 4172 TP 4195" のようなシグナルを投稿すると、リーダーが銘柄、方向、エントリー、ストップロス、タ
Every Trader trades in a market zone. If you are not living in the time zone you are trading, you need a clock to show you what time it is in your favorite time zone, and it should be small at the same time to not interrupt your trading process.  In this small indicator, you have access to 3 major clocks around the world, and you can easily look at them. We have some other products that I am sure will help you with your trading career. Please have a look at the link: LINK our all-in-one trading
Topos e fundos com fibo
Paulo Henrique Sanches Bonanni
PHSB_トップ_ボトム 市場の極値と現在の市場構造を、より明確に把握する PHSB_トップ_ボトム は、MetaTrader 5向けに開発されたインジケーターです。 一定の市場レンジ内における価格構造 を視覚的に把握しやすくし、主要な極値と中間領域を明確に表示することを目的としています。 トップ と ボトム を視覚的に識別するだけでなく、その他の重要な情報も1つのインターフェースに集約。トレーダーは、分析対象となる価格レンジ、市場の相対的な位置、直近のローソク足の動きを同時に確認できます。 コンセプトはシンプルです。 チャート上に分散した情報を減らし、分析のためのコンテキストを増やす。 トップとボトムの識別 このインジケーターの主な機能は、分析対象となるレンジの極値を識別することです。 PHSB_トップ_ボトム は、チャート上に直接以下を表示します。 レンジのトップ レンジのボトム レンジの中央 中間の参考領域 これらのレベルはチャート上に表示され、現在の価格構造を視覚的に把握しやすくします。 分析に使用するローソク足の本数は、ユーザーが設定できます。 市場レンジを1つの
FREE
RSImaxmin
Carlos Andrés Moya Erazo
4.5 (10)
The indicator shows when there are overprice and divergences on the RSI. In addition, it has configurable alerts, dynamic overprice levels and a special “RSI cleaner” function. The indicator that automatically calculates the premium rates! RSImaxmin is an indicator based on the Relative Strength Index (RSI) oscillator that effectively identifies changes in price trends as it reflects the relative strength of bullish movements compared to bearish movements. It is widely used by traders to measur
Candle Countdown Utility
AL MOOSAWI ABDULLAH JAFFER BAQER
Candle Countdown Know exactly when the next candle begins. Trade with perfect timing. Candle Countdown is a professional MetaTrader utility that displays a precise, real-time countdown timer for the current candle on any chart and timeframe. By showing exactly how much time remains before the current candle closes and the next one begins, the utility helps traders improve entry timing, manage exits more effectively, and avoid making decisions based on incomplete price action. Whether you're a sc
NeuroTrend Dashboard – Advanced Multi-Asset Market Intelligence NeuroTrend Dashboard is a professional-grade technical analysis suite designed to provide a high-level, "bird’s-eye view" of market momentum across multiple symbols and timeframes simultaneously. By synthesizing complex proprietary momentum, real-time currency strength, and volume flow data, NeuroTrend distills the pulse of the market into a clean, actionable interface. Stop wasting time switching between individual chart windows. N
HedgingMonitor: Visual Control for Hedging Operations HedgingMonitor: Professional Order Visualization for MT5 HedgingMonitor is a professional indicator for MetaTrader 5 that displays detailed information about all your open and pending orders in an organized and customizable visual panel. Ideal for traders who use hedging strategies or manage multiple orders simultaneously. Key Features: Intuitive Visual Interface: View all your orders in a single panel, with color coding to quickly identify b
TrendCue Core
Mohammadreza Faghanimakrani
Trade with a clearer chart and a defined exit plan. TrendCue Core gives clear BUY and SELL signals after the candle closes, helping you read the chart and manage each setup more easily. SPECIAL BONUS: After purchasing TrendCue Core, leave a comment on the product page or send me a private message to receive the TrendCue Scanner bonus. When a setup qualifies, Core shows a fixed Entry and three targets: TP1, TP2 and TP3. The exit plan is simple: price can reach the predefined targets, or the
Paid release: Session VWAP Bands MT5 is a paid MetaCoderStore indicator. Use the product comments for setup questions, feature requests, and feedback for future updates. Session VWAP Bands plots the session volume-weighted average price and adaptive deviation bands directly on the chart. It helps you see where price is trading relative to the current session's fair-value area. Use it to spot Price holding above or below session VWAP. Mean-reversion areas near the first deviation bands. Stretched
推測をやめて、統計的優位性を持って取引を始めましょう 株価指数はFXとは異なる動きをします。決まったセッションがあり、オーバーナイトでギャップが発生し、予測可能な統計パターンに従います。このインジケーターは、DAX、S&P 500、ダウ・ジョーンズなどの指数を自信を持って取引するために必要な確率データを提供します。 何が違うのか ほとんどのインジケーターは何が起こったかを示します。このインジケーターは次に何が起こる可能性が高いかを示します。毎取引日、インジケーターは100日間のヒストリカルデータに対して現在のセットアップを分析します。類似のギャップ、類似のオープニングポジションを持つ日を見つけ、価格が主要なレベルに到達した頻度を正確に計算します。ギャップが埋まるか、昨日の高値がテストされるかの推測はもう必要ありません。実際のデータに基づいた正確なパーセンテージが得られます。 すべての入力パラメータを説明した完全なマニュアルはこちら: https://www.mql5.com/en/blogs/post/766370 優れたセットアップを見つけるための戦略ガイドはこちら: https:/
Session Volume Profile — Stepped POC & Value Area Short description (MQL5 summary field) Multi-session Volume Profile displaying POC and Value Area (VAH/VAL) as developing step lines. Tokyo, London, New York, Daily and a custom session can be displayed simultaneously, each with its own hours, its own levels and its own colour. Works with both real volume (futures, stocks) and tick volume (Forex, CFDs). Full description The problem A standard Volume Profile draws a flat POC line across the whole
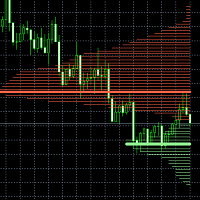
This easy to setup indicator shows you the market volumes in a different way, with support and resistance as showed. You can setup: - Backdays volume to show - Heiken Ashi candle view It works for every kind of graph and every kind of period. The program shows the volumes based on the number of candles displayed in the chart: the more candles the more volumes. Enjoy this very useful indicator. Please feel free to message me to report any kind of improvements! :D
Multi Prop Risk Guardian watches the whole account and acts before a prop-firm loss limit is reached. It does not open trades and does not contain a trading strategy. Attach it to any chart: it does not need to be the chart of the symbol you trade, because it watches every position on the account. It works alongside manual trading and other Expert Advisors. How it decides Checks equity on every tick and on a timer (4 times per second), independent of the chart symbol, so a quiet chart does not
Gann Pulse は MetaTrader 5 用のリペイントしないトレンドシグナル・インジケーターです。バーが確定すると明確な買い(BUY)または売り(SELL)の矢印を表示し、エントリー価格、損切り(Stop Loss)、3 つの利確(Take Profit)レベルを即座に描画します。理論の知識は不要です。チャートに設定してシグナルに従うだけです。 コンセプト W. D. ギャンの古典的なルールには「トレンドに逆らって取引しない」「必ず損切りで取引を守る」という 2 つがあります。Gann Pulse はその両方に従います。独自のモメンタムエンジンが相場の「脈動」が新しい方向へ転じる瞬間を捉え、すべてのシグナルに完全なトレードプランが付きます。 主な機能 - 買い・売りの矢印はバー確定時に固定され、リペイント・移動・消失は一切ありません。 - 現在のシグナルのエントリー、損切り、TP1、TP2、TP3 ライン。到達したレベルはチャート上に表示されます。 - 履歴ボックス:過去のすべてのシグナルを pips 単位の結果付きのリスク/リワードボックスで表示。取引前に自分のチャ
CISD Levels Pro automatically draws CISD Buy and Sell levels directly on your chart. It highlights pending levels while they are forming, then marks confirmed levels after the confirmation candle closes. Optional confirmation arrows help you spot the signal quickly. This tool is designed for traders who want clean, simple CISD level visualization without extra indicators or clutter. Key Features Draws Bullish (BUY) CISD levels and Bearish (SELL) CISD levels Shows Pending levels (dashed) and
QueenAlgoAdvisor is your pre‑trade decision engine , built to advise when to enable your bots algo and when not. It acts as a quant intelligence filter , analyzing market structure, volatility regimes, liquidity flow, and directional bias — then advising you whether your algo bots should be enabled or paused. This indicator doesn’t generate random signals. It provides strategic activation guidance , showing you when the market is stable, readable, and favorable for automated systems — and when c
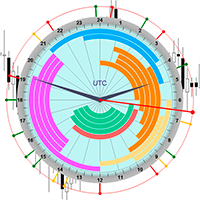
The professional browser of News and Trading Sessions is now available in MetaTrader 5. Now all the most important market information is collected on one dial! News located on the Time scale. Planning your working time has never been so easy and convenient ... The news scale can be switched a day, two, a week, a month forward or backward (see the details in the short video). All news updates in real time. Thanks to the built-in filters, you can configure the display of news by importance, cou
Build an HFT Bot with source code.  This specialized algorithm in the bot will build an HFT bot for you, to alter, enhance and optimize to trade by.  The algorithm in the bot is a special recipe to build an HFT program.  One that you can enhance upon creation. Just follow the steps: Load the bot on a chart Wait for it to load, could takes some time depending on computer, refresh chart if needed (USE DEMO SO IT WON'T MAKE REAL TRADES WHILE YOU BUILD).  THIS IS BEING USED AS A BUILDER NOT AN EA A
Most traders never actually find out whether the signal they follow makes money. Signal Verdict answers that on your own chart. It replays your entry rule across history, opens and closes a simulated position for every signal, and reports what really came out: win rate, expectancy in R, profit factor, drawdown, and how often each take profit was reached. It is not limited to its own signals. Signal Verdict can read the buffers of any indicator installed on your terminal, so the arrows you are
Session Killzones Asia London New York marks the most important trading sessions on your chart. Asia, London and New York session boxes , each labelled with its range in pips. Previous Day High and Low (PDH / PDL) levels. Asian range breakout alerts during London and New York. Automatic broker GMT offset detection , with a manual override. Session hours you can change, given in GMT. Custom colors and the number of days to show. Inputs Detect broker GMT offset automatically / Manual GMT offset –
PATFX Premium: Smart Signals, Structure and Clean Trade Levels PATFX Premium puts BUY/SELL signals, market structure and key price levels on your chart without covering your candles. The entry, stop loss and three take-profit levels are drawn in the empty space to the right of the last candle, with their prices. Main features BUY/SELL arrows.   Signals come from an EMA cross filtered by a trend EMA. Three modes: Aggressive (cross only), Balanced (cross plus trend EMA) and Conservative (also requ
Only 5 copies of the EA at $30! Next price --> $45 Find charts and signals based on harmonic patterns, which work great in 1-hour timeframes and up. Buy and sell signs based on different harmonic patterns as follows: 0: ABC_D 1: ABCD_E 2: 3Drive 3: 5_0 4: Gartley 5: Bat 6: Crab 7: Butterfly 8: Cypher 9: NenStar 10: Shark 11: AntiBat 12: AntiGartley 13: AntiCrab 14: AntiButterfly 15: AntiCypher 16: AntiNenStar 17: AntiShark How to use: When there is an opportunity to buy or sell, you have 5:
The TradeMetrics Pro indicator enhances trade analysis and performance evaluation by presenting trade history and metrics directly on the chart. It accomplishes this through three key features: Summary Trade Panel: The Summary Trade Panel provides a concise overview of open and closed trades. It organizes trade summaries by symbol, lots traded, pips gained or lost, profit, and advanced statistics. This panel enables quick assessment and comparison of trade performance across different symbols.
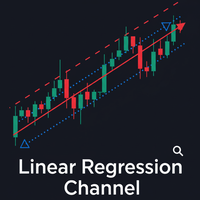
The Linear Regression Channel is a powerful technical analysis tool that helps visually identify the prevailing trend and potential price zones. Essentially, the indicator performs two main functions: It draws a trendline through the center of price action over a specified period. This line is calculated using the linear regression method, which results in the best possible "line of best fit" for the price data. From this center line, the indicator plots two parallel lines above and below, creat
FREE
このプロダクトを購入した人は以下も購入しています
Trend Sniper X
Sarvarbek Abduvoxobov
4.86 (44)
Trend Sniper X は、トレードの方向性と潜在的な反転ポイントを明確かつ正確に特定するのに役立つ、MetaTrader 5 用のマルチタイムフレーム・トレンドフォロー指標です。 MT4用: https://www.mql5.com/en/market/product/193245 価格情報: 現在の価格はプロモーション価格であり、今後のアップデートや新機能のリリースに伴い変更される場合があります。 ボーナス特典: このインジケーター用の無料自動売買アシスタントEAを入手するには、購入後に an 著者(開発者)へメッセージをお送りください。 Code2Profit チャンネル マルチタイムフレーム分析で相場をマスターしよう! Trend Sniper X で勝率を最大化する方法:重要なルールとセッションのコツ 技術仕様 プラットフォーム MetaTrader 5 インジケータータイプ マルチタイムフレーム・トレンドインジケーター 操作タイムフレーム あらゆるチャートタイムフレームに対応。個別に選択可能な上位タイムフレーム (M1–MN1) を搭載 主要銘柄 FX、ゴールド (X
新たな王者が登場 - インジケーター + 注文管理表示(TP1 + TP2 + TP3)+ オプションのTelegramシグナル送信機能付き(無料) (完全なトレード&シグナルシステム) ゴールド向け最高のEA: Gold Slayer このインジケーターには、高度な戦略、カスタマイズ可能な注文管理システム、そしてエンベロープ拡張を組み合わせた平均回帰システムが搭載されています。さらに、RSIなど複数のインテリジェントな確認フィルターによって、高確率の反転エントリーをBUY・SELLシグナルとして検出します。 単にトレードを学ぶだけでなく、複数ポジションを効果的に管理し、過去に利益を出しているオープンポジションで損失トレードをカバーする方法も学べます。 M5向けに構築・最適化されており、流動性が高くシグナルの精度が安定しているBTCUSDとXAUUSDで優れたパフォーマンスを発揮します。 このインジケーターは、ATRを基に自動計算されたエントリー、ストップロス、テイクプロフィットレベルを備えた明確なLong・Shortシグナルを提供するため、リスク管理が最初から組み込まれています。 マ
Smart Trend Trading System — MetaTrader 5 ご購入後、MQL5で私にメッセージをお送りいただくと、Smart Universal Expert Advisorを無料で受け取れるほか、オンライン講座、PDFマニュアル、非公開グループへのアクセスもご利用いただけます。 STTSは、トレンドの方向、エントリー・決済シグナル、反転ゾーン、重要な価格水準をチャート上にまとめて表示します。システムを参考に手動で取引することも、別の対応EAを接続し、ご自身で選んだ設定に基づいて自動売買することもできます。 ひとつのシステム、4つのトレードアプローチ STTSのトレードアプローチは、大きく4つのカテゴリーに分かれています。 • スキャルピング — 短期的なシグナルや相場の動きを捉えます。 • トレンドトレード — 方向性を評価し、トレンド内の機会を探します。 • 反転トレード — 反転の可能性があるゾーンや方向の変化を見つけます。 • 出来高トレード — 出来高に基づく情報を使い、市場の活発さを評価します。 エントリー・決済の矢印、トレンド情報、サポート・
Entry Points Proは、注文を出す前に、どこでエントリーし、どこにストップを置き、どのロットで取引するかを示します。 価格 現在 199 USD、この価格での販売は 8 本です。その後は 249 USD、最終価格は 349 USD です。 私は相場のトレードで収入を得ており、それを公開しています。だから、このインジケーターを誰にでも売る必要はありません。自分の頭で考えるトレーダーのためのツールであり、魔法のボタンではありません。 ブレイクがなければ取引もありません。グレーの矢印はキャンセルされたシグナルです。価格がシグナル足をブレイクしなかったため、エントリーも損失もありません。 矢印はローソク足の確定時に表示され、リペイントしません。設定は2つ:あなたの資金と1回のトレードあたりのリスクです。 お支払い前にご確認ください:無料デモはMT5のストラテジーテスターで動作し、2分で済みます。ご購入後は、私が個人的に設定をお手伝いします。 2019年、私はこのインジケーターの実力を世界中に示しました。そのシグナルに従って手動で、リアル口座で、公開の場でトレードしたのです。口座は
Gann Made Easy   は、ミスター・ギャンの理論を使用した取引の最良の原則に基づいた、プロフェッショナルで使いやすい外国為替取引システムです。 W・D・ガン。このインジケーターは、ストップロスとテイクプロフィットレベルを含む正確な買いと売りのシグナルを提供します。 PUSH通知を利用して外出先でも取引可能です。 ご購入後、取引方法の説明と優れた追加インジケーターを無料で入手するには、私にご連絡ください! おそらく、ギャンの取引手法についてはすでに何度も聞いたことがあるでしょう。通常、ギャンの理論は初心者のトレーダーだけでなく、すでにある程度の取引経験がある人にとっても非常に複雑なものです。なぜなら、ギャンの取引手法は理論的にはそれほど簡単に適用できるものではないからです。私はその知識を磨き、最良の原則を私の外国為替インジケーターに組み込むために数年を費やしました。 このインジケーターは非常に簡単に適用できます。必要なのは、それをチャートに添付し、簡単な取引推奨事項に従うだけです。このインジケーターは常に市場分析の仕事を行い、取引の機会を探します。適切なエントリーポイントを検
SuperScalp Pro
Van Minh Nguyen
4.54 (37)
SuperScalp Pro - Professional Multi-Layer Confluence Scalping System SuperScalp Proは、複数の高度な確認フィルターを追加することで、従来のSupertrendを強化したスキャルピング向けインジケーターです。誤ったシグナルを大幅に減らしながら、成功する可能性がより高いBuy/Sellの取引機会を見つけるのに役立ちます。 BuyとSellの矢印がチャート上に明確に表示され、ATRに基づくStop LossとTake Profitのレベルもリアルタイムで自動計算されます。 ご購入後、MQL5で私にメッセージを送っていただくと、SuperScalp Pro Auto Trader EAを無料で受け取れるほか、ユーザーガイドとプライベートグループへのアクセスもご利用いただけます。 推奨設定ファイルをダウンロード: [Set File] 詳細なドキュメントは製品ブログでご覧いただけます: [User Guide] 最新情報を受け取るには公式チャンネルにご参加ください: [Official Channel] Sup
ULTRAは、「オールインワン」方式で機能するテクニカル指標です。市場を独自に分析し、売買シグナルを生成し、ストップロス注文を設定するための水準を表示し、利益を確定したり損失を最小限に抑えたりするためにポジションを決済すべきタイミングを提案します。 つまり、市場の分析方法や、水準(ストップロスをどこに設定すべきか)の見極め方がわからなくても、あるいは資金管理に苦労していても問題ありません。ULTRAがすべて代行してくれます! 購入者限定特典 :「ULTRA」インジケーターをご購入後、私にプライベートメッセージをお送りいただければ、「ULTRA BOT」を無料プレゼントとしてお受け取りいただけます。これは、このインジケーターからのシグナルに基づいて、オープンしたトレードを管理するのに役立つ特別なツールです(各トレードにストップロスを設定し、最適な結果が得られるよう、戦略のルールに従って自動的にトレードを決済します)。  また、インジケーターを最大限に活用できるよう、さまざまな資産向けの既成の設定も購入者の皆様に提供しています。これらの「超お得な特典」を無料で入手するには、私へダイレクトメ
Boba Analysis Suite
Trade Ready Solutions LLC
5 (2)
Boba Analysis Suite Boba Analysis Suite は、MetaTrader 5 向けの分析インジケーターです。市場構造、重要な価格帯、相場全体の状況を、一つのチャート画面にまとめて表示します。 トレーダーおよびトレーディング指導者としての実務経験をもとに開発され、市場の方向性の評価、重要な価格水準の特定、複数の時間足を組み合わせた分析など、体系的な分析プロセスを支援します。 相場の背景を踏まえた分析 個々のシグナルの意味は、相場の状況によって変わります。Boba Analysis Suite は、現在のチャート状況をより大きな市場構造と関連付け、あらかじめ定めたルールに沿って取引アイデアを検討するための分析を支援します。 主な分析機能: トレンドと市場構造: 市場の方向性と、その背景にある構造を評価します。 重要な価格帯と価格水準: さらに分析すべき重要な領域を視覚的に表示します。 複数の時間足: 異なる時間足の情報を組み合わせ、相場全体の状況を評価します。 視覚的な分析プロセス: 分析情報をチャート上で直接確認できます。 自主的な取引判断を支援 Boba
FX Power: 通貨の強弱を分析して、より賢い取引を実現 概要 FX Power は主要通貨と金の実際の強弱をあらゆる市場状況で理解するための必須ツールです。強い通貨を買い、弱い通貨を売ることで、 FX Power は取引の意思決定を簡素化し、高い確率の取引機会を見出します。トレンドを追従する場合でも、極端なデルタ値を使用して反転を予測する場合でも、このツールはあなたの取引スタイルに完全に適応します。ただ取引するだけではなく、 FX Power で賢く取引をしましょう。 1. なぜ FX Power がトレーダーにとって非常に有益なのか 通貨と金のリアルタイム強弱分析 • FX Power は主要通貨と金の相対的な強弱を計算し、マーケットダイナミクスに関する明確な洞察を提供します。 • どの資産がリードしているか、または後れを取っているかを監視して、取引するペアを賢く選びましょう。 マルチタイムフレームの包括的なビュー • 短期、中期、長期のタイムフレームで通貨と金の強弱を追跡し、マーケットトレンドに基づいて取引戦略を調整できます。 • スキャルピングからスイングトレード
M1 SNIPER は使いやすいトレーディングインジケーターシステムです。M1時間足向けに設計された矢印インジケーターです。M1時間足でのスキャルピングのためのスタンドアロンシステムとして、また既存のトレーディングシステムの一部としても使用できます。このトレーディングシステムはM1時間足での取引に特化して設計されていますが、他の時間足でも使用できます。元々、この手法はXAUUSDとBTCUSDの取引用に設計しましたが、他の市場においても役立つと考えています。 インジケーターのシグナルは、トレンドの方向と逆方向に取引できます。インジケーターのシグナルを利用して両方向に取引するのに役立つ特別な取引テクニックをご紹介します。この手法は、特別な動的なサポートとレジスタンスの価格帯を利用することに基づいています。 ご購入後、M1 SNIPER矢印インジケーターをすぐにダウンロードできます。さらに、M1 SNIPERツールのすべてのユーザーに、以下のスクリーンショットに表示されているApollo Dynamic SRインジケーターを無料で提供しています。この2つのインジケーターを組み合わせることで
FiboSniper Pro – Multi-Filter Fibonacci System with Auto SL/TP and Control Panel FiboSniper Proは、動的なFibonacci Envelopesと複数の確認フィルターを組み合わせ、選別されたBuyおよびSellシグナルを生成するテクニカルインジケーターです。FibonacciレベルはMoving AverageとATRを基に計算され、その後ADX、EMA、RSI、ATR、Volume、Time、Candle構造によってフィルタリングされます。インジケーターは、ATRに基づく自動Stop LossおよびTake Profitレベルをチャート上に直接表示し、さらに迅速な調整が可能なインタラクティブControl Panelを提供します。 ご購入後、MQL5で私にメッセージを送っていただくと、Auto Trader Xを無料で受け取れるほか、このインジケーターの取引シグナルを自動化する方法についての説明もご利用いただけます。 User GuideとSet Files: [Click here] 完全
Apex Patterns PRO インジケーターをご購入いただくと、それに基づいたExpert Advisorを無料でご提供します。 自己最適化するチャートパターンおよびブレイクアウト分析システム 従来のパターンスキャナーは固定のパラメータに依存しているため、市場のボラティリティや構造が変化するとパフォーマンスが低下することがよくあります。 Apex Patterns PROは、構造的なチャートパターン認識、モメンタムフィルタリング、および統計的な自己最適化を単一の分析フレームワークに統合することで、変化する市場環境に適応するように設計されています。 適応型スキャンエンジン 自己最適化パターンモード 最近の履歴データから適切なパターンパラメータを自動的に検索し、静的な設定を使用するのではなく、現在の市場の動きに合わせてインジケーターの構造検出を適応させます。 スマートブレイクアウトフィルタリング 古典的なパターン認識と、モメンタム、ボリューム、プライスアクションの指標を組み合わせます。すべてのブレイクアウトを同じように扱うのではなく、システムが根底にある市場構造を評価し、現在の統計
Auto Optimized SpeedAngle は、継続的なウォークフォワード最適化(WFO:Walk-Forward Optimization)によりカーブフィッティング(過剰最適化)を排除した、機関投資家レベルのモメンタムベクトルシステムです。市場レジームの変化時に効果が低下する静的な入力に依存せず、アウトオブサンプル(OOS)検証を用いてパラメーターを動的に再キャリブレーションすることで、表示されるシグナルが単なる過去の偶然ではなく、確実な統計的優位性に基づいていることを保証します。 主な機関投資家向けフレームワーク ウォークフォワード最適化エンジン: ルックバック期間やしきい値の数千に及ぶ組み合わせを継続的にスキャンし、データをインサンプルとアウトオブサンプルに厳格に分離します。未検証のデータ環境において数学的優位性が証明された場合にのみ、新しいパラメーター設定を採用します。 定量的目的関数: 単なる純利益の追求ではなく、機関投資家レベルの安定性指標をターゲットとします。システム品質ナンバー(SQN)、期待値(1トレードあたりの平均Rマルチプル)、またはネットRの最適化を選
Sqn Max Indicator Sqn Max is an exclusive indicator to trade the market with high effectiveness. The indicator is based on price action, volatility and trend. This indicator is as simple as possible but not too simple. The indicator can generate alerts to ease the trading process. You don't have to stay all day in front of your screen. The indicator can be used with any class of assets and with any time frame. It is possible to achieve better results trading our list of selected assets. We achi
次回アップデート — バージョン 2.52 近日公開!【新機能】 市場分析とトレードワークフローを強化する、4つの主要な新機能にご期待ください 皆様のトレードニーズに応える4つの新機能により、市場分析を次のレベルへと引き上げます。新機能をご紹介します: 1. TRADE OVERVIEW DASHBOARD 2. CONFLUENCE AT ZONE 3. STRONG & WEAK HIGH/LOW 4. OTE 1. TRADE OVERVIEW DASHBOARD 市場全体の状況をより簡単に把握できるダッシュボードです。トレード判断をサポートするガイダンスを提供し、市場分析とトレード計画を体系的に行えるよう支援します。すべてを1つの画面で確認できます。 マルチタイムフレーム市場概要(Multi-Timeframe Market Overview) 市場の方向性と価格構造をより明確に把握 市場状況をすばやく確認 体系的な市場分析とエントリー計画のためのガイダンス 2. CONFLUENCE AT ZONE 価格が重要なゾーンに入るとき…いくつのサポート要因が一致しているかを確認で
このインジケーターを購入された方には、以下の特典を 無料 で提供しています: 各トレードを自動で管理し、ストップロスとテイクプロフィットを設定し、戦略ルールに基づいてポジションを決済する補助ツール 「Bomber Utility」 様々な銘柄に合わせたインジケーターの設定ファイル(セットファイル) 「最小リスク」、「バランスリスク」、「待機戦略」 の3つのモードで使用できる Bomber Utility 用の設定ファイル このトレーディング戦略をすぐに導入・設定・開始できる ステップバイステップのビデオマニュアル ご注意: 上記の特典を受け取るには、MQL5のプライベートメッセージシステムを通じて販売者にご連絡ください。 オリジナルのカスタムインジケーター 「Divergence Bomber(ダイバージェンス・ボンバー)」 をご紹介します。これは、MACDのダイバージェンス(乖離)戦略に基づいた 「オールインワン」型のトレーディングシステム です。 このテクニカルインジケーターの主な目的は、価格とMACDインジケーターの間に発生するダイバージェンスを検出 し、将来の価格の動きを示
Power Candles V3 - 自己最適化型強弱インジケーター Power Candles V3は 、通貨や銘柄の強さを、適用されたすべてのチャート上で実行可能なトレードプランに変換します。単にローソク足を色分けするだけでなく、バックグラウンドでリアルタイムの自動最適化を実行し、目の前の銘柄に対して最適なストップロス、テイクプロフィット、およびシグナルの閾値を提示します。ワンクリックで実取引に適用でき、エントリーポイント、ストップロス、テイクプロフィットのラインが正確な価格位置にチャート上に表示され、方向性を示すアラートがリアルタイムで発動します。 このツールは、Stein Investmentsのエコシステムの一部です。  18種類以上のツールをすべて閲覧し、AIを活用したセットアップの推奨事項を入手し、  https://stein.investments でコミュニティに参加しましょう クローズしたバーごとに3,000回以上のトレードシミュレーション。9つの強さの状態。2つの戦略を並行してテスト。勝率の高い設定をワンクリックで適用。 なぜこれが必要なのか ほとんどの強
通貨強さウィザードは、取引を成功させるためのオールインワン ソリューションを提供する非常に強力な指標です。このインジケーターは、複数の時間枠のすべての通貨のデータを使用して、このまたはその外国為替ペアのパワーを計算します。このデータは、使いやすい通貨インデックスと通貨パワーラインの形式で表され、特定の通貨のパワーを確認するために使用できます。 必要なのは、取引したいチャートにインジケーターを接続することだけです。インジケーターは、取引する通貨の実際の強さを示します。このインジケーターは、トレンドに合わせて取引するときに有利に利用できる売買高の圧力の極値も示します。このインジケーターには、フィボナッチに基づく可能なターゲットも表示されます。 このインジケーターは、PUSH 通知を含むあらゆるタイプのアラートを提供します。 購入後ご連絡下さい。私の取引のヒントをあなたと共有し、素晴らしいボーナスインジケーターを無料で提供します! 幸せで有益な取引をお祈りします。
Astral Structure セットアップを評価し、初期プランを確認。 発売記念価格 - $99. 発売記念期間終了後は $149。 市場構造に基づくセットアップでは、上位の見方が一致しているか、ストップの参照値はどこか、目標はどう定義されるかという複数の疑問が生じます。Astral Structure は、市場構造を判断の軸とする裁量トレーダーのために、これらを一つの画面にまとめます。 対象のセットアップに集中。 最新の適格なセットアップ、その方向、条件の充足状況をまとめて確認できます。 時間足間の一致を確認。 評価中のセットアップを見失わずに、選択した時間足の値を比較できます。 初期プランとのつながりを維持。 各要素を別々に組み合わせることなく、そのセットアップに紐づくストップと目標の参照値を確認できます。 Structure は、最新の条件を満たしたセットアップを一貫した手順で評価するために活用できます。背景と初期の価格プランを同時に確認できます。 セットアップを背景とともに読む 最新の BUY または SELL セットアップ、その Structure Level、選択した
マルチ通貨強度・モメンタム・インジケーター MT5 Dynamic Forex28 Navigator は、長年ご愛用いただいている人気インジケーターの進化形であり、5つの力を1つにまとめたものです。 Advanced Currency Strength28 Indicator (700件のレビュー) Advanced Currency IMPULSE with ALERT (530件のレビュー) Currency Strength EXOTICS GOLD Impulse with Alert CS28 Combo Signals (最近のボーナス) 4つのインジケーターを購入してチャートに重ねる必要はありません。すべてが1つの強力なインジケーターに統合されています。28通貨ペアの強度、それらを導く市場のモメンタム、そして両方のアラートを、1つのウィンドウ、1つのチャートで。 上記のプログラムは MQL5 Market で1,200件以上のレビューを獲得し、2016年から MT4 コミュニティで定番となっています。Dynamic Forex28 Navigator MT5 は、実証済
「Scalper Vault」は、デイトレードで安定した成果を目指すトレーダーのために設計された、強力かつ充実した機能を備えたトレーディングシステムです。 この高精度なインジケーターは、それ単体で完結するトレーディングシステムとして機能し、FXやバイナリーオプションのトレーダーに、機関投資家レベルの分析を提供します。 ご購入後、ぜひご連絡ください。 トレードのヒントに加え、豪華なボーナスをプレゼントいたします! 「Scalper Vault」を活用すれば、勘に頼った判断や複雑な手動分析は不要です。使いやすいトレード手法に集中し、純粋に「エントリー・決済」という実行フェーズに専念できます。 高精度なトレンドフォロー・シグナル:中核となるアルゴリズムが市場構造を分析し、主要なトレンド方向に沿った高確率なシグナルを提示します。これにより、誤ったエントリーを大幅に削減できます。 精度の高い天井・底の検知:市場の勢いが尽きたポイントをスキャンし、反転の可能性が高いゾーンを特定します。 ギャン(Gann)理論に基づく売買ゾーン:数学的な「ギャン・レベル」を自動的にチャート上に描画します。機関投資
The same chart, read in the same order, every day. Structure, the nearest zone, where you sit in the range and which way the trend points — on screen at once, always in the same form. BUYER BONUS — SMC Nexus Scanner Pro. A multi-symbol scanner built on this indicator's data: one panel shows the trend side, active order blocks and BOS / CHoCH for many symbols at once. It comes at no extra cost — after your purchase, message me on MQL5 and I will send it. Fifteen layers under one panel: market st
Azimuth Pro
Ottaviano De Cicco
5 (7)
Azimuth Pro V2:MT5向けシンセティック・フラクタル構造分析と確認済みエントリー 概要 Azimuth Pro は Merkava Labs によるマルチレベルスイング構造インジケーターです。4つのネストされたスイングレイヤー、スイングアンカーVWAP、ABCパターン検出、3タイムフレーム構造フィルタリング、そして確定バーでの確認済みエントリー — 1つのチャートで、ミクロスイングからマクロサイクルまでを網羅するワークフロー。 これはブラインドシグナル製品ではありません。ロケーション、コンテキスト、タイミングを重視するトレーダーのための構造ファーストワークフローです。 ハロウィンプロモーション — 35%オフ 相場が不気味に揺れても、あなたの優位性は鋭いまま。このオファーが霧の中に消える前に、35%オフで手に入れよう。 Azimuth Proが現在259 USD(通常399 USD)。 1. V2での変更点 シンセティック・マルチタイムフレームエンジン 上位タイムフレーム分析をMeridian Proと同じ独自のシンセティックアーキテクチャで一から再構築。より
ARICoin is a powerful trading companion designed to generate high-probability entry signals with dynamic TP/SL/DP levels based on volatility. Built-in performance tracking shows win/loss stats, PP1/PP2 hits, and success rates all updated live. Key Features: Buy/Sell signals with adaptive volatility bands Real-time TP/SL/DP levels based on ATR Built-in MA Filter with optional ATR/StdDev volatility Performance stats panel (Success, Profit/Loss, PP1/PP2) Alerts via popup, sound, push, or email Cust
Adaptive Price Action Engine インジケーターを購入すると、EAが無料に マルチタイムフレーム対応・自己最適化トレンド&ローソク足パターン分析 市場環境は常に変化しており、すべてのPrice Actionパターンが、あらゆる市場環境で同じ価値を持つわけではありません。 Adaptive Price Action Engine は、変化する市場環境への適応を目的として、 トレンド構造、マルチタイムフレーム分析、ローソク足パターン、統計的最適化 を1つの分析フレームワークに統合しています。 2つのアダプティブモード Dual Alpha Trend Mode 低い時間足と高い時間足のAlpha Trendパラメータを自動的に探索し、直近の市場動向に合わせてトレンド判定を適応させます。 Candlestick + Alpha Mode Alpha Trendによる市場レジーム判定と、 22種類の強気・弱気ローソク足パターン を組み合わせます。すべてのパターンを同じように扱うのではなく、さまざまなパターンの組み合わせを統計的に評価し、選択された市場環境において過去
FX Trend NG:次世代マルチマーケット・トレンドインテリジェンス 概要 FX Trend NG は、複数の時間足に対応したプロフェッショナル向けトレンド分析およびマーケット監視ツールです。 市場全体の構造を数秒で把握することができます。 複数のチャートを切り替える必要はありません。どの銘柄がトレンド中なのか、どこでモメンタムが弱まっているのか、そしてどの時間足で強い整合性があるのかを瞬時に確認できます。 ローンチ特別オファー – FX Trend NG を $30(6ヶ月) または $80 永久ライセンス でご利用いただけます。 すでに Stein Investments のユーザーですか? -> メッセージを送信 して、プライベートグループへアクセスしてください。 セットアップや詳細情報が必要ですか? -> Stein Investments 公式ページ をご覧ください。 1. FX Trend NG が他と異なる理由 3ステート・トレンドロジック ― Buy と Sell だけではない • 多くのインジケーターは Buy または Sell の2状態のみを表示します。
スイングトレーディング は、トレンドの方向のスイングと可能な反転スイングを検出するように設計された最初のインジケーターです。トレーディングの文献で広く説明されているベースラインスイングトレーディングアプローチを使用します。インディケータは、いくつかの価格と時間のベクトルを調査して、全体的なトレンドの方向を追跡し、市場が売られ過ぎまたは買われ過ぎて修正の準備ができている状況を検出します。 [ インストールガイド | 更新ガイド | トラブルシューティング | よくある質問 | すべての製品 ] むち打ちを起こさずに市場スイングの利益 インジケーターは常にトレンドの方向を表示します 色付きの価格帯は機会のベースラインを表します 色付きのダッシュは、可能な反転スイングを表します この指標は、独自の品質とパフォーマンスを分析します 複数時間枠のダッシュボードを実装します カスタマイズ可能なトレンドおよびスイング期間 電子メール/サウンド/プッシュアラートを実装します インジケータは再描画またはバックペインティングではありません Swing Tradingとは Swing Tradingは
FX Volume MT5
Daniel Stein
4.79 (24)
FX Volume:ブローカー視点で捉える本物の市場センチメント クイック概要 トレード手法をさらに高めたいとお考えですか? FX Volume は、リテールトレーダーやブローカーのポジション状況をリアルタイムで提供します。これは、COTのような遅延レポートよりもはるかに早く知ることができます。安定した利益を目指す方も、さらなる優位性を求める方も、 FX Volume は大きな不均衡を見極め、ブレイクアウトを確認し、リスク管理を洗練させるのに役立ちます。今すぐ始めて、実際の出来高データがどのように意思決定を変革するかを体感してください! 1. FX Volume がトレーダーにとって非常に有益な理由 高精度の早期警戒シグナル • 各通貨ペアを売買しているトレーダー数を、他者よりも早く、ほぼリアルタイムで把握できます。 • FX Volume は、複数のリテールブローカーから得られる本物の出来高データを収集し、分かりやすい形式で提供する 唯一 のツールです。 強力なリスク管理 • ロングやショートの大きな偏り(インバランス)を特定し、潜在的なトレンド転換を見逃しません。ストップ
Crystal Heikin Ashi Signals—Professional Trend & Signal Detection Indicator Advanced Heikin Ashi Visualization with Intelligent Signal System for Manual & Automated Trading Final Price: $149 ---------> Price goes up $10 after every 10 sales . Limited slots available — act fast . Overview User Guide PDF Crystal Heikin Ashi Signals is a professional-grade MetaTrader 5 indicator that combines pure Heikin Ashi candle visualization with an advanced momentum-shift detection system. Designed for both m
Advance AI Scanner is a multi-symbol analysis indicator for MetaTrader 5. It scans Forex pairs, metals, energy, stock indices and cryptocurrencies at the same time and rates each instrument with its own self-training model. It explains in plain English what moved each market and why, and it estimates how far upcoming economic news usually moves each symbol, measured on your broker's own price history. $199 instead of $499. 10 copies left at this price. One time purchase  Installation and User
作者のその他のプロダクト
Pmax
Celal Engin Baka
PMax is a brand new indicator developed by KivancOzbilgic in earlier 2020. It's a combination of two trailing stop loss indicators; One is Anıl Özekşi's MOST (Moving Stop Loss) Indicator and the other one is well known ATR based SuperTrend. Both MOST and SuperTrend Indicators are very good at trend following systems but conversely their performance is not bright in sideways market conditions like most of the other indicators. Profit Maximizer - PMax tries to solve this problem.   PMax combi
# Megathron Buttons EA User Guide ## 1. Overview Megathron Buttons EA is a helper tool designed for manual traders. It provides quick and easy trading through various buttons on the chart. ## 2. Installation 1. Install the EA on your MetaTrader 5 platform 2. Drag and drop it onto your desired chart 3. Configure the EA settings (detailed below) ## 3. Buttons and Their Functions ### Main Buttons 1. **BUY Button** (Green)    - Opens a buy position with specified lot size    - Automatically cal
# Weekly & Daily Stochastic Signal Indicator User Guide ## Overview This indicator combines the Stochastic oscillator on weekly and daily timeframes to generate strong trading signals. It aims to create more reliable signals by tracking momentum changes across different timeframes. ## Parameters - **ShortPeriod (14)**: Daily Stochastic period - **ShortPeriodSMA (3)**: Daily Stochastic SMA period - **LongPeriod (70)**: Weekly Stochastic period - **LongPeriodSMA (3)**: Weekly Stochastic SMA per
TheMegathron Gold Signal is a signal indicator developed and refined specifically for the XAUUSD market. At its core is a proprietary filtering mechanism that distinguishes genuine directional moves from noise. The system focuses on identifying moments when the market is genuinely changing direction rather than simply reacting to short-term volatility. The indicator can be used as a standalone analysis tool or alongside TheMegathron Gold EA — both products share the same underlying signal engin
️ **ATTENTION EA DEVELOPERS:** Are you planning to use this indicator in your automated trading systems? After your purchase, simply send me a direct message to receive the complete `iCustom()` integration code, buffer index list, and API documentation for your Expert Advisors. --- ## TheMegathron Scalper — XAUUSD Exclusive Edition (v3.10) **Three independent filters. Auto-Adaptive Engine. No repainting.** TheMegathron Scalper is a professional-grade entry indicator for MetaTrader 5, purpo
MetaTrader 5 Trade Manager — Virtual SL/TP, OCO Orders, Multi-Position TheMegathron Trade Manager Professional Trade Execution and Risk Management Panel for MetaTrader 5 ================================================================================ OVERVIEW -------- TheMegathron Trade Manager is a trade execution panel I built out of necessity. Most panels on the market either do too little or bury the useful features behind complicated menus. This one is designed to get out of your way —
フィルタ:
レビューなし
レビューに返信