Double Harmonic Volatility Indicator MT5
- インディケータ
-
Young Ho Seo
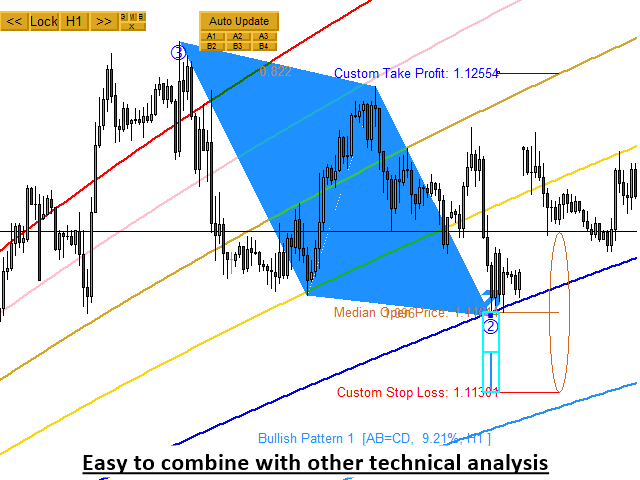
 Harmonic Pattern Indicator - Repainting + Japanese Candlestick Pattern Scanner + Automatic Channel + Many more
https://www.mql5.com/en/market/product/4488 - バージョン: 2.1
- アップデート済み: 22 2月 2022
- アクティベーション: 5
Introduction to Double Harmonic Volatility Indicator
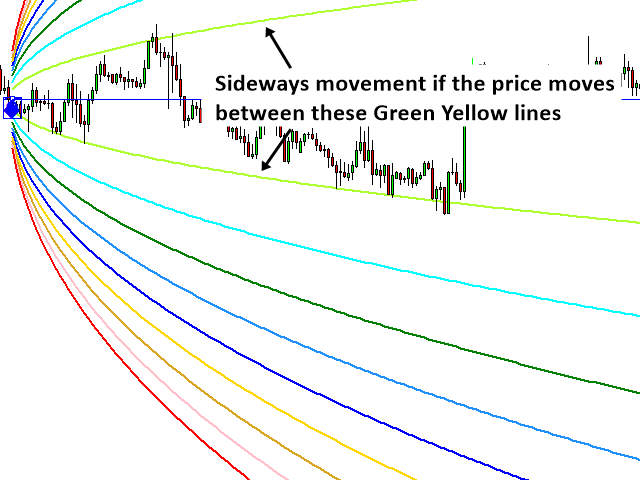
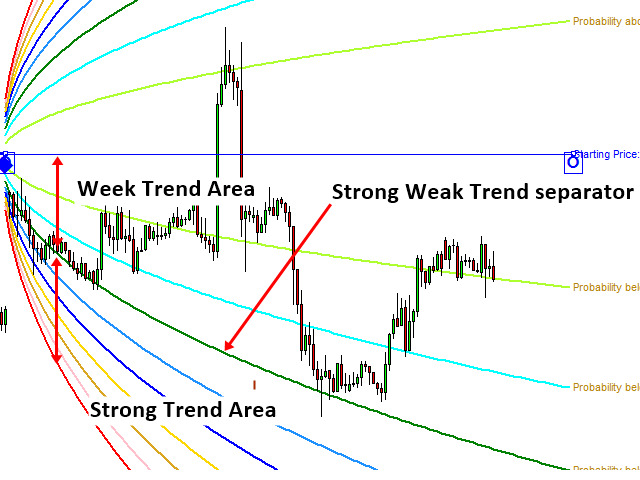
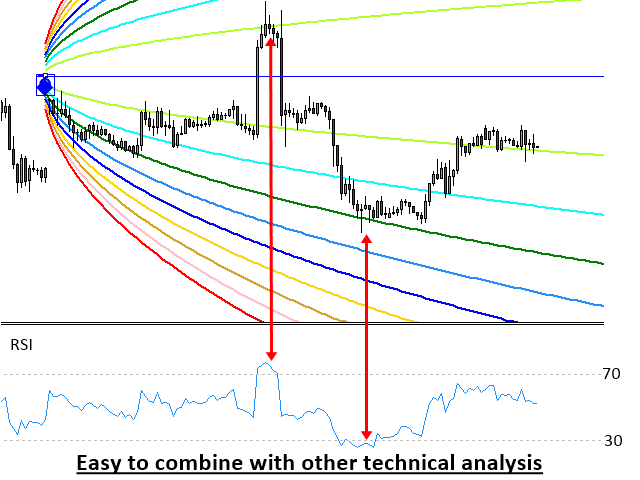
Use of the Fibonacci analysis for financial trading can nearly go back to 85 years from today since the birth of Elliott Wave Theory by R. N. Elliott. Until now, traders use the Fibonacci analysis to identify the patterns in the price series. Yet, we could not find any one attempted to use Fibonacci analysis for the Volatility. Harmonic Volatility Indicator was the first technical analysis applying the Fibonacci analysis to the financial Volatility. Originally, Harmonic Volatility Indicator was developed to overcome the limitation and the weakness of Gann’s Angle, also known as Gann’s Fan. We have demonstrated that Harmonic Volatility Indicator can be applied in a similar manner to Gann’s Angle (or Gann’s Fan) to your chart. At the same time, since the volatility is very important information for traders, Harmonic Volatility Indicator can bring many other benefits to traders too. One might use Harmonic Volatility indicator like the market profile to spot trend reversal point. More importantly, Harmonic Volatility Indicator can be well incorporated to your existing technical analysis to improve your trading. It is also very effective in spotting mature trend in its end phase. Bringing the Harmonic Volatility indicator further in its application level, Double Harmonic Volatility Indicator applies two Harmonic Volatility indicator in the significant peak and trough in your chart in the automatic manner. You can use this tool to identify the significant support resistance levels, trend reversal point and trend strength. To maximize your trading efficiency, we have added many automated features for your convenience.
How to Use
Double Harmonic Volatility indicator can be run in more than four different mode.
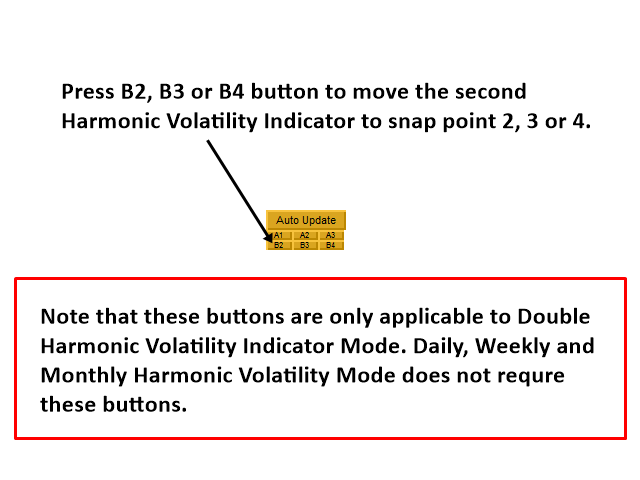
- Double Harmonic Volatility mode – this mode uses two Harmonic Volatility indicator in the significant peak and trough.
- Daily Harmonic Volatility mode – this mode apply Harmonic Volatility indicator to daily open price.
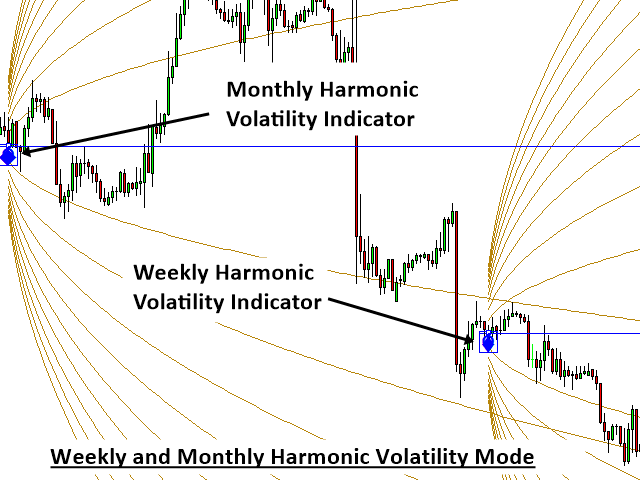
- Weekly Harmonic Volatility mode – this mode apply Harmonic Volatility indicator to weekly open price.
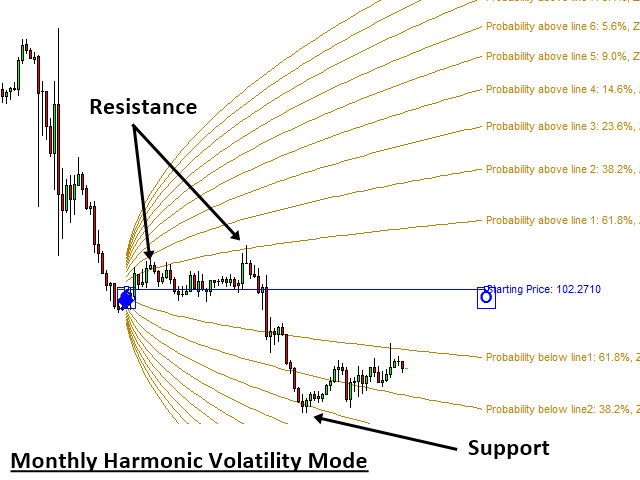
- Monthly Harmonic Volatility mode – this mode apply Harmonic Volatility indicator to monthly open price.
- Beside above four modes, you can combine daily and weekly Harmonic Volatility indicator or weekly and monthly Harmonic Volatility indicator. If you want, you can combine daily, weekly and monthly harmonic volatility indicator at the same time.
Important User Inputs
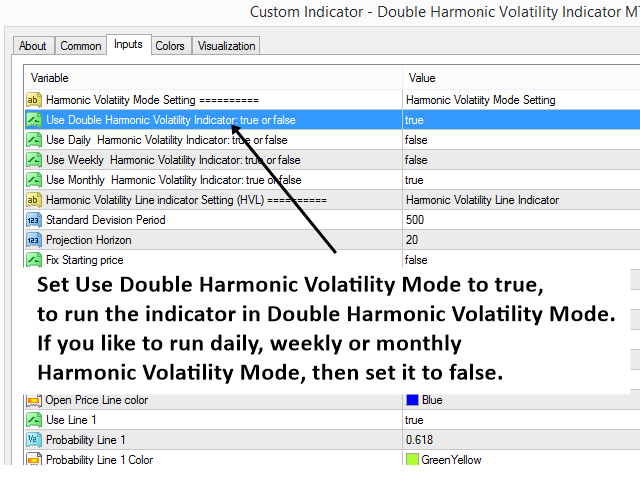
There are four important inputs to change the mode of this indicator.
- Use Double Harmonic Volatility- Set this input to true to run the indicator in double Harmonic Volatility mode. If you set this input to false, then indicator will run in to either daily, weekly or monthly Harmonic Volatility Mode.
- Use Daily Harmonic Volatility – This input is only active if the Use Double Harmonic Volatility is set to false.
- Use Weekly Harmonic Volatility - This input is only active if the Use Double Harmonic Volatility is set to false.
- Use Monthly Harmonic Volatility - This input is only active if the Use Double Harmonic Volatility is set to false.
Note that most of time you can use the default setting for the other inputs.
Trading Principle
Most of average traders are trading without having the full picture of the market volatility. Double Harmonic Volatility Indicator can offer you more systematic picture towards the current market state. In spite of the fact that Harmonic Volatility indicator can bring you the many benefits for your trading, you will still need knowledge and discipline for your successful trading. This is not the bulletproof trading system.
Trading Strategy Guide
You can find the detaild trading strategy guide about how to use volatility indicator from the link below. We recommend to read this article before using this volatiltiy indicator for your trading.
https://www.mql5.com/en/blogs/post/750389
Important Note
This is the off the shelf product. Therefore, we do not accept any modification or customization request on this product. In addition, we do not provide any code library or any support for your coding for this product.


I like it :)
Update: Jan 2022 - I find it hard to believe I'm the only person to have given this indicator a positive review.
It really is good and works well in combination with other indicators.