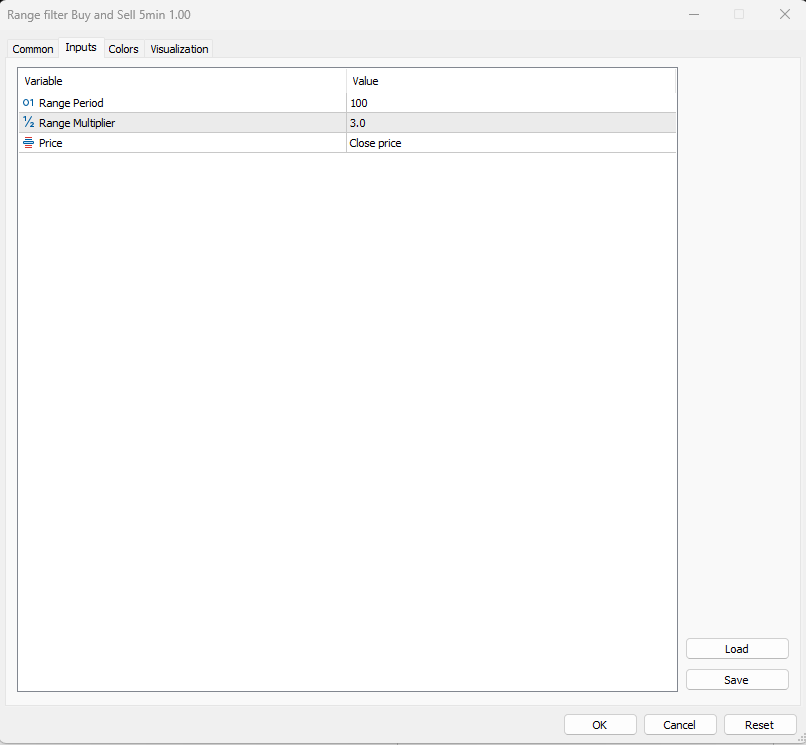
Range filter Buy and Sell 5min MT5
- インディケータ
- バージョン: 1.21
- アップデート済み: 22 5月 2024
- アクティベーション: 15

This indicator converted from 5 min Buy and Sell Range Filter - guikroth version on TradingView
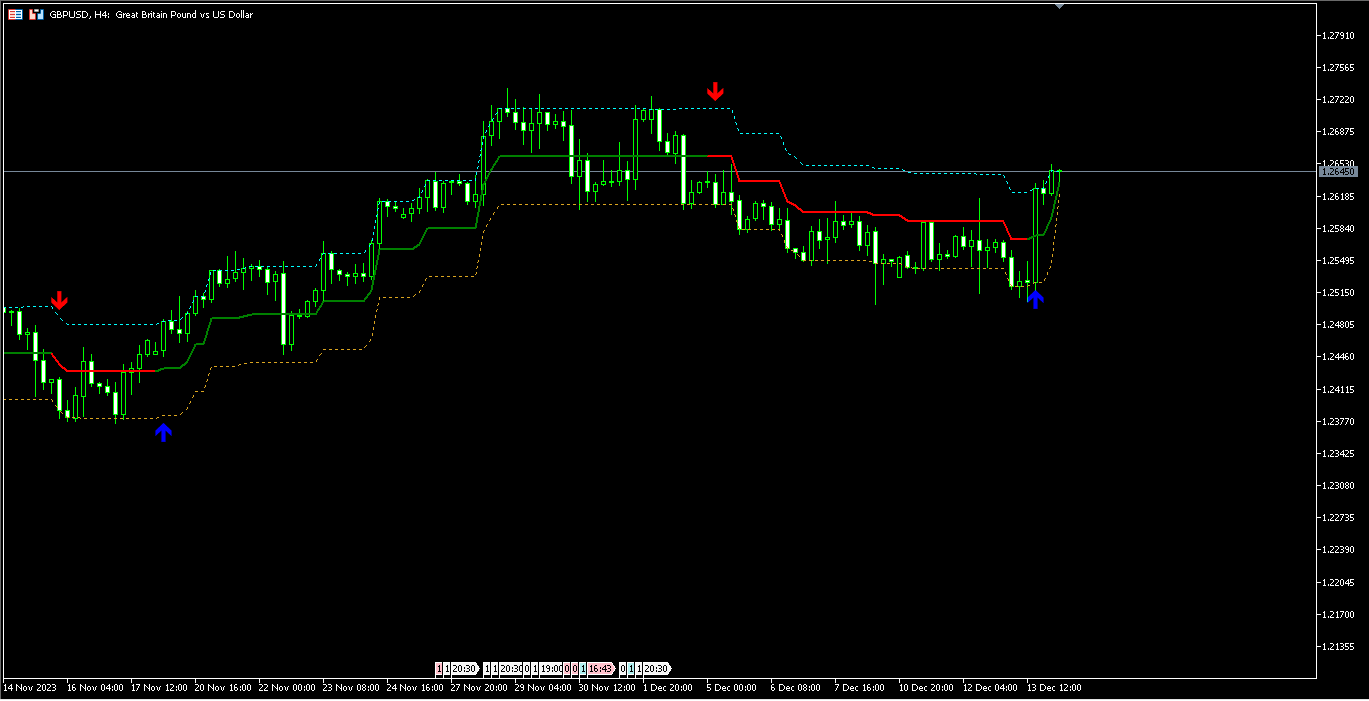
Popularity of the Range Filter
The Range Filter is a very popular and effective indicator in its own right, with adjustments to the few simple settings it is possible to use the Range Filter for helping filter price movement, whether helping to determine trend direction or ranges, to timing breakout or even reversal entries. Its practical versatility makes it ideal for integrating it's signals into a variety of trading strategies or even other indicators.


Great job, works exactly as it should be. Thanks