UT Bot with Alerts
- インディケータ
- バージョン: 1.3
- アップデート済み: 4 7月 2025

UT Bot with Alerts
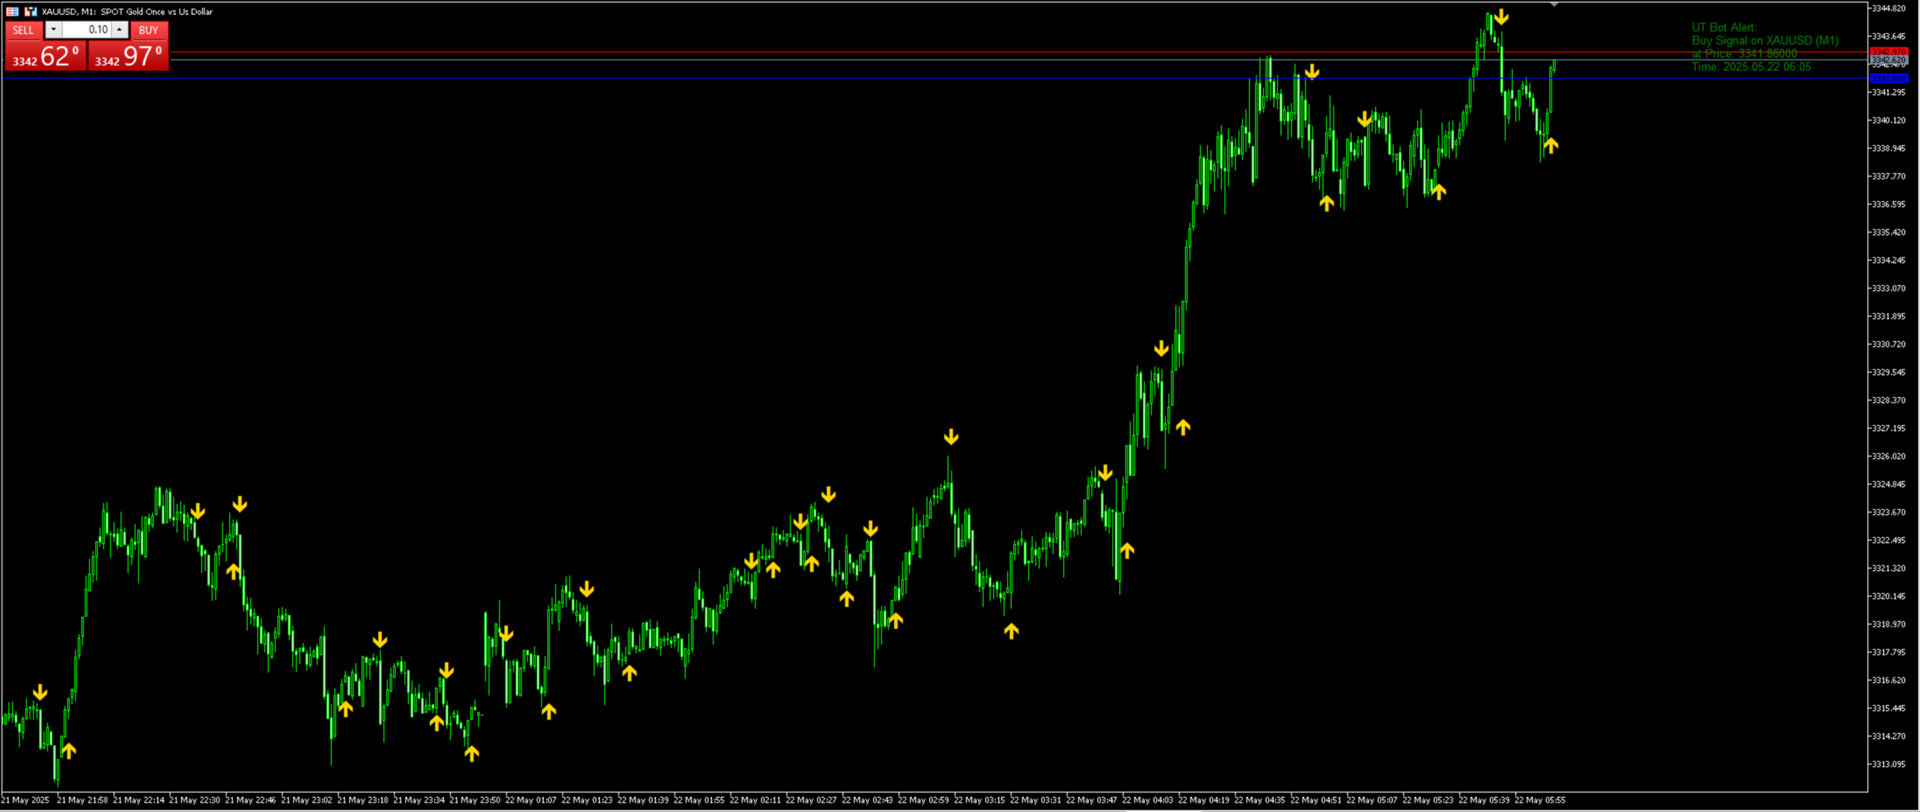
The UT Bot Alerts Indicator for MetaTrader 5 is a versatile trading tool that generates buy and sell signals based on ATR-based trailing stop logic. It displays signals with arrows, draws an entry price line, and includes a candle countdown timer. The indicator offers customizable alerts (pop-up, email, push notifications) and a text label showing signal details. Users can adjust ATR sensitivity, label positions, and timer settings, making it suitable for various markets and timeframes. Copyright 2023, by Geraked.
Support and questions via MQL5 product comments.
For questions, updates, and to connect with other traders, join my official MQL5 group ForexEAandMore
Settings:
ATR Coefficient (AtrCoef, default: 2):
Adjusts signal sensitivity using the ATR multiplier.
ATR Period (AtrLen, default: 1):
Sets the ATR calculation period.
Alerts:
Enable/disable pop-up (EnableAlert), email (EnableEmail), or push notifications (EnableNotify).
Text Label:
Toggle signal display (EnableLabel), with adjustable position (LabelX, LabelY) and font size (LabelFontSize).
Entry Line:
Customize color (EntryLineColor).
Candle Timer:
Enable/disable (EnableCandleTimer), with adjustable position (TimerXOffset) and font size (TimerFontSize).These settings offer flexibility for various trading styles and timeframes.
Disclaimer
This indicator is provided for informational purposes only and does not constitute financial advice. Past performance calculated using historical data does not guarantee future results, and trading involves risk of loss. Always test the product in a demo account, combine it with appropriate risk management, and consult a professional advisor if necessary. The developer assumes no liability for any trading decisions made based on this tool. Translations are available via MQL5 tools for global accessibility.
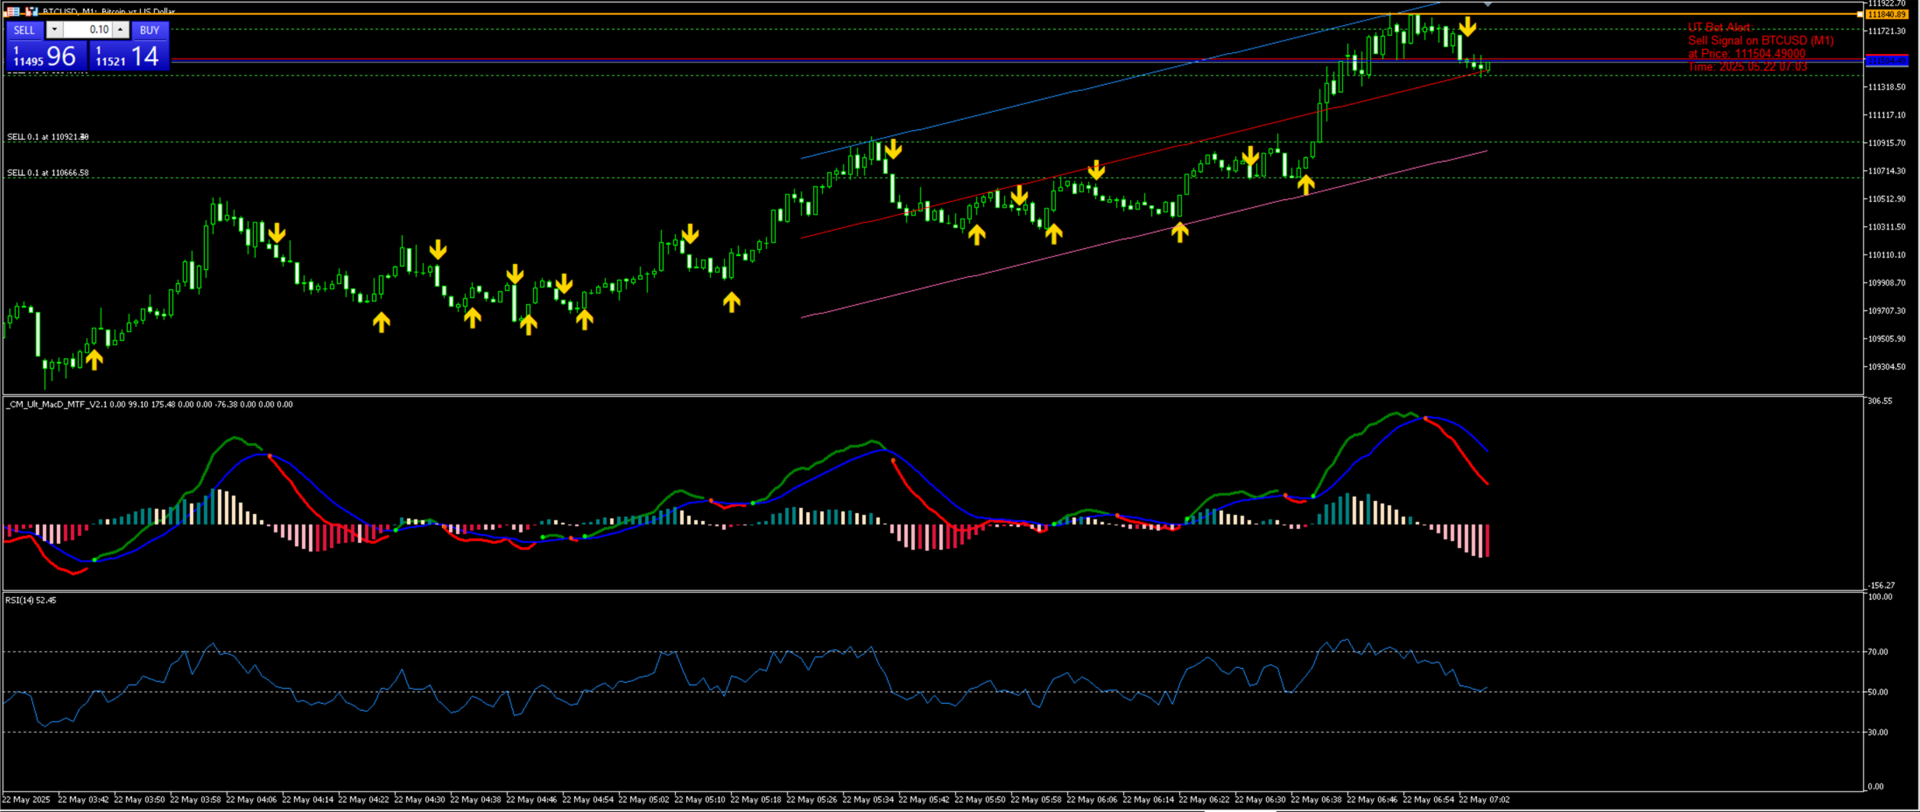
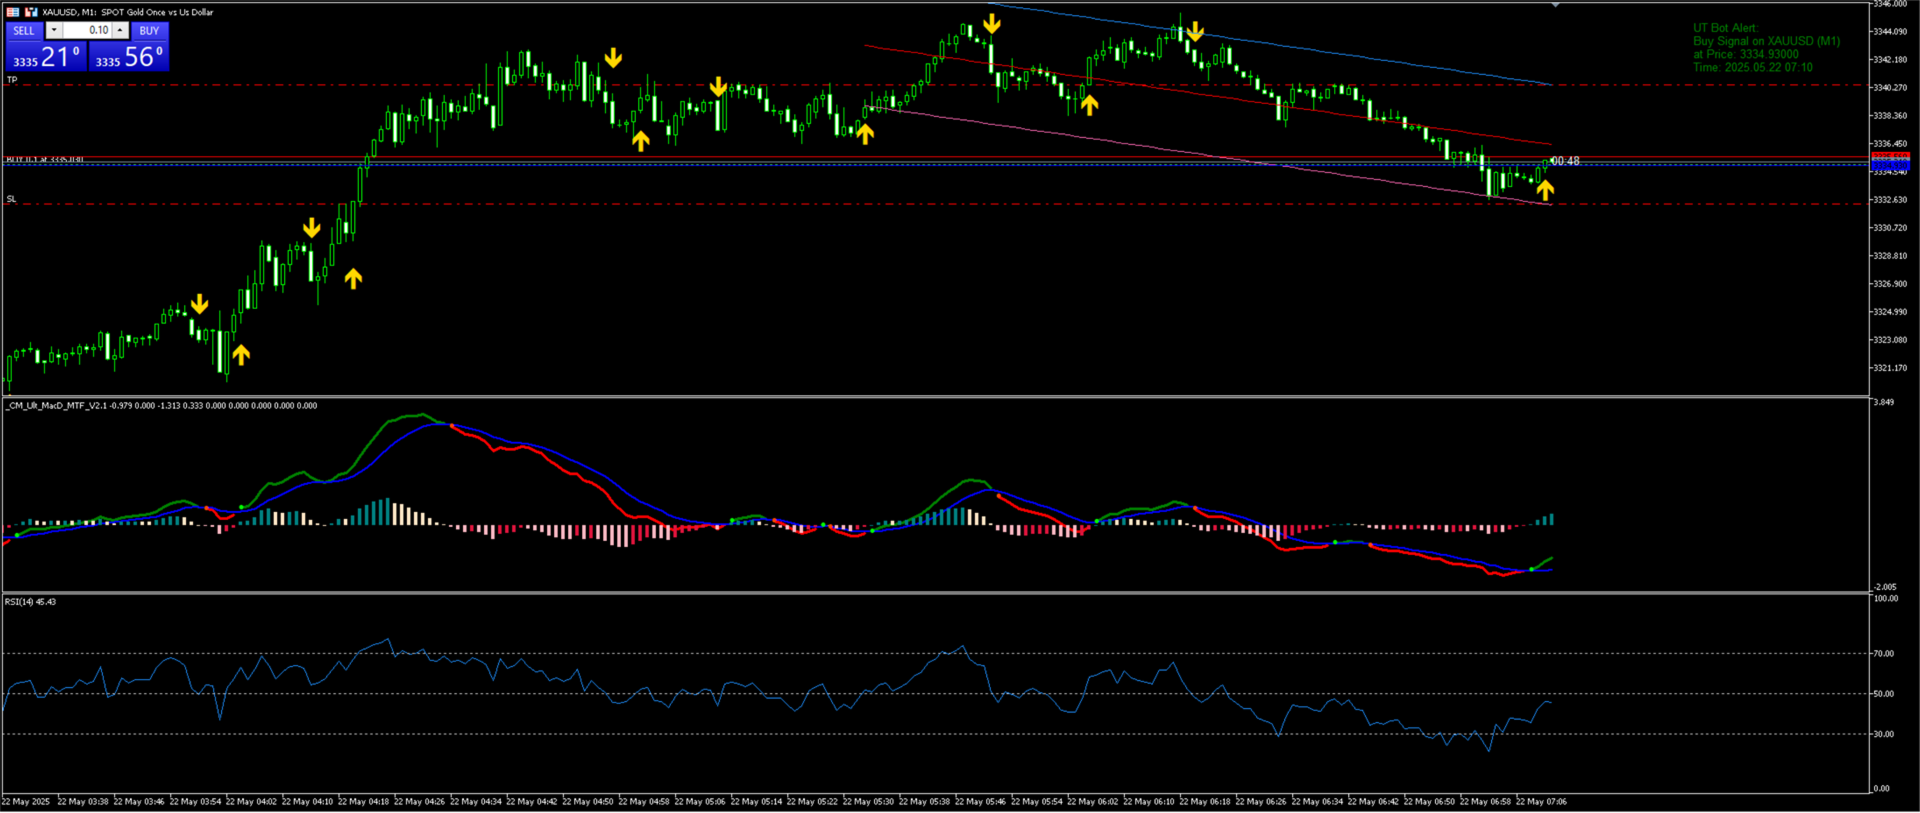

Linear Regression Candlesと合わせて使用したら、勝率が上がりました。