Ekom Spike Detector Pro
- インディケータ
- バージョン: 3.40
- アップデート済み: 3 8月 2025
- アクティベーション: 5

Take your trading to the next level with the Ekom Boom and Crash Spike Detector Indicator Pro, designed for serious traders who demand more. This advanced version provides:
Key Features:
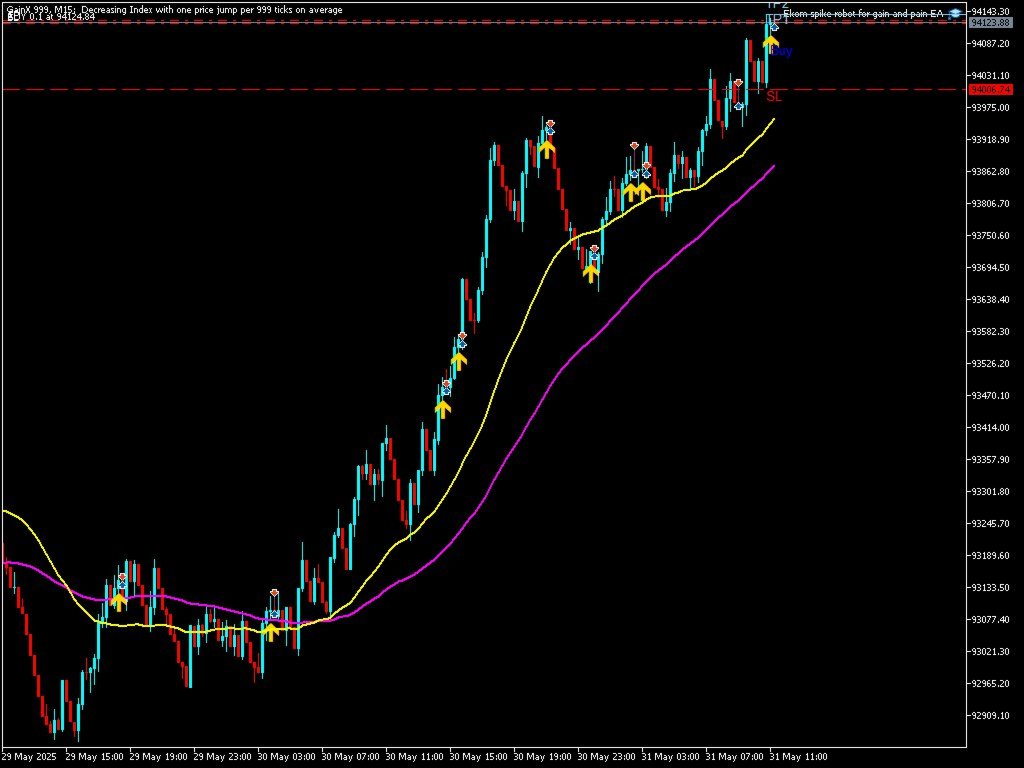
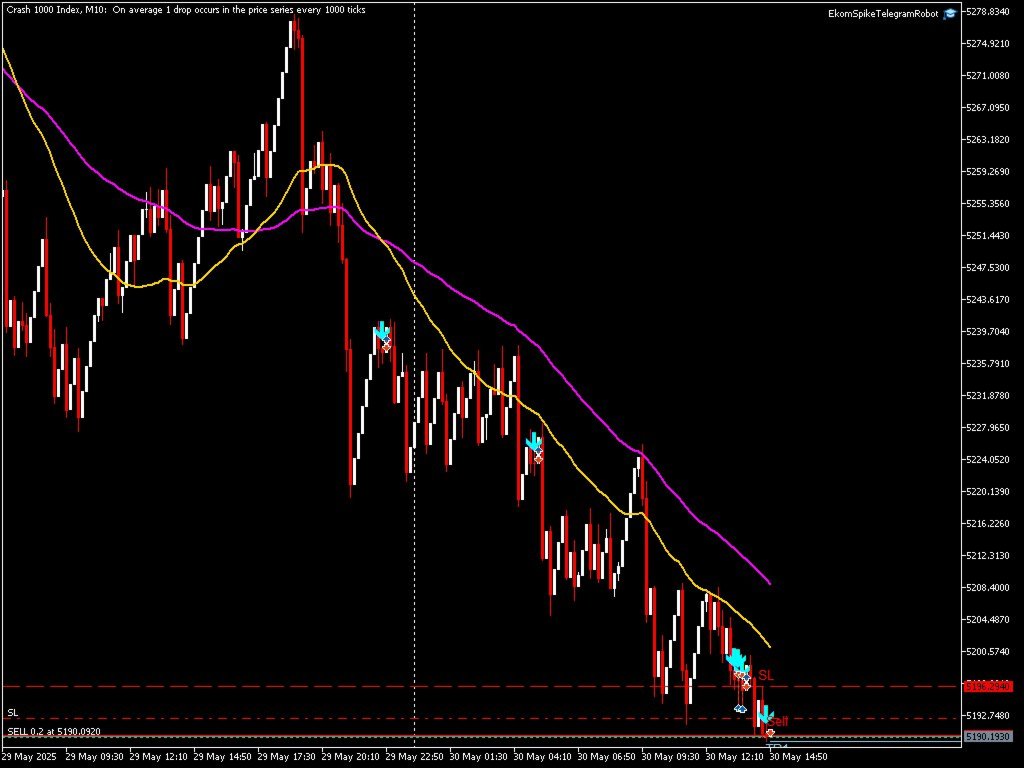
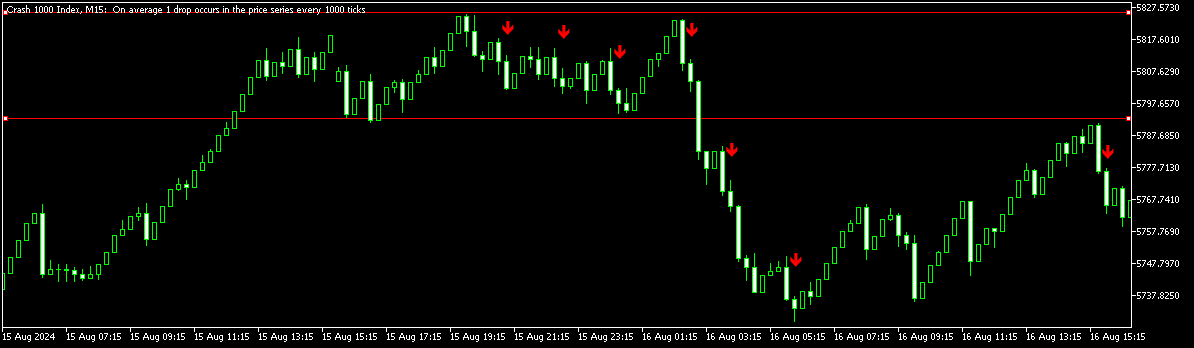
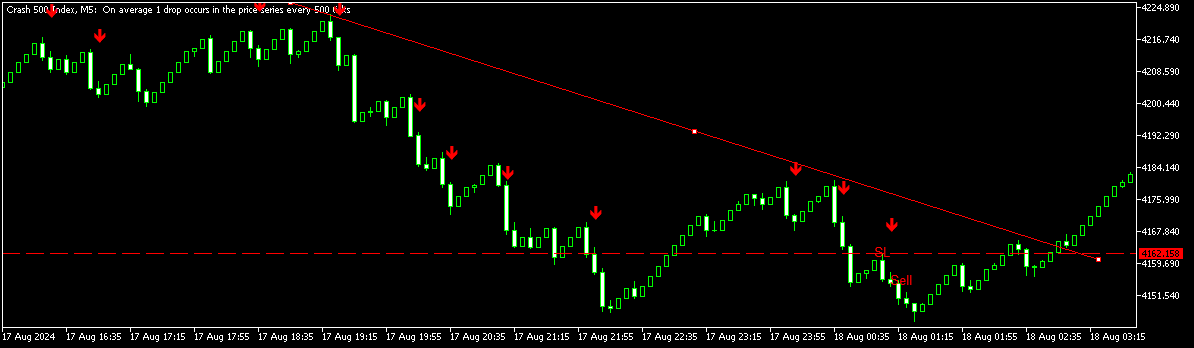
Accurate Spike Detection: Identify high-probability spike patterns in real-time using price action
Clear Visual Signals: Displays clear buy and sell arrows on the chart for easy decision-making
Alert options:
MT5 Alert/Notification to receive alerts on your mobile when signal detected
Sound Alerts when connected to PC
Mini-Telegram SMS option where u can link to your telegram channel to receive alerts
Customizable: easily change arrows and line colors and also select wether Boom or Crash
signals to.
Trend Filter option: Comes with a build in trend filter option
Reliable: Tested on historical data to ensure consistent performance
User-Friendly: Easy to install and use, even for novice traders
Version 2 and Version 3.1 all combined into one product.
Advantages
Comprehensive Coverage: Highly Precise arrow signals for all Boom and Crash pairs, including Boom 1000, Boom 500, Crash 1000, and Crash 500.
Trend Filters: Advanced trend analysis to minimize false signals
Take Profit Levels: helping you lock in profits and manage risk effectively.
Compatible: MetaTrader 5 (MT5) platform
Timeframes for Version 2: Timeframe supported (5m for Boom/Crash 300, 5m for Boom/Crash 900, 5m for Boom/Crash 500 and 15m for Boom/Crash 1000)
Timeframes for Version 3.1: from 5m-1D timeframes. This version is suitable for scalping, day trading and swing traders (5m timefram to 1D timeframe)
Indices: Boom 300, Crash 300, Boom 500, Crash 500, Boom 1000, Crash 1000, Boom 900 and Crash 900
Enjoy enhanced trading performance and maximize your potential with the Ekom Boom and Crash Spike Indicator Pro.
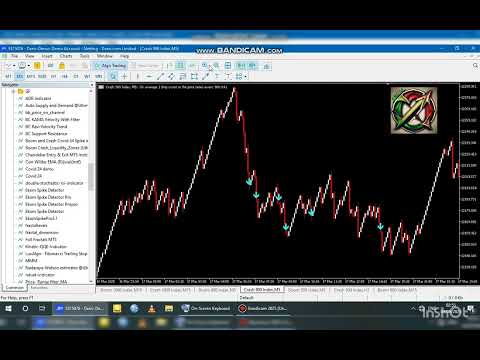
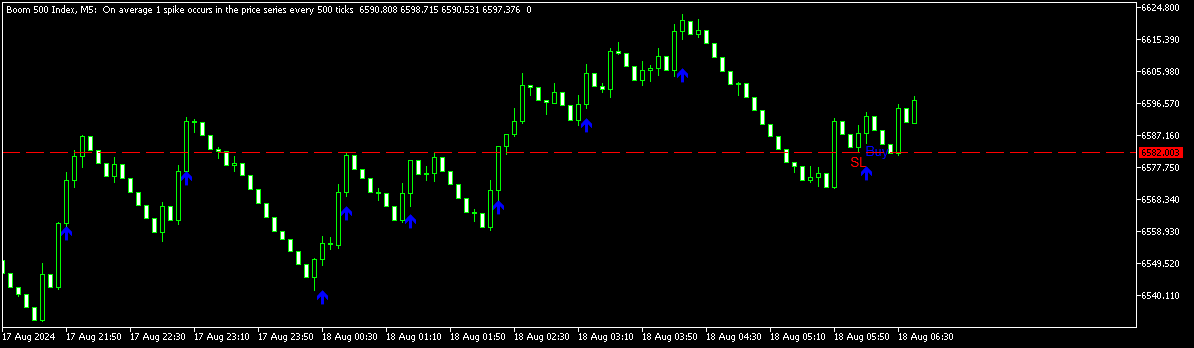
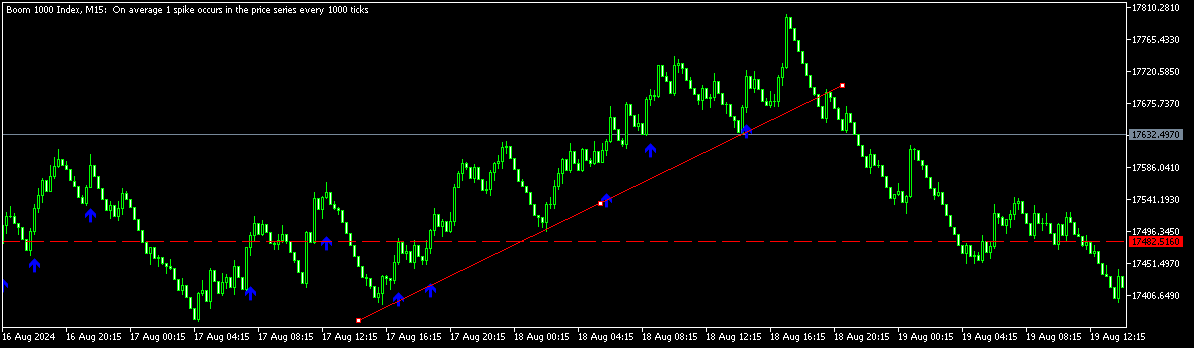
This is one of the best indicators; on M15 and M30 timeframes, the signals are usually effective.