TrendLineVisible(取得メソッド)

トレンドラインの可視性フラグを取得します。

bool  TrendLineVisible()

戻り値

トレンドラインの可視性フラグの値

TrendLineVisible(設定メソッド)

トレンドラインの可視性フラグを設定します。

void  TrendLineVisible(
  const bool  visible      // フラグ値
  )

パラメータ

visible

[in]  トレンドラインの可視性フラグの値

例:

graphics_trend

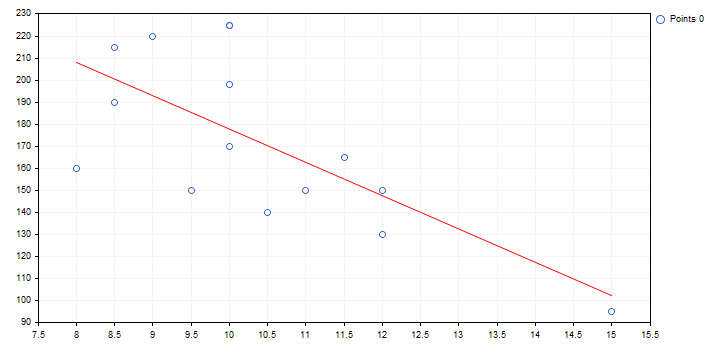
以下は、上記トレンドラインのコードとチャート上のプロットです。

//+------------------------------------------------------------------+
//|                                             TrendLineGraphic.mq5 |
//|                         Copyright 2000-2024, MetaQuotes Ltd. |
//|                                             https://www.mql5.com |
//+------------------------------------------------------------------+
#include <Graphics\Graphic.mqh>
//+------------------------------------------------------------------+
//| Script program start function                                    |
//+------------------------------------------------------------------+
void OnStart()
 {
  double x[]={12.0,11.5,11.0,12.0,10.5,10.0,9.0,8.5,10.0,8.5,10.0,8.0,9.5,10.0,15.0};
  double y[]={130.0,165.0,150.0,150.0,140.0,198.0,220.0,215.0,225.0,190.0,170.0,160.0,150.0,225.0,95.00};
//--- create graphic
  CGraphic graphic;
  if(!graphic.Create(0,"TrendLineGraphic",0,30,30,780,380))
    {
     graphic.Attach(0,"TrendLineGraphic");
    }
//--- 曲線を作成する
  CCurve *curve=graphic.CurveAdd(x,y,CURVE_POINTS);
//--- 曲線のプロパティを設定する
  curve.TrendLineVisible(true);
  curve.TrendLineColor(ColorToARGB(clrRed));
//--- プロット
  graphic.CurvePlotAll();
  graphic.Update();
 }