Goertzelアルゴリズムによるサイクル分析
はじめに
Goertzelアルゴリズムは、特定の周波数成分を効率的に検出することで知られるデジタル信号処理技術です。その精度、リアルタイム性、計算効率の高さから、金融時系列分析に適しています。この記事では、ドミナントサイクルを分析し、戦略策定に役立てるための実践的な方法を検討し、実証します。MQL5におけるアルゴリズムの実装を見て、価格相場におけるサイクルを識別するためにコードを使用する方法の例を紹介します。
Goertzelアルゴリズム
Goertzelアルゴリズムは、離散フーリエ変換(DFT)の各項を効率的に計算するために利用されます。その名前はGerald Goertzel(ジェラルド・ゲルツェル)に由来します。この手法は1958年に初めて紹介され、それ以来、工学、数学、物理学などのさまざまな分野に適用されてきました。Goertzelアルゴリズムの主な用途は、デジタル信号内の特定の周波数成分を識別することであり、少数の周波数成分のみが重要なシナリオでは非常に価値があります。高速フーリエ変換(FFT)と比べて、限られた数の周波数成分を検出する場合に必要な計算回数が少なく、計算効率が高くなっています。
これは、次の式で表されます。
ここで、
- Xは周波数kにおける累積マグニチュード
- cos()は余弦関数
- πは数学定数π(約3.14159)
- kは、関心のある周波数ビンのインデックス(サンプルの総数がNの場合、0からN - 1の範囲)
- Nは入力信号の長さ
- X[k-1]およびX[k-2]は、kにおける周波数について事前に計算されたXの値
- x[n]は入力信号のn番目のサンプル
Goertzelアルゴリズムを使って実数成分と虚数成分を計算するには、入力信号サンプルを繰り返し、以下の計算をおこなう必要があります。
- N :入力信号のサンプル数
- k :注目する周波数ビンのインデックス(0 <= k < N)
- ω : 希望する周波数ビンに対応する周波数(2 * pi * k / N)
- coeff :計算に使用される係数(2 * cos(ω))
- s_prev :状態変数の前回値
- s_prev2 :状態変数の前回の前回の値
- s:状態変数の現在値
-
次の式を使用して、状態変数(s)の現在値を更新する
ここで、x[n]は現在の入力サンプルです。
状態変数の以前の値を更新します。
すべてのサンプルを反復した後、状態変数の最終値(S、Sprev、Sprev2)は、目的の周波数ビン(k)におけるDFTの実数成分と虚数成分を表します。
実数成分は次の式で与えられます。
虚数成分は次の式で与えられます。
DFTで検出できる周波数は1/Nから(N/2)/Nの範囲であり、Nは系列内のデータポイントの数(この場合は分析対象の価格バーの数)を表します。価格相場を分析する場合、1/N間隔に限定された周波数帯域しか観察できないという限界があります。これが、J. Ehlersらがこの制約を克服するためにMESA(Maximum Entropy Spectral Analysis、最大エントロピースペクトル解析)技術を提案した理由です。
Goertzelアルゴリズムは、EhlerのMESAの代替として使用することができ、D. Meyersが執筆した研究論文によれば、特定の条件下では、より良い結果(スペクトル分解能の点で)を得ることができます。これらの条件のひとつは、たまたま信号に含まれるノイズの量に関係しています。Meyersによれば、Goertzelアルゴリズムは、特に金融時系列でよくある問題であるノイズの多い信号を扱う場合に、MESA手法を上回る性能を発揮します。興味のある読者は、PDF形式で入手可能なホワイトペーパー(英語)を読むことができます。
CGoertzelクラス
CGoertzelクラスは、データセットの度数の範囲をサンプリングできるGoertzelアルゴリズムの簡単な実装です。
//+------------------------------------------------------------------+
//| CGoertze class implementing Goertzel algorithm                   |
//+------------------------------------------------------------------+
class CGoertzel
  {
private:
   uint              m_minPeriod;
   uint              m_maxPeriod;
public:
   //constructor
                     CGoertzel(void)
     {
      m_minPeriod=m_maxPeriod=0;
     }
   //destructor
                    ~CGoertzel(void)
     {
     }
   //get methods
   uint              GetMinPeriodLength(void) {   return m_minPeriod;}
   uint              GetMaxPerodLength(void) {   return m_maxPeriod;}
   //set methods
   bool              SetMinMaxPeriodLength(const uint min_wavePeriod, const uint max_wavePeriod);
   // goertzel dft transform methods
   bool              Dft(const double &in_data[],complex &out[]);
   bool              Dft(const double &in_data[], double &out_real[], double &out_imaginary[]);
   bool              Dft(const uint min_wavePeriod,const uint max_wavePeriod,const double &in_data[],complex &out[]);
   bool              Dft(const uint min_wavePeriod,const uint max_wavePeriod,const double &in_data[], double &out_real[], double &out_imaginary[]);
  };
Goertzelは一度に限られた数の周波数しかサンプリングしないので、興味のある周波数帯域を設定しなければなりません。このクラスでは、周波数帯域は周波数の最小周期と最大周期で設定されます。
これらの値を設定するには2つの方法があります。SetMinMaxPeriodLength()を使用して、最小期間と最大期間を指定できます。
//+------------------------------------------------------------------+
//| Set the Minimum and maximum periods of selected frequency band   |
//+------------------------------------------------------------------+
bool CGoertzel::SetMinMaxPeriodLength(const uint min_wavePeriod,const uint max_wavePeriod)
  {
   if(min_wavePeriod<2 || min_wavePeriod>=max_wavePeriod)
     {
      Print("Critical error min_wavePeriod cannot be less than max_wavePeriod or less than 2");
      return false;
     }

   m_minPeriod=min_wavePeriod;
   m_maxPeriod=max_wavePeriod;

   return true;
  }
また、周波数帯域は、Dftメソッドの2つのオーバーロードのいずれかを呼び出すときに設定できます。
//+-----------------------------------------------------------------------------------+
//| Calculate the frequency domain representation of input array as complex array     |
//+-----------------------------------------------------------------------------------+
bool CGoertzel::Dft(const uint min_wavePeriod,const uint max_wavePeriod,const double &in_data[],complex &out[])
  {
   if(!SetMinMaxPeriodLength(min_wavePeriod,max_wavePeriod))
      return(false);

   return Dft(in_data,out);
  }
//+------------------------------------------------------------------------------------+
//| Calculate the frequency domain representation of input array as two separate arrays|
//+------------------------------------------------------------------------------------+
bool CGoertzel::Dft(const uint min_wavePeriod,const uint max_wavePeriod,const double &in_data[], double &out_real[], double &out_imaginary[])
  {
   if(!SetMinMaxPeriodLength(min_wavePeriod,max_wavePeriod))
      return(false);

   return Dft(in_data,out_real,out_imaginary);

  }
使用するDftメソッドのバージョンによって、dftの実数成分と虚数成分は別々の配列で出力されるか、複素数型の1つの配列で出力されます。
//+-----------------------------------------------------------------------------------+
//| Calculate the frequency domain representation of input array as complex array     |
//+-----------------------------------------------------------------------------------+
bool CGoertzel::Dft(const double &in_data[],complex &out[])
  {
   uint minsize=(3*m_maxPeriod);
   uint fullsize=in_data.Size();

   if(fullsize<minsize)
     {
      Print("Sample size too small in relation to the largest period cycle parameter");
      return false;
     }

   if(m_minPeriod>=m_maxPeriod || m_minPeriod<2)
     {
      Print("Critical error: Invalid input parameters :- max_period should be larger than min_period and min_period cannot be less than 2");
      return false;
     }

   if(out.Size()!=m_maxPeriod)
      ArrayResize(out,m_maxPeriod);

   double v0,v1,v2,freq,coeff,real,imag;


   for(uint i=0; i<m_maxPeriod; i++)
     {
      if(i<m_minPeriod)
        {
         out[i].imag=out[i].real=0.0;
         continue;
        }

      v0=v1=v2=0.0;
      freq=MathPow(i,-1);
      coeff=2.0*MathCos(2.0*M_PI*freq);
      for(uint k=minsize-1; k>0; k--)
        {
         v0=coeff*v1-v2+in_data[k];
         v2=v1;
         v1=v0;
        }

      real=v1-v2*0.5*coeff;

      imag=v2*MathSin(2*M_PI*freq);

      out[i].real=real;
      out[i].imag=imag;

     }

   return true;
  }
//+------------------------------------------------------------------------------------+
//| Calculate the frequency domain representation of input array as two separate arrays|
//+------------------------------------------------------------------------------------+
bool CGoertzel::Dft(const double &in_data[],double &out_real[],double &out_imaginary[])
  {
   uint minsize=(3*m_maxPeriod);
   uint fullsize=in_data.Size();

   if(fullsize<minsize)
     {
      Print("Sample size too small in relation to the largest period cycle parameter");
      return false;
     }

   if(m_minPeriod>=m_maxPeriod || m_minPeriod<2)
     {
      Print("Critical error: Invalid input parameters :- max_period should be larger than min_period and min_period cannot be less than 2");
      return false;
     }

   if(out_real.Size()!=m_maxPeriod)
      ArrayResize(out_real,m_maxPeriod);

   if(out_imaginary.Size()!=m_maxPeriod)
      ArrayResize(out_imaginary,m_maxPeriod);

   double v0,v1,v2,freq,coeff,real,imag;


   for(uint i=0; i<m_maxPeriod; i++)
     {
      if(i<m_minPeriod)
        {
         out_real[i]=out_imaginary[i]=0.0;
         continue;
        }

      v0=v1=v2=0.0;
      freq=MathPow(i,-1);
      coeff=2.0*MathCos(2.0*M_PI*freq);
      for(uint k=minsize-1; k>0; k--)
        {
         v0=coeff*v1-v2+in_data[k];
         v2=v1;
         v1=v0;
        }

      real=v1-v2*0.5*coeff;

      imag=v2*MathSin(2*M_PI*freq);

      out_real[i]=real;
      out_imaginary[i]=imag;

     }

   return true;
  }
前処理
データを単純にGoertzelアルゴリズムに接続し、周波数領域に変換できるとは限りません。データサンプルの性質によっては、いくつかの前処理が必要な場合があります。Goertzelアルゴリズムはdftのサブセットであるため、高速フーリエ変換をおこなう前に必要な変換がここでも適用されます。これは特に、定期的でないデータに当てはまります。このような系列は、適切な窓関数で処理する必要があります。これは、スペクトルの漏れの可能性を最小限に抑えるために、系列の両端を適切にテーパーします。文献にあるGoertzeの使用例のほとんどは、終点平坦化アルゴリズムを採用しています。このテクニックの実装は次の式で与えられます。
ここで、aは分析される系列の最初の価格値、bは最後の価格値、flat(i)はGoertzelアルゴリズムに渡される系列です。
データに窓を掛ける前に、明らかなトレンドや外れ値を取り除くことは良い習慣です。生データは必要な場合にのみトレンド除去する必要があります。不当なトレンド除去はサンプルの周波数領域表現に歪みを引き起こす可能性があります。トレンド除去は広大なテーマであり、採用できるトレンド除去の種類は数多くあります。それぞれに長所と短所があります。実務者は、適用すべき最も適切な方法を徹底的に調査する努力をすべきです。この記事では、単純な最小二乗法を用いて価格相場をトレンド除去することにします。コードを以下に示します。
//+------------------------------------------------------------------+
//|               helper method for detrending data                  |
//+------------------------------------------------------------------+
void CGoertzelCycle::detrend(const double &in_data[], double &out_data[])
  {
   uint i ;
   double xmean, ymean, x, y, xy, xx ;
   xmean=ymean=x=y=xx=xy=0.0;

   xmean=0.5*double(in_data.Size()-1);

   if(out_data.Size()!=in_data.Size())
      ArrayResize(out_data,in_data.Size());


   for(i=0; i<out_data.Size(); i++)
     {
      x = double(i) - xmean ;
      y = in_data[i] - ymean ;
      xx += x * x ;
      xy += x * y ;
     }

   m_slope=xy/xx;
   m_pivot=xmean;

   for(i=0; i<out_data.Size(); i++)
      out_data[i]=in_data[i]-(double(i)-xmean)*m_slope;
  }
CGoertzelCycleクラス
GoertzelCycle.mqhインクルードファイルには、Goertzelアルゴリズムでデータセットのサイクル分析をおこなうために使用されるCGoertzelCycleクラスが含まれます。
//+------------------------------------------------------------------+
//|   CGoertzelCycle class for cycle using the Goertzel Algorithm    |
//+------------------------------------------------------------------+
class CGoertzelCycle
  {
private:
   CGoertzel*m_ga;
   double            m_pivot;
   double            m_slope;
   bool              m_detrend;
   bool              m_squaredamp;
   bool              m_flatten;
   uint              m_cycles;
   uint              m_maxper,m_minper;
   double            m_amplitude[];
   double            m_peaks[];
   double            m_cycle[];
   double            m_phase[];
   uint              m_peaks_index[];
   double            m_detrended[];
   double            m_flattened[];
   double            m_raw[];


   void              detrend(const double &in_data[], double &out_data[]);
   double            wavepoint(bool use_cycle_strength,uint max_cycles);
   bool              spectrum(const double &in_data[],int shift=-1);
   uint              cyclepeaks(bool use_cycle_strength);

public :
                     CGoertzelCycle(void);
                     CGoertzelCycle(bool detrend,bool squared_amp,bool apply_window, uint min_period,uint max_period);
                    ~CGoertzelCycle(void);


   bool              GetSpectrum(const double &in_data[],double &out_amplitude[]);
   bool              GetSpectrum(bool detrend,bool squared_amp,bool apply_window, uint min_period,uint max_period,const double &in_data[],double &out_amplitude[]);
   uint              GetDominantCycles(bool use_cycle_strength,const double &in_data[],double &out_cycles[]);
   uint              GetDominantCycles(bool use_cycle_strenght,bool detrend,bool squared_amp,bool apply_window, uint min_period,uint max_period,const double &in_data[],double &out_cycles[]);
   void              CalculateDominantCycles(uint prev,uint total,bool use_cycle_strength,const double &in_data[], double &out_signal[]);
   void              CalculateWave(uint prev,uint total,uint max_cycles, bool use_cycle_strength,const double &in_data[], double &out_signal[]);
  };
コンストラクタは2つあります。パラメータ化されたコンストラクタは、カスタム設定によるインスタンスの初期化を可能にします。
//+------------------------------------------------------------------+
//|                     Default Constructor                          |
//+------------------------------------------------------------------+
CGoertzelCycle::CGoertzelCycle(void)
  {
   m_pivot=m_slope=0.0;
   m_maxper=m_minper=m_cycles=0;
   m_detrend=m_squaredamp=m_flatten=false;
   m_ga=new CGoertzel();
  }
//+------------------------------------------------------------------+
//|                      Parametric Constructor                      |
//+------------------------------------------------------------------+
CGoertzelCycle::CGoertzelCycle(bool detrend,bool squared_amp,bool apply_window, uint min_period,uint max_period)
  {
   m_pivot=m_slope=0.0;
   m_cycles=0;
   m_maxper=max_period;
   m_minper=min_period;
   m_detrend=detrend;
   m_squaredamp=squared_amp;
   m_flatten=apply_window;
   m_ga=new CGoertzel();

   if(m_maxper)
     {
      ArrayResize(m_amplitude,m_maxper);
      ArrayResize(m_phase,m_maxper);
      ArrayResize(m_cycle,m_maxper);
      ArrayResize(m_peaks,m_maxper);
      ArrayResize(m_peaks_index,m_maxper);
     }

  }
入力パラメータを以下に示します。
- detrend:トレンド除去の必要性を示すブーリアン入力
- apply_window:窓関数を適用するかどうかを指定するもう1つのブールパラメータ
- min_period:Goertzelアルゴリズムによって解決される最短周期または最高周波数を定義(2以上が必要)
- max_period :分析中に考慮される最長の期間(この値は、最長の期間を持つ周波数を表し、min_period以下にはできない)
- squard_amp:振幅値の表示方法(falseを選択すると、振幅は平方根として計算される)
このクラスには6つのアクセス可能なメソッドがあります。
//+-------------------------------------------------------------------+
//|          public method to access the amplitude values             |
//+-------------------------------------------------------------------+
bool CGoertzelCycle::GetSpectrum(const double &in_data[],double &out_amplitude[])
  {
   if(spectrum(in_data))
     {
      ArrayCopy(out_amplitude,m_amplitude);
      return true;
     }
   return false;
  }
GetSpectrum()は2つの入力配列を必要とし、最初のin_dataは分析される生の系列です。2番目の配列は、振幅値が出力される場所です。変換に使われるパラメータは、パラメータ化されたコンストラクタを使ってインスタンスを初期化することで指定されるはずでした。
//+------------------------------------------------------------------+
//|         public method to access the amplitude values             |
//+------------------------------------------------------------------+
bool CGoertzelCycle::GetSpectrum(bool detrend,bool squared_amp,bool apply_window,uint min_period,uint max_period,const double &in_data[],double &out_amplitude[])
  {
   m_pivot=m_slope=0.0;
   m_cycles=0;
   m_maxper=max_period;
   m_minper=min_period;
   m_detrend=detrend;
   m_squaredamp=squared_amp;
   m_flatten=apply_window;

   if(m_maxper)
     {
      ArrayResize(m_amplitude,m_maxper);
      ArrayResize(m_phase,m_maxper);
      ArrayResize(m_cycle,m_maxper);
      ArrayResize(m_peaks,m_maxper);
      ArrayResize(m_peaks_index,m_maxper);
     }

   if(spectrum(in_data))
     {
      ArrayCopy(out_amplitude,m_amplitude);
      return true;
     }
   return false;

  }
もう1つのオーバーロードされたGetSpectrum()メソッドには、パラメータ化されたコンストラクタと同じ追加パラメータがあります。どちらも成功するとtrueを返し、失敗するとfalseを返します。エラーデータがある場合は、ターミナルの操作ログに書き込まれます。
//+----------------------------------------------------------------------------+
//|public method to get the dominant cycle periods arranged in descending order|
//+----------------------------------------------------------------------------+
uint CGoertzelCycle::GetDominantCycles(bool use_cycle_strength,const double &in_data[],double &out_cycles[])
  {
   if(!spectrum(in_data))
     {
      ArrayInitialize(out_cycles,0.0);
      return(0);
     }

   cyclepeaks(use_cycle_strength);

   if(out_cycles.Size()!=m_cycles)
      ArrayResize(out_cycles,m_cycles);

   for(uint i=0; i<m_cycles; i++)
      out_cycles[i]=m_cycle[m_peaks_index[i]];

   return m_cycles;

  }
//+----------------------------------------------------------------------------+
//|public method to get the dominant cycle periods arranged in descending order|
//+----------------------------------------------------------------------------+
uint CGoertzelCycle::GetDominantCycles(bool use_cycle_strength,bool detrend,bool squared_amp,bool apply_window,uint min_period,uint max_period,const double &in_data[],double &out_cycles[])
  {
   m_pivot=m_slope=0.0;
   m_cycles=0;
   m_maxper=max_period;
   m_minper=min_period;
   m_detrend=detrend;
   m_squaredamp=squared_amp;
   m_flatten=apply_window;

   if(m_maxper)
     {
      ArrayResize(m_amplitude,m_maxper);
      ArrayResize(m_phase,m_maxper);
      ArrayResize(m_cycle,m_maxper);
      ArrayResize(m_peaks,m_maxper);
      ArrayResize(m_peaks_index,m_maxper);
     }

   return(GetDominantCycles(use_cycle_strength,in_data,out_cycles));

  }
GetDominantCycle()メソッドも、GetSpectrum()と同様にオーバーロードされます。2つの配列の他に、use_cycle_strengthというブール値のパラメータを指定する必要があります。これは、ドミナントサイクルを決定するための基準を示します。 falseに設定すると、最大振幅の周波数が使用されますが、別の方法では、次の式で与えられるサイクル強度を計算することによってドミナント サイクルが決定されます。
ドミナントサイクルは、値が降順に並べられた入力配列の最後に出力されます。
//+-----------------------------------------------------------------------+
//|method used to access calculated dominant cycles , for use in indcators|
//+-----------------------------------------------------------------------+
void CGoertzelCycle::CalculateDominantCycles(uint prev,uint total,bool use_cycle_strength,const double &in_data[], double &out_signal[])
  {

   uint limit =0;
   bool indexOut=ArrayGetAsSeries(out_signal);
   bool indexIn=ArrayGetAsSeries(in_data);

   if(prev<=0)
     {
      uint firstindex=0;
      if(indexOut)
        {
         limit=total-(m_maxper*3);
         firstindex=limit+1;
        }
      else
        {
         limit=m_maxper*3;
         firstindex=limit-1;
        }
      out_signal[firstindex]=0;
     }
   else
     {
      limit=(indexOut)?total-prev:prev;
     }

   uint found_cycles=0;
   if(indexOut)
     {
      for(int ibar=(int)limit; ibar>=0; ibar--)
        {
         spectrum(in_data,(indexIn)?ibar:total-ibar-1);
         out_signal[ibar]=(cyclepeaks(use_cycle_strength))?m_cycle[m_peaks_index[0]]:0.0;
        }
     }
   else
     {
      for(int ibar=(int)limit; ibar<(int)total; ibar++)
        {
         spectrum(in_data,(indexIn)?total-ibar-1:ibar);
         out_signal[ibar]=(cyclepeaks(use_cycle_strength))?m_cycle[m_peaks_index[0]]:0.0;
        }
     }


  }
「Calculate」という接頭辞が付いたメソッドは、理想的には指標で使用されるべきです。calculateDominantCycles()は、対応するバーのドミナントサイクルを出力します。prevには、事前に計算された指標値の数を設定する必要があります。totalは、チャート上で使用可能なバーの数になります。 in_dataは価格相場を渡す場所であり、out_signalは指標バッファの1つです。
//+-----------------------------------------------------------------------+
//|method used to access newly formed wave form, for use in indcators     |
//+-----------------------------------------------------------------------+
void CGoertzelCycle::CalculateWave(uint prev,uint total,uint max_cycles,bool use_cycle_strength,const double &in_data[], double &out_signal[])
  {
   uint limit =0;
   bool indexOut=ArrayGetAsSeries(out_signal);
   bool indexIn=ArrayGetAsSeries(in_data);

   if(prev<=0)
     {
      uint firstindex=0;
      if(indexOut)
        {
         limit=total-(m_maxper*3);
         firstindex=limit+1;
        }
      else
        {
         limit=m_maxper*3;
         firstindex=limit-1;
        }
      out_signal[firstindex]=0;
     }
   else
     {
      limit=(indexOut)?total-prev:prev;
     }

   uint found_cycles=0;
   if(indexOut)
     {
      for(int ibar=(int)limit; ibar>=0; ibar--)
        {
         spectrum(in_data,(indexIn)?ibar:total-ibar-1);
         out_signal[ibar]=out_signal[ibar+1]+wavepoint(use_cycle_strength,max_cycles);
        }
     }
   else
     {
      for(int ibar=(int)limit; ibar<(int)total; ibar++)
        {
         spectrum(in_data,(indexIn)?total-ibar-1:ibar);
         out_signal[ibar]=out_signal[ibar-1]+wavepoint(use_cycle_strength,max_cycles);
        }
     }

  }
//+------------------------------------------------------------------+
CalculateWave()は、ほとんどのパラメータがCalculateDominantCycles()と共通です。これは、Goertzelアルゴリズムによって明らかになった支配的な周波数成分から計算されたフィルタ値を出力します。周波数成分の最大数はmax_cyclesパラメータで設定されます。
波形の構成
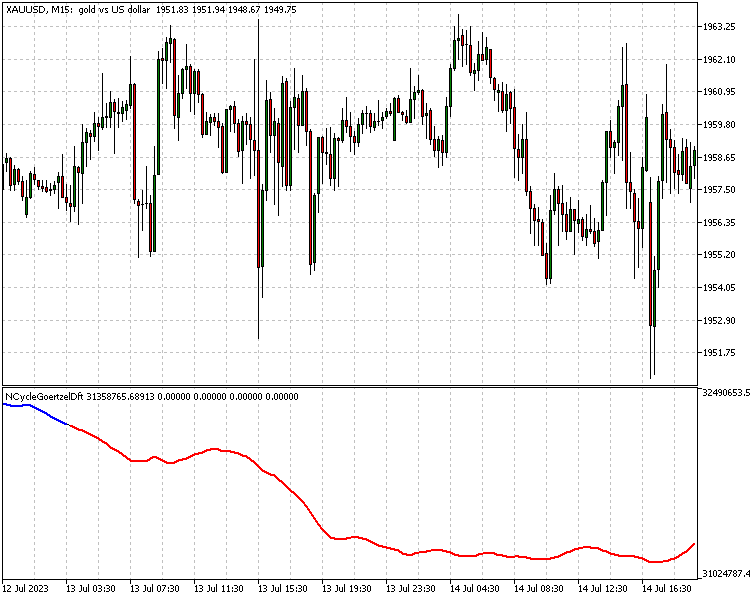
戦略開発におけるGoertzelの可能な応用と、クラスの使用の両方を実証するために、ここでは2つの指標を紹介します。1つ目は、Dennis Meyersが書いたホワイトペーパーで紹介されている戦略の実装です。彼はこの戦略を「アダプティブ10サイクルGoertzel DFTシステム」と呼んでいます。戦略の正確な詳細は、この文書に記載されています。簡単に説明すると、この戦略はGoertzelを使って価格データの移動窓から上位10個の支配的なサイクルを抽出し、これらのサイクルを使って新しい価格曲線を構築します。これは、ノイズが取り除かれた価格の挙動を表していると思われます。この戦略の主要なパラメータは、サンプリングする周波数の最小周期と最大周期、およびフィルタリングされた信号を構成するために使用される周波数成分の最大数です。
//--- input parameters
input bool     Detrend=true;
input bool     EndFlatten=true;
input bool     SquaredAmp=true;
input bool     UseCycleStrength=false;
input uint     Maxper=72;
input uint     Minper=5;
input uint     MaxCycles=10;
input double   pntup=0.5;//Percent increase threshold
input double   pntdn=0.5;//Percent decrease threshold
//--- indicator buffers
この指標は、直近のピークまたはトラフとの相対的な動きの大きさに応じて、ロングとショートのシグナルをトリガーする2つのしきい値を使用します。このコードでは、入力変数pntupとpntdnが割合を表しています。
//+------------------------------------------------------------------+
//|                                            NCycleGoertzelDft.mq5 |
//|                                  Copyright 2023, MetaQuotes Ltd. |
//|                                             https://www.mql5.com |
//+------------------------------------------------------------------+
#property copyright "Copyright 2023, MetaQuotes Ltd."
#property link      "https://www.mql5.com"
#property version   "1.00"
#include<GoertzelCycle.mqh>
#property indicator_separate_window
#property indicator_buffers 5
#property indicator_plots   5
//--- plot Wave
#property indicator_label1  "Wave"
#property indicator_type1   DRAW_LINE
#property indicator_color1  clrBlack
#property indicator_style1  STYLE_SOLID
#property indicator_width1  1
//--- plot Up
#property indicator_label2  "Peak"
#property indicator_type2   DRAW_NONE
//--- plot Dwn
#property indicator_label3  "Trough"
#property indicator_type3   DRAW_NONE
//--- plot Up
#property indicator_label4  "Long"
#property indicator_type4   DRAW_LINE
#property indicator_color4  clrBlue
#property indicator_style4  STYLE_SOLID
#property indicator_width4  2
//--- plot Dwn
#property indicator_label5  "Short"
#property indicator_type5   DRAW_LINE
#property indicator_color5  clrRed
#property indicator_style5  STYLE_SOLID
#property indicator_width5  2
//--- input parameters
input bool     Detrend=true;
input bool     EndFlatten=true;
input bool     SquaredAmp=true;
input bool     UseCycleStrength=false;
input uint     Maxper=72;
input uint     Minper=5;
input uint     MaxCycles=10;
input double   pntup=0.5;//Percent increase threshold
input double   pntdn=0.5;//Percent decrease threshold
//--- indicator buffers

double  Wave[],Peak[],Trough[],Long[],Short[];
CGoertzelCycle *Gc;
//+------------------------------------------------------------------+
//| Custom indicator initialization function                         |
//+------------------------------------------------------------------+
int OnInit()
  {
//--- indicator buffers mapping
   SetIndexBuffer(0,Wave,INDICATOR_DATA);
   SetIndexBuffer(1,Peak,INDICATOR_DATA);
   SetIndexBuffer(2,Trough,INDICATOR_DATA);
   SetIndexBuffer(3,Long,INDICATOR_DATA);
   SetIndexBuffer(4,Short,INDICATOR_DATA);
//---
   IndicatorSetInteger(INDICATOR_DIGITS,5);
//---
   PlotIndexSetDouble(0,PLOT_EMPTY_VALUE,0.0);
   PlotIndexSetDouble(1,PLOT_EMPTY_VALUE,0.0);
   PlotIndexSetDouble(2,PLOT_EMPTY_VALUE,0.0);
   PlotIndexSetDouble(3,PLOT_EMPTY_VALUE,0.0);
   PlotIndexSetDouble(4,PLOT_EMPTY_VALUE,0.0);
//---
   Gc=new CGoertzelCycle(Detrend,SquaredAmp,EndFlatten,Minper,Maxper);

   if(Gc==NULL)
    {
     Print("Invalid Goertzel object");
     return(INIT_FAILED);
    }
//---
   return(INIT_SUCCEEDED);
  }
//+------------------------------------------------------------------+
//| Indicator DeInitialization function                              |
//+------------------------------------------------------------------+
void OnDeinit (const int reason)
 {
  if(CheckPointer(Gc)==POINTER_DYNAMIC)
      delete Gc;
 }
//+------------------------------------------------------------------+
//| Custom indicator iteration function                              |
//+------------------------------------------------------------------+
int OnCalculate(const int rates_total,
                const int prev_calculated,
                const int begin,
                const double &price[])
  {
   int lim=0;

   if(prev_calculated<=0)
      lim=(int)(Maxper*3)+2;
   else
      lim=prev_calculated;


//---
    Gc.CalculateWave(prev_calculated,rates_total,MaxCycles,UseCycleStrength,price,Wave);
//---
   for(int i=lim;i<rates_total-1;i++)
      {
       Peak[i]=Trough[i]=0.0;

       if(Wave[i]>Wave[i+1] && Wave[i]>Wave[i-1])
         Peak[i]=Wave[i];
       else
         if(Wave[i]<Wave[i+1] && Wave[i]<Wave[i-1])
           Trough[i]=Wave[i];

       if(i<int(Maxper*3*2))
          {
           continue;
          }

       double lp,lt;
          lp=lt=0;

       if(i==int(Maxper*3*2))
         {
          lp=getlastPeakTrough(i,Peak);
          lt=getlastPeakTrough(i,Trough);
          if(Wave[i]>Wave[i-1] && lt)
            {
             Long[i]=Wave[i];
             Short[i]=0.0;
            }
          else
            if(Wave[i]<Wave[i-1] && lp)
              {
               Short[i]=Wave[i];
               Long[i]=0.0;
              }
         }
       else
         {

           Long[i]=(Long[i-1]!=0)?Wave[i]:Long[i-1];
           Short[i]=(Short[i-1]!=0)?Wave[i]:Short[i-1];

          if(Short[i-1]!=0 && Wave[i]>Wave[i-1])
           {
            lt=getlastPeakTrough(i,Trough);
            if(lt && (Wave[i]-lt)/lt > pntup/100 )
              {
               Long[i]=Wave[i];
               Short[i]=0.0;
              }
            else
              {
               Short[i]=Wave[i];
               Long[i]=0.0;
              }
           }
          else
           if(Long[i-1]!=0 && Wave[i]<Wave[i-1])
           {
            lp=getlastPeakTrough(i,Peak);
            if(lp && (lp-Wave[i])/lp > pntdn/100 )
              {
                Short[i]=Wave[i];
                Long[i]=0.0;
              }
             else
              {
                Long[i]=Wave[i];
                Short[i]=0.0;
              }
           }
         }

      }
//--- return value of prev_calculated for next call
   return(rates_total);
  }
//+------------------------------------------------------------------+
//| helper function that returns either last peak or trough          |
//+------------------------------------------------------------------+
double getlastPeakTrough(int shift, double &buffer[])
  {
   uint j;
   double value=0.0;
   for(j=shift-1;j>(Maxper*3)+2;j--)
     {
      if(buffer[j]==0.0)
         continue;
      else
         return(buffer[j]);
     }
   return(value);
  }
//+-----------------------------------------------------------------------------------------------++
信号の計算は次の式でおこないます。
ここで、aは振幅、phiは位相、fは周波数、Bは周波数成分を抽出するデータを表す過去の棒グラフのサンプリング数で、移動窓サイズに相当します。この値は、考慮される最大周期サイクルの3倍に等しくなります。指標のコードは上に示されています。波動ポイントは、対応するインデックスのカーブの値です。

取引ルールの詳細については、ホワイトペーパーを参照してください。
適応型指標
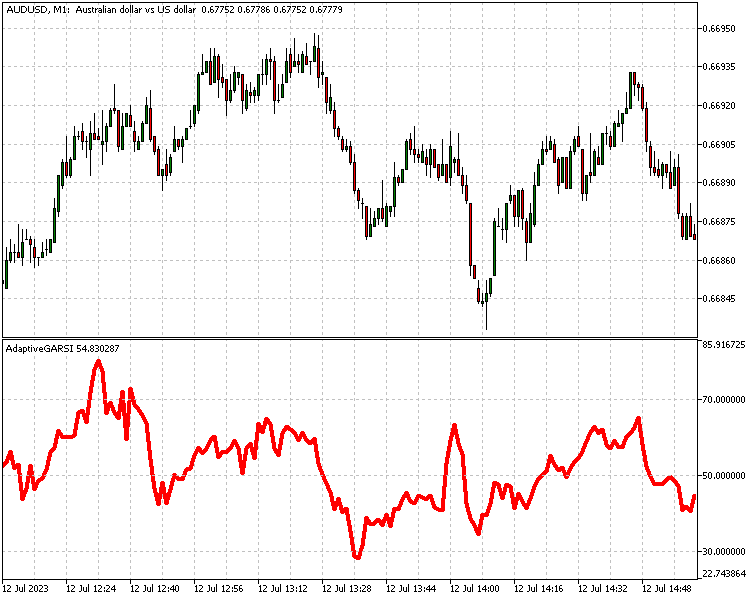
Goertzelを戦略開発に応用するもう1つの方法は、指標を適応的にするために使うことです。「 高度適応インディケータ理論および MQL5への実装」稿では、J. Ehlersの有名なテクニックを使ったこの方法を詳しく説明しています。Goertzelを使っても同じことができます。以下は、相対力指標の適応バージョンの実装です。
//+------------------------------------------------------------------+
//|                                                AdaptiveGARSI.mq5 |
//|                                  Copyright 2023, MetaQuotes Ltd. |
//|                                             https://www.mql5.com |
//+------------------------------------------------------------------+
#property copyright "Copyright 2023, MetaQuotes Ltd."
#property link      "https://www.mql5.com"
#property version   "1.00"
#property indicator_separate_window
#include<GoertzelCycle.mqh>
#property indicator_buffers 2
#property indicator_plots   1
//--- plot RSi
#property indicator_label1  "RSi"
#property indicator_type1   DRAW_LINE
#property indicator_color1  clrRed
#property indicator_style1  STYLE_SOLID
#property indicator_width1  1
//---
#property indicator_level1        70
#property indicator_level2        50
#property indicator_level3        30
//---
input bool     Detrend=true;
input bool     EndFlatten=true;
input bool     SquaredAmp=true;
input bool     UseCycleStrength=false;
input uint     Maxper=72;
input uint     Minper=5;
//--- indicator buffers
double         RSiBuffer[];
double         DomPeriodBuffer[];

CGoertzelCycle *Gc;
//+------------------------------------------------------------------+
//| Custom indicator initialization function                         |
//+------------------------------------------------------------------+
int OnInit()
  {
//--- indicator buffers mapping
   SetIndexBuffer(0,RSiBuffer,INDICATOR_DATA);
   SetIndexBuffer(1,DomPeriodBuffer,INDICATOR_CALCULATIONS);
//---
   Gc=new CGoertzelCycle(Detrend,SquaredAmp,EndFlatten,Minper,Maxper);
//---
   if(Gc==NULL)
    {
     Print("Invalid Goertzel object");
     return(INIT_FAILED);
    }
//---
   return(INIT_SUCCEEDED);
  }
//+------------------------------------------------------------------+
//| Indicator DeInitialization function                              |
//+------------------------------------------------------------------+
void OnDeinit (const int reason)
 {
  if(CheckPointer(Gc)==POINTER_DYNAMIC)
      delete Gc;
 }
//+------------------------------------------------------------------+
//| Custom indicator iteration function                              |
//+------------------------------------------------------------------+
int OnCalculate(const int rates_total,
                const int prev_calculated,
                const datetime &time[],
                const double &open[],
                const double &high[],
                const double &low[],
                const double &close[],
                const long &tick_volume[],
                const long &volume[],
                const int &spread[])
  {
//---
   uint lim=0;
//---
   Gc.CalculateDominantCycles(prev_calculated,rates_total,UseCycleStrength,close,DomPeriodBuffer);
//---
   if(prev_calculated<=0)
       lim=int(Maxper*3)+int(DomPeriodBuffer[(Maxper*3)-1]) - 1;
   else
       lim=prev_calculated;

//---
   double cu,cd;
   for(int i =int(lim);i<rates_total;i++)
    {
      cd=0.0;
      cu=0.0;
      double p=DomPeriodBuffer[i];
      int j=0;
      for(j=0;j<int(p);j++)
        {
         if(close[i-j]-close[i-j-1]>0)cu=cu+(close[i-j]-close[i-j-1]);
         if(close[i-j]-close[i-j-1]<0)cd=cd+(close[i-j-1]-close[i-j]);
        }
      if(cu+cd!=0)
         RSiBuffer[i]=100*cu/(cu+cd);
      else
         RSiBuffer[i]=0.0;

    }
//--- return value of prev_calculated for next call
   return(rates_total);
  }
//+------------------------------------------------------------------+

結論
Goertzelアルゴリズムの能力は、その応用に有用なコードユーティリティとともに明確に実証されています。課題は、このテクニックをいかに効果的に金融データに適用し、意味のあるシグナルを抽出するかです。GAは、一度に1つの周波数しか分解できないため、MESA技術に比べて明らかに不利です。その実用化によって、金融市場におけるサイクル検知の弱点も浮き彫りになりました。というのも、実勢サイクルを測定し、それがいつ終わるかを正確に判断するのは難しいからです。こうした困難に対処するには、専門分野の知識、堅牢なデータ前処理技術、リスク管理戦略、変化する市場力学への継続的な監視と適応を組み合わせる必要があります。
添付のZIPファイルには、記事で説明されているすべてのソースコードが含まれています。
| ファイル名 | 詳細 |
|---|---|
| Mql5/include/Goertzel.mqh | Goertzelアルゴリズムを実装したCGoertzelクラスのインクルードファイル |
| Mql5/include/GoertzelCycle.mqh | Goertzelアルゴリズムを使用したサイクル分析用CGoertzelCycleクラスのインクルードファイル |
| Mql5/indicators/NCycleGoertzelDft.mq5 | D. Meyersが開発したGoertzelアルゴリズムを用いた戦略を部分的に実装した指標 |
| Mql5/indicators/AdaptiveGARSI.mq5 | Goertzelアルゴリズムによるダイナミックルックバックを用いた相対力指標の適応バージョンの実装 |
MetaQuotes Ltdにより英語から翻訳されました。
元の記事: https://www.mql5.com/en/articles/975
警告: これらの資料についてのすべての権利はMetaQuotes Ltd.が保有しています。これらの資料の全部または一部の複製や再プリントは禁じられています。
この記事はサイトのユーザーによって執筆されたものであり、著者の個人的な見解を反映しています。MetaQuotes Ltdは、提示された情報の正確性や、記載されているソリューション、戦略、または推奨事項の使用によって生じたいかなる結果についても責任を負いません。
- 無料取引アプリ
- 8千を超えるシグナルをコピー
- 金融ニュースで金融マーケットを探索
Goertzelのアルゴリズムによるループの解析が 掲載されました:
著者:Francis Dube
indicators "ではなく、"indicator "です。
Goertzelのアルゴリズムによるループの解析が 掲載されました:
著者:Francis Dube
記事をありがとう!
長い間、長い間、「ブックマーク」に追加される最初の価値あるものでした。