FootprintOrderflow

5

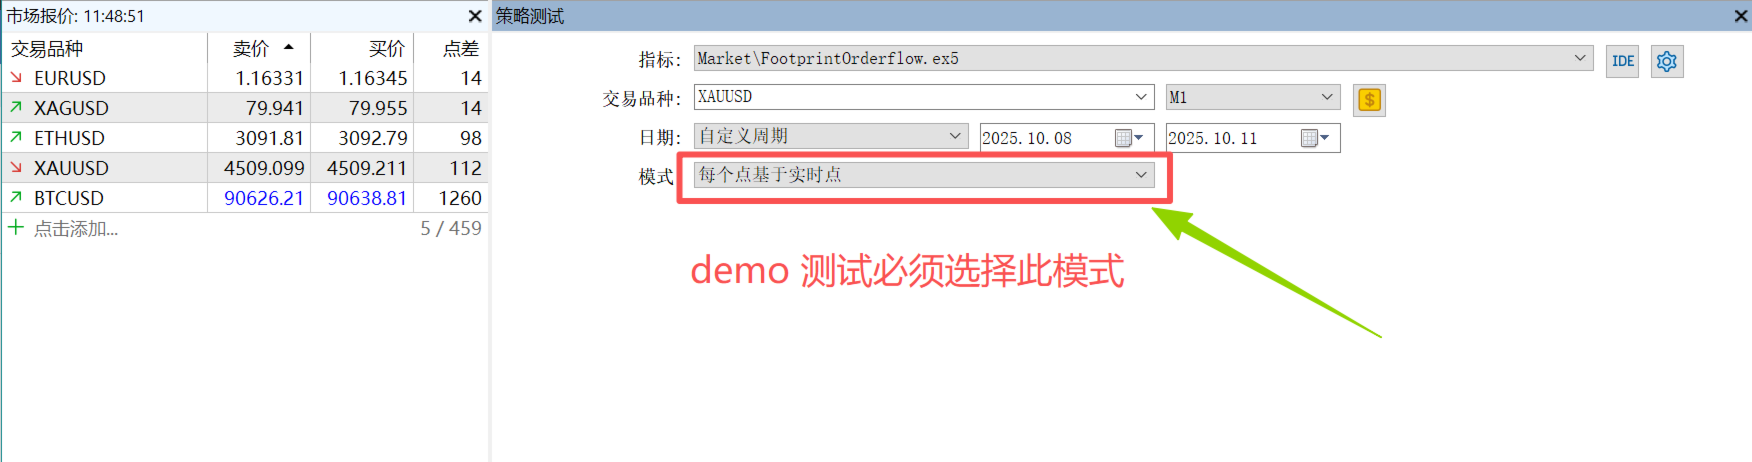
FOOTPRINTORDERFLOW: The Authoritative Guide ( This indicator is also compatible with economic providers that do not offer DOM data and BID/ASK data,It also supports various foreign exchange transactions, DEMO version,modleling must choose " Every tick based on real ticks" )

Important notice: Before placing an order, please contact me first, and I will provide you with professional answers and services


1. Overview

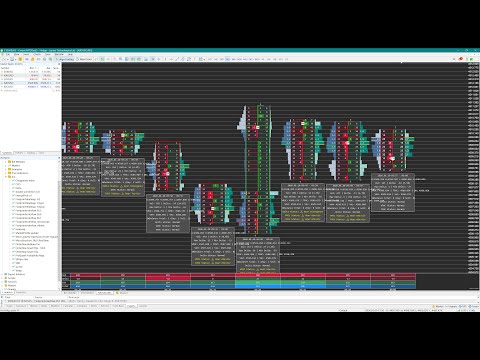
FOOTPRINTORDERFLOW is an advanced Order Flow analysis tool designed for MetaTrader 5 (MT5). Unlike traditional candlestick charts that only show OHLC (Open, High, Low, Close), this indicator parses real-time Tick data to visualize the microstructure inside every candle.

It helps you answer:

  • Who is in control? (Aggressive Buyers vs. Sellers)

  • Where is the volume? (Institutional accumulation/distribution zones)

  • Is the price accepted? (Based on Duration and Value Areas)

  • Is the trend exhausted? (Identified via Divergence signals)

  • Should critical deviations be reminded? (Send MT5 pop-up warnings via deviation signals and push notifications to mobile devices)

2. Interface & Core Features

2.1 Standard Footprint View

In standard mode, the candle is split into price levels (Bins):

  • Left Number (Bid/Sell): Represents Aggressive Selling volume (Market Sells hitting the Bid).

  • Right Number (Ask/Buy): Represents Aggressive Buying volume (Market Buys lifting the Ask).

  • Heatmap Background: Darker/Brighter colors indicate higher total volume at that specific price, visualizing liquidity clusters.

  • Imbalance Highlights:

    • Definition: When the volume difference between diagonal bids and offers exceeds a set threshold (default 3:1).

    • Visual: The background turns Cyan (Buy Imbalance) or Yellow (Sell Imbalance).

    • Meaning: Indicates overwhelming aggressive pressure from one side.

2.2 Microscope Mode - The Core Feature

When enabled, the candle width expands (default 4.5x) to reveal granular data:

  1. Left Sidebar: Displays Total Volume or Total Delta (Configurable). Useful for spotting P-shape or b-shape profiles.

  2. Right Sidebar: Displays Duration (Time) spent at that price.

    • Time = Acceptance. The longer price stays at a level, the higher the market acceptance.

  3. Core Delta Bars:

    • Located between the buy/sell numbers.

    • Green bar to the right: Positive Delta (Net Buying).

    • Red bar to the left: Negative Delta (Net Selling).

  4. DM Label: Marks the price level with the Maximum Absolute Delta inside the candle (the "battleground").

3. Intelligent Summary Box

In Microscope Mode, a semi-transparent data panel floats below each candle. This is your primary decision-making tool.

Data Item Description Trading Significance
Time Range Start & End time of the candle (Local PC Time). Easy historical backtesting.
OHLC Open, High, Low, Close prices. Standard reference.
Vol / Delta Total Volume & Net Delta (with %). Positive Delta = Buyers dominant; Negative = Sellers dominant.
Max/Min Delta The highest and lowest cumulative Delta reached during the candle formation. Crucial: If a candle closes with Positive Delta, but had a massive Min Delta, it shows buyers absorbed strong selling pressure.
VPOC Volume Point of Control. The price with the most volume. The "center of gravity" for the candle.
TPOC Time Point of Control. The price where the market spent the most time (Fair Value).
DM Delta Max Price. Where the aggressors committed the most capital.
VAH / VAL Value Area High/Low (70% Volume). Support/Resistance: Re-tests of VAL that hold are bullish; breakdowns are bearish.
Imbalance Total count of Buy vs. Sell Imbalances. High imbalance counts suggest strong trend momentum.
Alerts Status of Delta, VPOC, and TPOC. Yellow Highlighted Text indicates anomalies or divergence (Reversal Signals).

4. Deep Dive: Divergence & Market Sentiment

Divergence is one of the most reliable reversal signals in Order Flow trading. The indicator automatically detects:

4.1 Delta Divergence

  • Scenario:

    • Bullish Divergence: Candle closes DOWN (Bearish), but Delta is POSITIVE (Net Buying).

    • Bearish Divergence: Candle closes UP (Bullish), but Delta is NEGATIVE (Net Selling).

  • Sentiment:

    • Absorption: Bearish divergence implies that despite aggressive buying (Positive Delta), price couldn't rise. This means Limit Sell Orders (Icebergs) absorbed all the buying. This is a strong reversal signal.

4.2 Structural Divergence (VPOC/TPOC Location)

The indicator analyzes where the POC formed relative to the candle body (Top vs. Bottom).

  • Bullish Top Divergence (Warning):

    • Scenario: Big Green Candle, but VPOC/TPOC remains at the Bottom.

    • Sentiment: Price rallied on low volume at the highs. This is often "Short Covering" or "Retail Chasing." Lacking institutional support at the high, it is a Weak Rally prone to retracement.

  • Bullish Bottom Divergence (Healthy):

    • Scenario: Green Candle, VPOC at the Bottom (near Open).

    • Sentiment: Strong base building. Buyers absorbed sellers at the low and pushed price up. This is a Healthy structure.

  • Bearish Top Divergence (Healthy):

    • Scenario: Red Candle, VPOC at the Top.

    • Sentiment: Sellers defended the high and pushed price down. Healthy structure.

Summary Box Example:

VPOC Status: Bull Top Div (Highlighted Yellow) -> Caution: Longs may be trapped; high prices rejected.

4.3 Volume Burst

  • Scenario: Current candle volume is > 2x the average of the previous two candles.

  • Sentiment:

    • At Breakout: Validates the move.

    • After long trend: Suggests Climax/Exhaustion.

5. Parameter Configuration Guide

Adjust these settings based on your asset class:

🔧 Core Settings

  • InpPriceStep: Most Critical Parameter.

    • Defines the size of each "bin" (price aggregation).

    • Forex (EURUSD): Try 0.00005 (5 points) or 0.00010 (10 points). Too small = too much noise; too big = loss of detail.

    • Gold (XAUUSD): Try 0.1 (10 cents) or 0.5 .

    • Indices (US30): Try 1.0 or 5.0 .

  • InpMaxBarsToDraw: Number of candles to render. Keep between 200-500 to maintain performance.

Microscope Mode

  • InpMicroscopeMode: Set to true to enable the zoom and summary box.

  • InpMicroZoomScale: Zoom factor. Default is 4.5 (450% width).

    • If text overlaps, increase to 5.0 or 6.0 .

    • If chart is too wide, decrease to 3.0 .

  • InpMicroscopeTextMode:

    • Percentage : Shows % of total volume. Good for distribution analysis.

    • Value Coefficient : Shows (Current Vol / Average Vol). Value > 1.0 means high activity.

Colors & Alerts

  • InpImbalanceRatio: Threshold for coloring imbalances (Default 3.0 ).

  • InpColorHighlight: Color for warning text in the Summary Box (Default Yellow ).

  • InpAlert...: Enable popup/push notifications for specific divergence types.

6. Installation & Usage

  1. Download the footprintdorderflow.

  2. Drag the indicator onto your chart.

  3. Important: On first load, you will see "Syncing History (Calculating Vol)...". The indicator is downloading high-precision Tick data. Please wait a few seconds to a few minutes depending on your internet and history depth.

  4. Tip: Use Ctrl + Mouse Scroll or drag the price scale to adjust the chart height for the best visual experience.

Disclaimer: Footprint charts reveal past microstructure. While they significantly improve probability, no indicator guarantees future price movement. Use in conjunction with your broader trading strategy.

Recensioni 4
Rutt Tungkiratichai
2899
Rutt Tungkiratichai 2026.03.30 03:17 
 

Great indi as well as good developer.

labtrade
612
labtrade 2025.12.22 18:06 
 

Great indicator, and very supportive developer who implements updates and improvements quickly. Recommended :-)

Robert Čučun
36
Robert Čučun 2025.12.21 19:14 
 

Great work!!!! I recommend thank you for your support

Prodotti consigliati
RBreaker
Zhong Long Wu
RBreaker Gold Indicators is a short-term intraday trading strategy for gold futures that combines trend following and intraday reversal approaches. It not only captures profits during trending markets but also enables timely profit-taking and counter-trend trading during market reversals. This strategy has been ranked among the top ten most profitable trading strategies by the American magazine   Futures Truth   for 15 consecutive years. It boasts a long lifecycle and remains widely used and st
Manyal trading system, CovEchoTrend Robot, focuses on reliability and flexibility. By employing statistical analysis methods to study the relationships between the base indicator and market patterns, the system enables a deeper understanding of market processes. Intelligent pattern analysis: The application of statistical data processing helps identify key trend reversal points more accurately, signaling significant market shifts. Informed decision-making is based on the intersection of indicato
Trend Master V2
Oratile Pitsoane
What Is Trend Master Pro? Trend Master Pro   is a professional-grade trend trading indicator built for MetaTrader 5. It was designed with one goal in mind — to keep you on the right side of the market at all times by combining three powerful technical tools into a single, clean, easy-to-read display directly on your price chart. Instead of cluttering your screen with multiple separate indicators, Trend Master Pro fuses an   EMA Ribbon trend filter , a   ZigZag swing point engine , and a   breako
Indicatore Crypto_Forex "Major_Trend_Histogram" per MT5, senza ridisegno. - Indicatore Major_Trend_Histogram progettato per individuare trend davvero significativi. - L'indicatore può essere di 2 colori: rosa per trend ribassista e verde per trend rialzista (i colori possono essere modificati). - Rileva i trend nelle fasi iniziali, molto più efficiente di qualsiasi media mobile standard. - Major_Trend_Histogram può essere combinato con qualsiasi altro metodo di trading: Price Action, VSA e alt
Liquidity Oscillator
Paolo Scopazzo
3 (2)
A powerful oscillator that provide Buy and Sell signals by calculating the investor liquidity. The more liquidity the more buy possibilities. The less liquidity the more sell possibilities. Please download the demo and run a backtest! HOW IT WORKS: The oscillator will put buy and sell arrow on the chart in runtime only . Top value is 95 to 100 -> Investors are ready to buy and you should follow. Bottom value is 5 to 0 -> Investors are ready to sell and you should follow. Alert + sound will appe
FiveStarFX Gold Reversal Edge Professional automated trading solution designed for structured execution and controlled risk management in the Gold market. Built for traders who value discipline, precision, and consistency. Key Features Fully automated trading One trade at a time (controlled exposure) Fixed Stop Loss and Take Profit Smart Break-Even protection Profit lock with buffer Step-based trailing management Spread protection system Works on any broker Trade Management The E
FREE
HAS RSI Signal — Indicatore di Tendenza Professionale con Calcolo SL/TP HAS RSI Signal è un potente strumento di trading che combina classici intramontabili con moderni algoritmi di filtraggio del rumore. L'indicatore analizza il mercato attraverso le candele Heiken Ashi Smoothed (HAS) e l'oscillatore RSI , fornendo al trader segnali di ingresso chiari durante le inversioni di tendenza o l'uscita dalle zone di ipercomprato/ipervenduto. Vantaggi Principali: Doppio Filtraggio: L'uso di Heiken Ashi
Hunter Spike
Jaime Humberto Gomez Arias
Hunter Spike This indicator consists of two regression channels calibrated with the current movement of the synthetic index algorithm, for any Deriv or Weltrade broker. Each channel has a signal, a target that alerts us when the price touches them, indicating buys on booms or gains and sells on crashes or pains. -configuration for booms or gains: Channel zone 1 (30) Channel zone 2 (0) -configuration for crashes or pains: Channel zone 1 (100) Channel zone 2 (70) Zones freely configurable by
ShiftedPriceDensity   — Professional Price Density Indicator with Shifted Historical Levels Input parameters Depth 100 Starting depth   TopLevelsToShow 1 Levels in each set   NumberOfShifts 10 Number of sets   ShiftSpacing 20 Shift step between sets   PriceStep 0.0001 Minimum price difference between levels   PriceSource PRICE_CLOSE Source price type   LevelColor clrDodgerBlue Level line color   LevelWidth 2 Level line thickness   Prefix "" Object prefix for naming   ShiftedPriceDensity   is an
Real Trend Zigzag PRO   shows the real trend of a market, u nlike the default Zigzag indicator. It calculates the trend in real time and shows green lines for upwards trends, red lines for downward trends and blue lines for no trends.  Regarding the old slogan "the trend is your friend" it helps you to decide if should open a buy or sell position. The PRO version is a multi timeframe zigzag (MTF). Means, it shows the trend of the current timeframe as well as the trend of a higher or lower time.
FX TradeMeta Pro Signals
Yasir Mohammed Sachit Sachit
FX TradeMeta Pro — Professional Signal Indicator Overview An integrated indicator designed for professional traders, combining multiple advanced algorithms into one powerful tool to deliver precise entry and exit signals across all pairs and timeframes. Key Features Non-Repainting Signals All signals are calculated only on closed candles, ensuring they never change after appearing. Dynamic Tracking System An adaptive trailing line that automatically adjusts to market volatility, clearly showi
Range Directional Force Indicator – Designed for You to Optimize! The Range Directional Force Indicator is a cutting-edge tool designed to empower traders by visualizing market dynamics and directional strength. Built to offer insights into market trends and reversals, this indicator is an invaluable asset for traders seeking precision in their strategies. However, it is important to note that this indicator is not optimized, leaving room for you to tailor it to your unique trading preferences.
TrendDetect
Pavel Gotkevitch
The Trend Detect indicator combines the features of both trend indicators and oscillators. This indicator is a convenient tool for detecting short-term market cycles and identifying overbought and oversold levels. A long position can be opened when the indicator starts leaving the oversold area and breaks the zero level from below. A short position can be opened when the indicator starts leaving the overbought area and breaks the zero level from above. An opposite signal of the indicator can b
RevTech
Bashier Awny Husein Ismail Alhafy
Revtech MT5 Indicator brings together institutional concepts, market-structure logic, and classic price action patterns in one advanced trading tool. From Fair Value Gaps and Order Blocks to Head & Shoulders and Triangle formations, Revtech helps traders identify quality setups with clear chart visuals and execution levels. With dashboard monitoring, alerts, and timeframe-based strategy alignment, Revtech is designed to turn raw price action into a structured trading opportunity. The indicator
Final Stochastic Oscillator
Murtadha Majid Jeyad Al-Khuzaie
Final Stochastic Oscillator is a next-generation upgrade of the classic stochastic indicator, enhanced with adaptive smoothing, ADX filtering, and volume confirmation. Designed for traders who want more than just overbought/oversold signals, this tool intelligently adapts to market volatility and trend strength, giving you a clearer, more reliable reading of price momentum. Unlike the standard stochastic, which can produce frequent false signals in choppy conditions, the Final Stochastic Osci
SkyScraperMT5
Teressa Herlene Thomson
Overview SkyScraper is a sophisticated automated trading system built exclusively for MetaTrader 5. This versatile EA adapts to your trading style on any timeframe (optimized for 3-5 minute charts) and works seamlessly across forex pairs, cryptocurrencies, and metals including gold. Why SkyScraper? Smart Automation That Protects Your Capital Intelligent trade execution with multi-layer risk controls Dynamic position sizing that automatically adjusts to your broker's requirements Adaptive stop l
Turn your chart into a professional trading dashboard that shows where price is flowing and when the next shock is coming —without loading a single extra window. This indicator combines a price-following MA ribbon with a live news radar directly on the chart, giving you both trend and event risk in one glance. Trend Ribbon – Read the market bias instantly A smooth, step-style moving average ribbon follows price action bar by bar. Color change shows the active trend: aqua for bullish flow , gold
SMC Buy Sell Indicator Smart Money Structure • Confirmed Signals SMC Buy Sell Indicator is a price action–based trading tool designed to identify market structure using Smart Money Concepts (SMC). It focuses on detecting meaningful swing points, structural breaks, and confirmed Buy/Sell signals directly from chart data. All calculations are based on closed candles, ensuring stable and consistent signals without repainting. Core Concept The indicator analyzes price structure to identify: Key swi
Indicatore Crypto_Forex "Stocastico con zone dinamiche di ipervenduto/ipercomprato" per MT5, senza ridisegno. - L'oscillatore stocastico è uno degli indicatori più famosi sul mercato, uno strumento di trading perfetto per molti trader. - È ottimo per le posizioni di vendita dalla zona dinamica di ipercomprato e per le posizioni di acquisto dalla zona dinamica di ipervenduto. - Questo indicatore è eccellente anche da combinare con le posizioni di Price Action. - Zona dinamica di ipercomprato -
Automated Trendlines MT5
Georgios Kalomoiropoulos
Le linee di tendenza sono lo strumento più essenziale di analisi tecnica nel forex trading. Sfortunatamente, la maggior parte dei trader non li disegna correttamente. L'indicatore automatizzato delle linee di tendenza è uno strumento professionale per i trader seri che ti aiuta a visualizzare il movimento di tendenza dei mercati. Esistono due tipi di linee di tendenza, linee di tendenza rialziste e linee di tendenza ribassiste. Nella tendenza rialzista, la linea di tendenza Forex viene tracci
This indicator is for scalpers who want to make profit from recovery and retracements. As a scalping indicator, you won't win big but small and steady profits. How to use this? Open a stop buy order if the price close below the "Recovery" at the recovery price with a TP at the "Expected recovery". It's best to use with an EA to open orders automatically closing at the current "Expected recovery" instead of setting a TP. Doing so will ensure orders will close no matter where the price go without
Go Way TREND
Ywsf Hsyn Hmad Alrsh
Segui la tendenza. Sì, attendi il segnale di ingresso, sia di acquisto che di vendita, su un frame di 15 minuti e controlla il segnale se appare su un frame di 30 minuti (a volte ci vuole un'ora o più prima che il segnale appaia. Puoi tornare al frame di 15 minuti e torna al frame di 30 minuti, e ripeti l'operazione finché non appare il segnale principale. Se il segnale appare sul frame di 30 minuti, entra con il prezzo e il profitto viene preso quando la linea di disegno cambia , viene registr
Indicatore Crypto_Forex "WPR con 2 Medie Mobili" per MT5, senza ridisegno. - WPR è uno dei migliori oscillatori per lo scalping. - L'indicatore "WPR e 2 Medie Mobili" consente di visualizzare le medie mobili veloci e lente dell'oscillatore WPR. - L'indicatore offre l'opportunità di visualizzare le correzioni di prezzo molto presto. - È molto facile impostare questo indicatore tramite parametri e può essere utilizzato su qualsiasi timeframe. - È possibile visualizzare le condizioni di ingresso
Buy Sell Chill Indicator
Santino Emanuele Ventre
Take the stress out of trading with the Buy Sell Chill Indicator —your ultimate companion for effortless trend identification. This easy-to-use tool gives you a clear visual arrow to show the direction the market is about to take, making trading decisions as simple and "chill" as possible. Why Choose the Buy Sell Chill Indicator? Relaxed and Intuitive : Designed to make trading less stressful and more enjoyable by giving you straightforward signals with no clutter. Customizable Features : ATR Pe
Smart Buy Sell Signal is a powerful and easy-to-use trend trading indicator designed for traders who want clear and reliable buy and sell signals. The indicator uses an ATR-based smart trailing algorithm to detect trend reversals and generate precise entry signals. When the market trend changes, the indicator automatically plots Buy and Sell arrows directly on the chart, helping traders quickly identify trading opportunities. To improve decision making, the indicator also includes a Multi-Timefr
"2nd To NoneFX Scalper" is one powerful indicator which you can use on any timeframe. The accuracy is in between 90% - 95% can be more. The indicator is 100% non repaint so it doesn't repaint at all. When the arrow comes out wait for the candlestick to close the arrow won't repaint/recalculate or move. The indicator works with all volatility indices,step index, Boom & Crash(500 & 1000) and all currency pairs. You can change settings of the indicator. For great results find the trend of the pair,
Price Magnet — Price Density and Attraction Levels Indicator Price Magnet is a professional analytical tool designed to identify key support and resistance levels based on statistical Price Density. The indicator analyzes a specified historical period and detects price levels where the market spent the most time. These zones act as “magnets,” attracting price action or forming a structural base for potential reversals. Unlike traditional Volume Profile tools, Price Magnet focuses on price-time d
Fibaction
Abdelkhalek Orabi
Indicator Name: Fibaction – price action candle Detector Description: Fibo Signal Boxes is a powerful Smart Money Concept (SMC)-inspired indicator that auto-detects price action candles. bullish hammers and shooting stars, then draws precise Fibonacci entry zones and multiple take-profit levels directly on the chart. as for the SL personally i use 40 pips rules  Key Features: Detects bullish hammer and shooting star reversal candles. Automatically draws Fibonacci entry and TP boxes. as
PZ Mean Reversion MT5
PZ TRADING SLU
3 (2)
Indicatore unico che implementa un approccio professionale e quantitativo al trading di reversione. Sfrutta il fatto che il prezzo devia e ritorna alla media in modo prevedibile e misurabile, il che consente regole di entrata e uscita chiare che superano di gran lunga le strategie di trading non quantitative. [ Installation Guide | Update Guide | Troubleshooting | FAQ | All Products ] Segnali di trading chiari Incredibilmente facile da scambiare Colori e dimensioni personalizzabili Implementa l
Gli utenti di questo prodotto hanno anche acquistato
Divergence Bomber
Ihor Otkydach
4.9 (89)
Ogni acquirente dell’indicatore riceverà inoltre gratuitamente: L’utilità esclusiva “Bomber Utility”, che gestisce automaticamente ogni operazione, imposta i livelli di Stop Loss e Take Profit e chiude le posizioni secondo le regole della strategia I file di configurazione (set file) per adattare l’indicatore a diversi asset I set file per configurare il Bomber Utility in tre modalità: “Rischio Minimo”, “Rischio Bilanciato” e “Strategia di Attesa” Una guida video passo-passo per installare, conf
ARIPoint
Temirlan Kdyrkhan
1 (1)
ARIPoint is a powerful trading companion designed to generate high-probability entry signals with dynamic TP/SL/DP levels based on volatility. Built-in performance tracking shows win/loss stats, PP1/PP2 hits, and success rates all updated live. Key Features: Buy/Sell signals with adaptive volatility bands Real-time TP/SL/DP levels based on ATR Built-in MA Filter with optional ATR/StdDev volatility Performance stats panel (Success, Profit/Loss, PP1/PP2) Alerts via popup, sound, push, or email Cu
SignalTech MT5 is an unique fully rule based trading system for EURUSD, USDCHF, USDJPY, AUDUSD, NZDUSD, EURJPY, AUDJPY, NZDJPY, CADJPY.  All the winning trades with chart setups are published on the comments page. 2026-05 3173 Pips (Until 05-18 NY Closed) 2026-04 2243 Pips 2026-03 2165 Pips 2026-02 2937 Pips 2026-01 2624 Pips 2025-12 1174 Pips It can generate signals with Buy/Sell Arrows and Pop-Up/Sound Alerts. Each signal has clear Entry and Stop Loss levels, which should be automatically flag
Presentazione       Quantum Breakout PRO   , l'innovativo indicatore MQL5 che sta trasformando il modo in cui scambi le zone di breakout! Sviluppato da un team di trader esperti con un'esperienza di trading di oltre 13 anni,       Quantum Breakout PRO       è progettato per spingere il tuo viaggio di trading a nuovi livelli con la sua strategia innovativa e dinamica della zona di breakout. Quantum Breakout Indicator ti fornirà frecce di segnalazione sulle zone di breakout con 5 zone target di
Azimuth Pro
Ottaviano De Cicco
5 (7)
Azimuth Pro V2: Synthetic Fractal Structure and Confirmed Entries for MT5 Overview Azimuth Pro is a multi-level swing structure indicator by Merkava Labs . Four nested swing layers, swing-anchored VWAP, ABC pattern detection, three-timeframe structural filtering, and closed-bar confirmed entries — one chart, one workflow from micro-swings to macro-cycles. This is not a blind signal product. It is a structure-first workflow for traders who care about location, context, and timing. V2 Launch Offe
Meridian Pro
Ottaviano De Cicco
5 (2)
Meridian Pro 2.00: Professional Multi-Timeframe Trend Matrix for MT5 Meridian Pro 2.00 is a professional adaptive trend matrix for MetaTrader 5. It combines the original Meridian trend engine, a clean chart ribbon, closed-bar signal arrows, an 8-timeframe dashboard, Fuel momentum, weighted consensus, synthetic HTF processing and chart-native higher-timeframe context lines. The goal is simple: read current trend, multi-timeframe structure, strength, momentum and EA-ready state from one discipline
Innanzitutto, vale la pena sottolineare che questo Strumento di Trading è un Indicatore Non-Ridipingente, Non-Ridisegnante e Non-Laggante, il che lo rende ideale per il trading professionale. Corso online, manuale utente e demo. L'Indicatore Smart Price Action Concepts è uno strumento molto potente sia per i nuovi che per i trader esperti. Racchiude più di 20 utili indicatori in uno solo, combinando idee di trading avanzate come l'Analisi del Trader del Circolo Interno e le Strategie di Tradin
KT Alpha Hunter Arrows MT5
KEENBASE SOFTWARE SOLUTIONS
La maggior parte degli indicatori a frecce ti dà un segnale e poi ti lascia capire da solo tutto il resto. KT Alpha Hunter Arrows ti offre un piano di trading completo. Ogni freccia di segnale appare con un piano completo già disegnato: linea di ingresso, stop loss, quattro livelli di take profit e un verdetto live sull’edge, che ti indica se quel simbolo e quel timeframe meritano davvero di essere tradati in quel momento. Il Trade Manager EA incluso gestisce l’esecuzione dopo il tuo ingresso, c
Gem SIGNAL
Shengzu Zhong
5 (1)
GEM Signal Pro GEM Signal Pro è un indicatore trend-following per MetaTrader 5, progettato per i trader che desiderano segnali più chiari, configurazioni operative più strutturate e una gestione del rischio più pratica direttamente sul grafico. Invece di mostrare solo una semplice freccia, GEM Signal Pro aiuta a presentare l’intera idea di trading in modo più chiaro e leggibile. Quando le condizioni sono confermate, l’indicatore può mostrare sul grafico il prezzo di ingresso, lo stop loss e gli
Top indicator for MT5   providing accurate signals to enter a trade without repainting! It can be applied to any financial assets:   forex, cryptocurrencies, metals, stocks, indices .  Watch  the video  (6:22) with an example of processing only one signal that paid off the indicator! MT4 version is here It will provide pretty accurate trading signals and tell you when it's best to open a trade and close it. Most traders improve their trading results during the first trading week with the help of
Btmm state engine pro
Garry James Goodchild
5 (4)
BTMM State Engine Pro is a MetaTrader 5 indicator for traders who use the Beat The Market Maker approach: Asian session context, kill zone timing, level progression, peak formation detection, and a multi-pair scanner from a single chart. It combines cycle state logic with a built-in scanner dashboard so you do not need the same tool on many charts at once. What it does Draws the Asian session range; session times can follow broker server offset or be set in inputs. Tracks level progression (L
Quantum TrendPulse
Bogdan Ion Puscasu
5 (25)
Ecco   Quantum TrendPulse   , lo strumento di trading definitivo che combina la potenza di   SuperTrend   ,   RSI   e   Stocastico   in un unico indicatore completo per massimizzare il tuo potenziale di trading. Progettato per i trader che cercano precisione ed efficienza, questo indicatore ti aiuta a identificare con sicurezza le tendenze di mercato, i cambiamenti di momentum e i punti di entrata e uscita ottimali. Caratteristiche principali: Integrazione SuperTrend:   segui facilmente l'andame
Trend Forecaster
Alexey Minkov
5 (7)
Trend Forecaster – Since 2023. The Trend Forecaster indicator utilizes a unique proprietary algorithm to determine entry points for a breakout trading strategy. The indicator identifies price clusters, analyzes price movement near levels, and provides a signal when the price breaks through a level. The Trend Forecaster indicator is suitable for all financial assets, including currencies (Forex), metals, stocks, indices, and cryptocurrencies. You can also adjust the indicator to work on any time
OrderFlux | Footprint Orderflow per MetaTrader 5 Versione 2.0 – Visualizzazione Bid/Ask in tempo reale per Trader Attivi OrderFlux è un indicatore di footprint e orderflow per MT5. Non mostra solo dove si è mosso il prezzo, ma cosa succede all'interno del movimento: volume Bid/Ask per livello di prezzo, delta, imbalance e distribuzione del volume. Molti grafici ti mostrano solo il risultato finale di una candela. OrderFlux ti mostra il percorso per arrivarci. Questo è esattamente ciò che aiuta q
Grabber System MT5
Ihor Otkydach
4.83 (23)
Ti presento un eccellente indicatore tecnico: Grabber, che funziona come una strategia di trading "tutto incluso", pronta all’uso. In un solo codice sono integrati strumenti potenti per l’analisi tecnica del mercato, segnali di trading (frecce), funzioni di allerta e notifiche push. Ogni acquirente di questo indicatore riceve anche gratuitamente: L’utility Grabber: per la gestione automatica degli ordini aperti Video tutorial passo dopo passo: per imparare a installare, configurare e utilizzare
RelicusRoad Pro MT5
Relicus LLC
4.96 (24)
RelicusRoad Pro: Sistema Operativo Quantitativo di Mercato 70% DI SCONTO ACCESSO A VITA (TEMPO LIMITATO) - UNISCITI A 2.000+ TRADER Perché la maggior parte dei trader fallisce anche con indicatori "perfetti"? Perché operano su Singoli Concetti isolati. Un segnale senza contesto è una scommessa. Per vincere serve CONFLUENZA . RelicusRoad Pro non è un semplice indicatore. È un Ecosistema Quantitativo completo . Mappa la "Fair Value Road", distinguendo tra rumore e rotture strutturali. Smetti di in
OmniSync Projection
Antonio-alin Teculescu
5 (1)
Chronos Fractal Engine is an innovative price projection indicator for MetaTrader 5, designed to transform your technical analysis by intelligently identifying and projecting historical price patterns. Built upon an advanced correlation algorithm and the fractal principles of the market, this powerful tool visualizes potential future price movements, giving you a unique edge in your trading decisions. What is Chronos Fractal Engine? At its core, the Chronos Fractal Engine employs a sophisticat
Presenting one-of-a-kind Gann Indicator for XAUUSD IQ Gold Gann Levels is a non-repainting, precision tool designed exclusively for XAUUSD/Gold intraday trading. It uses W.D. Gann’s square root method to plot real-time support and resistance levels, helping traders spot high-probability entries with confidence and clarity. William Delbert Gann (W.D. Gann) was an exceptional market analyst whose trading technique was based on a complex blend of mathematics, geometry, astrology, and ancient calcul
Rilevatore intelligente multistrato di breakout e pullback per MetaTrader 5 "Intelligente. Semplice. Veloce!" Sei stanco di perdere entrate su breakout ad alta probabilità? Passi ore a scansionare più grafici, cercando di allineare i breakout con la direzione del trend e il momentum delle valute — solo per perdere il movimento? Break Pullback risolve tutto questo con un solo indicatore. Cos'è Break Pullback? Break Pullback è un indicatore MetaTrader 5 di livello professionale, progettato speci
ARICoins
Temirlan Kdyrkhan
ARICoin is a powerful trading companion designed to generate high-probability entry signals with dynamic TP/SL/DP levels based on volatility. Built-in performance tracking shows win/loss stats, PP1/PP2 hits, and success rates all updated live. Key Features: Buy/Sell signals with adaptive volatility bands Real-time TP/SL/DP levels based on ATR Built-in MA Filter with optional ATR/StdDev volatility Performance stats panel (Success, Profit/Loss, PP1/PP2) Alerts via popup, sound, push, or email Cust
Meravith MT5
Ivan Stefanov
5 (1)
Strumento per market maker. Meravith: Analizzerà tutti i timeframe e mostrerà il trend attualmente in corso. Evidenzierà le zone di liquidità (equilibrio dei volumi) dove i volumi rialzisti e ribassisti sono uguali. Mostrerà tutti i livelli di liquidità dei diversi timeframe direttamente sul grafico. Genererà e presenterà un’analisi di mercato testuale a scopo di riferimento. Calcolerà obiettivi, livelli di supporto e punti di stop-loss in base al trend attuale. Calcolerà il rapporto rischio/ren
The principle of this indicator is very simple: detecting the trend with Moving Average, then monitoring the return point of graph by using the crossing of Stochastic Oscillator and finally predicting BUY and SELL signal with arrows, alerts and notifications. The parameters are fixed and automatically calculated on each time frame. Example: If you install indicator on EURUSD, timeframe M5: the indicator will detect the main trend with the Moving Average on this timeframe (for example the Moving
L'indicatore " Dynamic Scalper System MT5 " è progettato per il metodo di scalping, ovvero per il trading all'interno di onde di trend. Testato sulle principali coppie di valute e sull'oro, è compatibile con altri strumenti di trading. Fornisce segnali per l'apertura di posizioni a breve termine lungo il trend, con ulteriore supporto al movimento dei prezzi. Il principio dell'indicatore. Le frecce grandi determinano la direzione del trend. Un algoritmo per generare segnali per lo scalping sott
Il livello Premium è un indicatore unico con una precisione superiore all'80% delle previsioni corrette! Questo indicatore è stato testato dai migliori Specialisti di Trading per più di due mesi! L'indicatore dell'autore che non troverai da nessun'altra parte! Dagli screenshot puoi vedere di persona la precisione di questo strumento! 1 è ottimo per il trading di opzioni binarie con un tempo di scadenza di 1 candela. 2 funziona su tutte le coppie di valute, azioni, materie prime, criptovalu
AriX
Temirlan Kdyrkhan
1 (4)
AriX Indicator for MT5 A powerful trend-following and signal-evaluation tool AriX is a custom MT5 indicator that combines Moving Averages and ATR-based risk/reward logic to generate clear buy/sell signals. It visualizes dynamic SL/TP levels, evaluates past trade outcomes, and displays win/loss statistics in a clean on-chart panel. Key features include: Buy/Sell signals based on MA crossovers ATR-based SL/TP1/TP2/TP3 levels with visual lines and labels Signal outcome tracking with real-time stat
Assembler
Darko Licardo
5 (1)
Introducing Assembler:  The best value for money,  Designed for advanced traders and professionals, yet accessible for ambitious beginners ready to elevate their trading game. Great for ICT, SMC, TREND and breakout traders . Combining advanced analytics, a sleek graphical interface, and highly customizable features, Assembler empowers you to trade with precision, clarity, and confidence. Key Features of Assembler 1. Dynamic Graphical User Interface (GUI): A fully draggable, customizable interf
Bill Williams Advanced
Siarhei Vashchylka
5 (11)
Bill Williams Advanced is designed for automatic chart analysis using Bill Williams' "Profitunity" system. The indicator analyzes four timeframes at once. Manual (Be sure to read before purchasing) Advantages 1. Analyzes the chart using Bill Williams' "Profitunity" system. Signals are displayed in a table in the corner of the screen and on the price chart. 2. Finds all known AO and AC signals, as well as zone signals. Equipped with a trend filter based on the Alligator. 3. Finds "Divergence Bar
Panther Trade Scenario — mostra un chiaro scenario di trading direttamente sul grafico. L’indicatore elimina il principale problema nel trading — l’incertezza nel momento in cui devi agire. Invece di cercare di indovinare il momento migliore, vedi esattamente: dove entrare, dove limitare il rischio e dove prendere profitto.   Perché la maggior parte degli errori avviene all’ingresso Il problema non è che non capisci il mercato. Nella maggior parte dei casi, la situazione è questa: vedi il movime
Scalping Winning Signals Pro SWS
Muhammad Usman Siddique
5 (1)
UZFX SWS {Scalping Winning Signals} Pro v1.0 è un potente indicatore non ridipingente sviluppato da Usman Zabir (UZFX LABS) appositamente per scalper, day trader e swing trader alla ricerca di segnali di ingresso precisi in mercati in rapido movimento. Ideale per i trader che richiedono segnali affidabili e in tempo reale senza ritardi o false ridipinture. I MIEI INTERVALLI DI TEMPO CONSIGLIATI*: 30 M E OLTRE. {1H} È IL MIO PREFERITO. E I RISULTATI SONO SORPRENDENTI...! Nota: combinatelo con l'
Liquidity Zones  - Supply and Demand Flip Retest - Professional Liquidity, Supply & Demand Indicator Identify High-Probability Trading Zones with Precision SMC Liquidity Zones and SD Flips is a sophisticated technical indicator designed to automatically detect and visualize institutional supply and demand zones on your MetaTrader 5 charts. Built for serious traders who understand market structure and liquidity concepts. KEY FEATURES Automatic Zone Detection - Identifies liquidity zones b
Altri dall’autore
OrderFlow Bubbles Pro  (OFB-Pro)( Order flow main force large order bubble monitoring indicator )  DEMO version,modleling must choose " Every tick based on real ticks" Peer into the Micro-World of Candlesticks Like an Institutional Trader。[The last two screenshots show scenarios where the Orderflow Smart Flip indicator is used in combination with other indicators.] important note: on the strategy tester, when testing the indicator use either of the modes below Every Tick Every tick based on re
Orderflow Super Candles - Simple Footprint Chart Indicator Platform: MetaTrader 5 (MT5)  (The last screenshot shows the use of the DOM tool in conjunction with the product.) 1. Product Introduction Orderflow Super Candles is a professional charting tool based on underlying Tick data analysis, designed to provide traders with a deep "X-ray" view of the market. By parsing the buy and sell volume distribution within each candlestick, this indicator visualizes the hidden market microstructure. It
Dom Book HeatMAP Lightning Trading Panel Professional-Grade Microstructure Lightning Trading Panel · User Manual Important notice: Before placing an order, please contact me first, and I will provide you with professional answers and services Major update explanation: On January 10, 2016, automatic trading EA and control panel were added. For detailed parameter configuration, please refer to the latter half of this article. Important Note: 1、As this is a heatmap, footprint map, and DOM tradin
Support Resistance Pro line — Insight into Institutional Footprints, Capturing Reversals, Making Every Line Data-Driven.(This indicator has the same function as the Orderflow Smart Flip indicator, with only the name differing) Product Introduction Say Goodbye to Guesswork. Embrace the Data Truth. Support Resistance Pro line  is not just another drawing tool; it is an institutional behavior analysis system built on   Tick-level microscopic data . Acting like an X-ray for the market, it penetrate
Orderflow Smart Flip ( DEMO version,modleling must choose " Every tick based on real ticks") — Insight into Institutional Footprints, Capturing Reversals, Making Every Line Data-Driven. Important notice: Before placing an order, please contact me first, and I will provide you with professional answers and services Product Introduction Say Goodbye to Guesswork. Embrace the Data Truth. [The last two screenshots show scenarios where the OrderFlow Bubbles Pro indicator is used in combination.] Ord
AI Adaptive Market Holographic System Indicator Based on Microstructure and Field Theory Abstract: This paper aims to explore the construction principles and implementation mechanism of a novel financial market analysis tool—the Micro gravity regression AIselfregulation system. This system fuses Market Microstructure theory, classical mechanics (elasticity and gravity models), information entropy theory, and adaptive AI algorithms. By aggregating Tick-level data in real-time, physically modeling
Trade  Risk  Manager Pro (Trade Control Assistant Pro) - User Manual 1. Product Overview & Key Features Trade Risk Manager Pro is an institutional-grade risk management panel developed for the MetaTrader 5 (MT5) platform. Its core philosophy is to decouple "Trade Execution" from "Risk Control." By enforcing hard constraints , it helps traders overcome psychological weaknesses (such as holding losing trades, over-leveraging, or revenge trading) while providing a modern, seamless user experience.
BinanceData
Jingfeng Luo
After downloading this service program, it will be used as a service support program for Dom BookHeatMAP Lightning Trading Panel. Dom BookHeatMAP Lightning Trading Panel   download link: https://www.mql5.com/zh/market/product/159414?source=Site+Market+MT5+Search+Rating006%3aDom+BookHeatMAP+Lightning+Trading+Panel Please first drag and drop the downloaded file to the corresponding service folder (` MQL5 \ Services `) in the MT5 data directory, and confirm that the file has been successfully pla
ProQuant Probability Map: A Dual-Quant Prediction System to Navigate the Future Say goodbye to blind guessing. Let historical data be your compass. The ProQuant Probability Map is an advanced quantitative tool exclusively designed for MetaTrader 5. Unlike traditional lagging indicators (such as RSI or MACD), it calculates historical price distribution probabilities in real-time, directly projecting a "Heatmap" of potential future price levels onto the right side of your chart. Version 7 introduc
Crypto Gold Arbitrage Pro - Product Introduction    [MT5 limit,  DEMO version dont work!] Core Positioning Crypto Gold Arbitrage Pro is a cross-exchange gold arbitrage system designed for the MT5 platform, capturing price discrepancies between MT5 brokers and cryptocurrency exchanges (Binance/OKX) to achieve low-risk, high-efficiency arbitrage trading.  Five Core Advantages 1. Dual-Platform Intelligent Switching Support for Binance and OKX - two major cryptocurrency exchanges Choose single-platf
Filtro:
Rutt Tungkiratichai
2899
Rutt Tungkiratichai 2026.03.30 03:17 
 

Great indi as well as good developer.

Jingfeng Luo
1099
Risposta dello sviluppatore Jingfeng Luo 2026.03.30 08:36
thx for your review hope this indicator will help you
labtrade
612
labtrade 2025.12.22 18:06 
 

Great indicator, and very supportive developer who implements updates and improvements quickly. Recommended :-)

Jingfeng Luo
1099
Risposta dello sviluppatore Jingfeng Luo 2025.12.23 12:44
thank you ,hope you enjoy it ,if you have any ideas about this indicator ,just text me bro .
Robert Čučun
36
Robert Čučun 2025.12.21 19:14 
 

Great work!!!! I recommend thank you for your support

Jingfeng Luo
1099
Risposta dello sviluppatore Jingfeng Luo 2025.12.22 00:59
thank you ,hope you enjoy it ,if you have any ideas about this indicator ,just text me bro .
floriano12
46
floriano12 2025.12.14 11:58 
 

I recommend this indicator for its functionality and reliability. The user support is excellent, and thank you very much.

Jingfeng Luo
1099
Risposta dello sviluppatore Jingfeng Luo 2025.12.14 12:00
thank you ,hope you enjoy it ,if you have any ideas about this indicator ,just text me bro .
Rispondi alla recensione