CGE Trading Suite

5

Institutional-Grade Analytics for MT5

The full analytical edge of a professional trading desk, built into your MT5 chart. A full guided tour walks you through every feature step by step.

Standard retail platforms lack the depth required for professional market analysis. The CGE Trading Suite bridges this gap, transforming MetaTrader 5 into a comprehensive workspace.

By integrating 18 proprietary modules into a single, unified chart interface, the suite eliminates fragmented analysis. It provides definitive clarity across market structure, timing, momentum, volume, capital flow, and regime change.

Analysis is only half of the workflow. The free companion CGE Trade Desk completes it, bringing execution and risk control to the same chart. It aligns automatically beneath the suite's Chart Tools panel, so you move from reading the market to placing the trade without leaving the chart.


Why CGE Trading Suite?

The suite empowers traders with structure, confidence, and consistent performance across all markets and time frames.

Hover over any signal or tool on the chart to instantly see a clear, concise description of exactly what you are looking at.

  • MetriX
    A full trading dashboard inside your chart, organised in a sidebar of views. Every change applies immediately on the chart, no re-attach required.

    • Overview – the month as a calendar of your daily results, next to your performance and the live capital flow scanner.
    • Daily brief – a short summary of the day, written from the suite's own numbers: where money is moving, which pairs to watch, whether your open trades go with or against the flow, and today's news for your currencies.
    • Calendar – the economic calendar for today, this week or next week, filtered by impact and currency, with news alerts and quiet hours.
    • Performance – net result, win rate, profit factor, max drawdown, equity curve and results by symbol, with a goal path for your daily goal and daily loss limit.
    • Replay – plays back each closed trade on a chart of its market.
    • Scanner – ranks capital flow or recent chart-tool signals across markets.
    • Capital flow – explains how the flow tags are decided, with the strength of each currency, a flow map, your chart's pair, a glossary and a score history of the last 5 or 10 days.
    • Watchlist – keeps the markets you care about in front of you. Each has a preview chart (M15, H1, H4, D1) showing Smart Grid levels, the 5 and 10 EMA, sessions, the D1 CROSSOVER and recent signals, plus per-market alerts and one click to the chart.
    • Exposure – how much of each currency your open trades are buying or selling, what each trade loses if its stop is hit, and a warning when 3 or more trades pile into the same currency.
    • Session – shows when Sydney, Tokyo, London and New York are live, in your local time, with each session's home markets sorted by daily capital flow.
    • Correlation – shows which markets move together.
    • Trader Account – your account at a glance, with its currency and leverage.
    • Guide – a built-in setup tour of up to 153 steps that walks you through every page and shows you each control on the panel.
    • Settings – a settings panel for every module, with each feature switched on or off right from the chart, a search box to find any setting, and Strategy presets that set up the Silver Bullet strategy in one click and switch the chart to M5.

  • Daily Capital Flow Index + Scanner
    The core directional engine. It scores eight currencies plus gold and silver on the 5 and 10 EMA of the daily close, one trading week and two trading weeks, to reveal where the dominant flow is running, so you trade with institutional money instead of against it. Each pair is tagged Very Bullish, Bullish, Neutral, Bearish or Very Bearish from the gap between its two sides, and the D1 CROSSOVER marks the day the stronger side took over. Weekday snapshots refresh capital flow three times — 1 hour before London, 1 hour before New York, and again at the D1 close — so you can read session bias before the open and recalibrate off the completed day.

  • Chart Tools
    One panel to command the workspace. Toggle any module ON or OFF directly from the chart, so you build exactly the view a setup needs and strip away everything else.

  • Price Label
    A live readout pinned to price: bid, ask, real-time spread, and a countdown to the close of the active bar. A built-in mini Daily Capital Flow Index chart shows the prevailing directional bias, so you read the exact price you are trading and the pressure behind it in one compact panel.

  • Smart Grid
    Automatically plots the psychological round numbers where price repeatedly reacts, putting key levels on your chart before the market reaches them.

  • Trap Play
    Flags false breakouts in real time: moments where price appears to break out only to reverse sharply. Sidestep the deceptive entry and position around the liquidity-driven reversal instead.

  • Knee-Jerk Pattern
    A single-bar trap: price spikes beyond the prior bar's high or low, closes back inside, and the next bar confirms the failure. It is not a trend change, just a choppy-market head-fake. Do not chase the spike; wait for the true move that follows.

  • Exhaustion Pattern 9/13
    Tracks momentum exhaustion with a dual-cycle sequential count. A 9-bar impulse marks where trend momentum begins to fade; if pressure persists, a 13-bar cascade confirms full exhaustion, the structural point where buying or selling pressure is spent. Each completed count projects a risk level onto the chart, marking the price that must hold for the signal to remain valid; a break through it invalidates the setup. Use it to find high-probability reversal zones and to avoid entering trends already running on empty.

  • Breakout Line Channel
    A cyclical, momentum-based tool that reads the angle of price movement to reveal direction and pressure. Steeper angles signal stronger momentum, letting you spot potential breakouts and breakdowns early.

  • Trend Channel
    Draws the pair of parallel trend lines that frame the dominant uptrend or downtrend. It scans back through price history for two major swing highs and two major swing lows, then builds a primary trend line and its matching parallel so the active trading channel is unmistakable.

  • MIDAS - Hawkins
    A VWAP-based tool that plots dynamic support and resistance by anchoring volume-weighted price curves to significant market turning points. The Hawkins method anchors directly to highs and lows for precise, actionable levels, while the Top/Bottom Finder weighs cumulative volume against price movement to tell you whether a trend has the fuel to continue, or whether exhaustion and a reversal are approaching.

  • SMC Playbook
    Maps the institutional trading day directly onto your chart. The Asian range, London Open, New York AM, and London Close kill zones are shaded as the windows where smart-money activity concentrates, with the Asian range projected forward as live liquidity reference lines and the Silver Bullet windows (03:00, 10:00, and 14:00 New York) marked for high-probability setups. Around each Silver Bullet window a status card shows whether the window is open, liquidity has been taken, a fair value gap has formed, a target is in view and high impact news is due. A corner session clock tracks live New York time, highlights the active kill zone, and counts down to the next session, and to the reopen whenever the market is closed. Timezone and US daylight-saving shifts are handled automatically, so every session aligns precisely with New York regardless of your broker.

  • Order Blocks
    Automatically maps supply and demand zones anchored to confirmed swing pivots. A strict impulse filter admits only zones with a genuine institutional footprint: price must leave the base with real conviction. Fresh, untested zones are distinguished from levels already revisited, and broken zones are cleared automatically, so your chart only ever shows the areas where the market is most likely to react.

  • Legs
    Maps the impulse and correction legs that make up the trend, so you see how far a move has already travelled and where the next swing is likely to form. Each leg is drawn from tip to origin on a Wick or Close basis you choose in Settings, with an optional V-shape filter that keeps only clean, tradable swings and drops the noise. Breaks of structure along the path are marked when enabled, and everything confirms on closed bars, so the picture you act on does not repaint. Use it beside Order Blocks when you need the path of the move, not only the pivots.

  • Bifurcation
    Marks the bar where a market stops behaving the way it has been. Character rarely changes gradually: price holds its state, becomes less able to absorb disturbance, then resolves quickly one way or the other. Bifurcation marks that moment and draws both paths, because the loss of stability does not decide which one is taken. A close through the upper curve resolves it upward, the lower one downward, and a mark reaching neither simply came to nothing. Infrequent by design and confirmed on closed bars only, so nothing repaints.

  • Volume Profile
    Reveals where the market actually did business. Every other volume tool measures activity against time. Volume Profile measures it against price, distributing traded volume across each level to show where value was accepted and where it was rejected. The Point of Control marks the price with the heaviest participation, and the value area bounds the 70% of volume around it, separating the prices the market agreed on from the ones it merely visited. Naked POCs, prior sessions' control prices that have never been traded back through, are tracked automatically and cleared the moment price returns, marking the unfinished auctions that so often act as a draw on liquidity. The profile period scales with your chart automatically, from daily sessions on intraday timeframes through weekly, monthly and yearly profiles above, and samples from its own source timeframe so resolution stays high whether you are on M1 or MN1. Volume source is detected automatically, using real exchange volume where the broker reports it and tick volume elsewhere, with the active source shown on the hover card.

  • Arrays
    A timing tool rooted in Pi-cycle theory that pinpoints high-energy turning-point windows in time. Blue bars signal low energy and normal conditions; gold bars indicate converging cycles and expanding volatility; orange bars, the core signal, mark windows where a trend change is probable; crimson bars flag extreme convergence, where the sharpest reversals, capitulation lows, and blow-off tops tend to cluster. Read them as a sequence: a clean build from blue to crimson and back is the highest-quality signal the system produces.

  • ECM & Pi Cycles
    Plots long-term ECM and π-based timing cycles directly on the chart as vertical markers. These cycles have historically coincided with major market turning points, giving you a macro timing backdrop to confirm whether your short-term signals align with a larger cyclical move.

  • Economic Events
    A full economic calendar built directly into your charts. High-impact releases are plotted as vertical markers; hover any marker for the event name and live countdown, without leaving your workflow. Anticipate volatility, stay out during risky windows, or position ahead of the announcements that move markets.

  • Live News Ticker
    A scrolling breaking-news strip pinned along the bottom of your chart, streaming market-moving headlines in real time so you never miss a release while you stay focused on price. Headlines refresh continuously, newest first, and hovering any headline expands the full story for instant context, with no second screen and no switching tabs. Where the Economic Events calendar covers the scheduled releases, the ticker captures the unscheduled flow: central-bank remarks, geopolitical headlines, and surprise data, giving you both sides of the news picture. The ticker is powered by the CGE News Bridge, which streams live InvestingLive.com headlines into the suite.

  • CGE Trade Desk
    The execution layer of the suite. Drag entry, stop-loss and take-profit lines directly on the chart, and the desk calculates the exact position size from your risk, sets the expiry and places the order. A built-in prop-firm protection layer enforces daily loss limits and profit targets, with an automatic daily lockout. It shares the suite's theme and attaches beneath Chart Tools automatically, so analysis and execution work as one.


Support & Communication
Developer support is available through the MQL5 messaging system, with most inquiries answered within 24 hours.


Risk Disclosure
Trading financial instruments carries a high level of risk and may not be suitable for all investors. Market conditions can change rapidly, and losses may exceed expectations. No indicator or analysis tool can guarantee profits or eliminate risk. Users are strongly advised to familiarize themselves with the risks involved and to practice using these tools in a demo environment before applying them to live trading.

Avis 3
eman11
1844
eman11 2026.10.29 18:24 

Nice suite of trading tools, including some less common but powerful ones. Beyond that, what stands out is the seller's responsiveness and pride in his work. The product is constantly being updated with new features and useful ideas. Recommend.

tomgrovess
101
tomgrovess 2026.04.16 18:01 

The most professional indicator you will find. Its so much more, it is packed full of various ways to be profitable in markets. Each individual part of the CGE suit is amazing as a stand alone yet the suit allows you to combine and use them all with extreme smoothness. I will never use anything else and would one million percent advise anyone to take the trial and experience how elite the CGE trading suit really is. Your subscription or purchase will follow after, i guarantee it. Support is offered from the creator carl and he is a genuine, extremely helpful man.

dannyloveridge
134
dannyloveridge 2026.01.11 09:57 

Unbelievable value for money, This is tool have everything a trader needs all in one place from the teachings of martin Armstrong a leading pioneer in the world of economics, Clean visible key levels making it evident on how they are truly respected, Capital flow index giving you the intermarket analysis necessary to position yourself in a high probability trend, MIDAS one of the most underrated and unheard custom formulars of VWAP to identify the average price willing to be paid within the current trend and a automatic supply and demand area highlighter showing you where big entity's was likely involved in the market giving you a insight for a potential area that if prices retraces to will give a reaction. This is a no fluff tool with real logic behind each aspect that any serious trader can use to there advantage

Produits recommandés
MercariaPattern1-2-3 відстежує рух ціни, знаходить трьоххвильові структури 1-2-3 та підсвічує момент, коли сценарій підтверджується пробоєм ключового рівня. MercariaPattern1-2-3 tracks price movement, detects three-leg 1-2-3 structures and highlights the moment when the scenario is confirmed by a key level breakout. Індикатор збирає локальні свінги в компактну фігуру 0–1–2–3 , чекає підтвердженого пробою та будує стрілку входу з готовими рівнями SL/TP. The indicator combines local swings into a
Part 2 — Bottom Indicator: TudasDownCombined.mq5 2.1 Money Flow Price is rising, but money is actually leaving the asset — you can't see this in the candles, and the move dies right after you enter, because there's no real buyer behind it. Money Flow shows the intensity of capital entering and leaving the asset, before this shows up in price, not after. The line is smoothed through a cascade of EMAs to strip out small-player noise and show the direction the big players are setting. Flow rising
##   ONLY GOLD ##   Тiльки Золото ## **Mercaria Professional Trading Zones - Complete Guide** ## **Mercaria Professional Trading Zones - Повний посібник** ### **How Mercaria Zones Work / Як працюють зони Mercaria** **English:** Mercaria Zones is an advanced trading indicator that identifies high-probability support and resistance areas using ZigZag extremes combined with mathematical zone calculations. The indicator works on multiple timeframes simultaneously, providing a comprehensive view
Unlock hidden profits: accurate divergence trading for all markets Tricky to find and scarce in frequency, divergences are one of the most reliable trading scenarios. This indicator finds and scans for regular and hidden divergences automatically using your favourite oscillator. [ Installation Guide | Update Guide | Troubleshooting | FAQ | All Products  ] Easy to trade Finds regular and hidden divergences Supports many well known oscillators Implements trading signals based on breakouts Displays
PulseColor Overview PulseColor is an indicator for MetaTrader 5 that visualizes the current dominance of the positive or negative directional indicator ( +DI or -DI ) by coloring the High–Low range of each bar directly on the price chart. The indicator works in the main chart window and does not open an additional subwindow. PulseColor uses the classic Average Directional Movement Index (ADX) calculation. For each bar, the indicator compares the values of +DI and -DI . The stronger component det
PatternScope — Multi-Pattern Recognition for MT5 PatternScope is a multi-pattern recognition indicator for MetaTrader 5. It scans price action for classic chart patterns, confirms breakouts, and draws clear   Entry, Stop Loss and Take Profit   levels. A compact dashboard shows the latest pattern, bias and Risk:Reward. Patterns:   Double Top/Bottom, Triple Top/Bottom, Head and Shoulders (and inverted), Bullish & Bearish Flag, Pennant, Rising & Falling Wedge, Triangle, Rectangle, Cup and Handle —
GP Confluence Scanner MT5 Advanced Multi-Timeframe Market Structure & Confluence Analysis Don't get stopped out easily again! GP Confluence Scanner MT5 is an advanced technical analysis indicator designed to reveal important market levels, hidden support and resistance, and multiple technical confluences before entering a setup. Rather than relying on a single indicator, GP Confluence Scanner examines multiple technical factors to identify areas where significant market reactions may occur. Key
RBreaker
Zhong Long Wu
RBreaker Gold Indicators est une stratégie de trading intraday à court terme pour les contrats à terme sur l'or, qui combine deux approches : le suivi de tendance et le retournement intraday. Elle permet non seulement de capturer les profits dans les marchés en tendance, mais aussi de prendre des bénéfices en temps opportun lors des retournements de marché et d'ouvrir une position en sens inverse. Cette stratégie a été classée pendant 15 années consécutives parmi les dix stratégies de trading l
IVISTscalp5
Vadym Zhukovskyi
5 (6)
Французский [iVISTscalp5] : Un laboratoire d’étude du comportement du marché à travers le temps TLV Framework | Liquidity Activation Points ⸻ Description Générale iVISTscalp5 est un indicateur multi-niveau de timings et de structure de prix développé dans le cadre du projet VISTmany. Le système prévoit le temps, la direction et l’amplitude du mouvement à travers les Liquidity Activation Points (timings). L’indicateur iVISTscalp5 peut être utilisé avec les paramètres par défaut pou
Gravity Channels
BeeXXI Corporation
This indicator allows the trader to see what is difficult to see and recognize with the eyes. The indicator naturally recognizes and visualizes all processes in the behaviour of a trading instrument, which will be an excellent assistant for a trader who likes to make decisions on his own. This indicator draws a set of approximating channels in all sections of history with different periods. Formed channels form naturally and form their own hierarchy of channels by seniority (length and width).
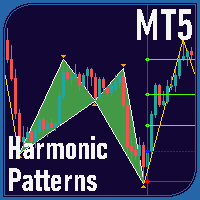
Overview Harmonic Patterns MT5 is a technical analysis indicator designed for the MetaTrader 5 platform. It identifies and displays harmonic price patterns, such as Butterfly, Cypher, Crab, Bat, Shark, and Gartley, in both bullish and bearish directions. The indicator calculates key price levels, including entry, stop loss, and three take-profit levels, to assist traders in analyzing market movements. Visual elements and customizable alerts enhance usability on the chart. Features Detects six ha
https://youtu.be/JJanqcNzLGM ,  https://youtu.be/l70MIHaQQa4 ,  https://youtu.be/pg0oiT5_8y0   Automated Supply and Demand Trading Edge MT5. These videos demonstrate how we apply the supply and demand system to our latest trading review and market analysis Enhance your Trading Strategy with the Supply and Demand Trading Edge MT5. Gain a competitive market advantage with the Supply and Demand Trading Edge MT5 indicator, a powerful tool that combines MACD signals with supply and demand zones. By
Trade smarter, not harder: Empower your trading with Harmonacci Patterns This is arguably the most complete harmonic price formation auto-recognition indicator you can find for the MetaTrader Platform. It detects 19 different patterns, takes fibonacci projections as seriously as you do, displays the Potential Reversal Zone (PRZ) and finds suitable stop-loss and take-profit levels. [ Installation Guide | Update Guide | Troubleshooting | FAQ | All Products  ] It detects 19 different harmonic pric
RSI Divergence Risk Target Signals RSI Divergence Risk Target Signals is a MetaTrader 5 indicator that detects confirmed bullish and bearish RSI divergence and combines the signals with optional trend filters, ATR-based Stop Loss levels, three Take Profit targets, alerts and an internal trade statistics dashboard. The indicator compares confirmed RSI pivot structure with corresponding price highs and lows. It is designed to help traders identify momentum divergence while providing a structure
Supply and Demand DE inspired EA Professional Supply & Demand Zone Trading System with Multi-Timeframe Confirmation Overview This advanced Expert Advisor automatically identifies and trades high-probability Supply and Demand zones using institutional trading principles. The EA combines classical supply/demand zone detection with modern confirmation filters including Break of Structure (BoS), Fair Value Gaps (FVG), and higher timeframe validation. 5m chart Setfile link: https://drive.google.com/
FREE
Apollo SR Master est un indicateur de support/résistance doté de fonctionnalités spéciales qui simplifient et fiabilisent le trading basé sur les zones de support/résistance. Cet indicateur calcule ces zones en temps réel, sans aucun décalage, en détectant les sommets et les creux locaux des prix. Pour confirmer la nouvelle zone de support/résistance, il affiche un signal spécifique indiquant que cette zone peut être prise en compte et utilisée comme un véritable signal d'achat ou de vente. Dans
CyberTradeTHxAI Gold Sniper MT5 Professional Gold Trading Signal Indicator for MetaTrader 5 CyberTradeTHxAI Gold Sniper MT5 is a professional-grade Gold (XAUUSD) trading indicator developed to identify high-probability Buy and Sell opportunities using trend analysis, pullback confirmation, and intelligent market structure detection. Designed for both beginner and advanced traders, the indicator automatically calculates optimal Entry Zones, Stop Loss, and multiple Take Profit levels while provid
Advanced MT5 Indicator: Precision-Powered with Pivot Points, MAs & Multi-Timeframe Logic Unlock the full potential of your trading strategy with this precision-engineered MetaTrader 5 indicator —an advanced tool that intelligently blends Pivot Points , Adaptive Moving Averages , and Multi-Timeframe Analysis to generate real-time Buy and Sell signals with high accuracy.    If you want to test on Real Market, Let me know. I will give the Demo file to run on Real Account.    Whether you're a scal
Trend and Signals MT5  indicator scans  30 trading Instruments (Forex, Metals and Indices).     It uses special algorithm on the  current market   based on   Pure Price Action   and display the overall trend and signal on the dashboard. When signals are produced the indicator sends alert and notification. Strategy for Signals This indicator uses the daily timeframe to determine the direction of the trend. The hourly timeframe is used to identify possible entries. Main trend and is determined by
GoldLab MACD Ribbon
Worapong Longwong
Trend pullback EA for XAUUSD: 8/13/21/34/55 EMA ribbon alignment + MACD histogram turn after a pullback. Exits when the ribbon disorders. GoldLab MACD Ribbon is an Expert Advisor that combines an EMA ribbon with the MACD histogram to join established trends after a pullback. It was designed for XAUUSD (Gold) and also runs on forex pairs and other CFDs. Every trade has a stop-loss. How it trades Trend: the EMA ribbon (8, 13, 21, 34, 55) must be fully aligned - every faster EMA above the slower on
Le niveau Premium est un indicateur unique avec une précision de plus de 80 % des prédictions correctes ! Cet indicateur a été testé par les meilleurs Trading Specialists depuis plus de deux mois ! L'indicateur de l'auteur que vous ne trouverez nulle part ailleurs ! À partir des captures d'écran, vous pouvez constater par vous-même la précision de cet outil ! 1 est idéal pour le trading d'options binaires avec un délai d'expiration de 1 bougie. 2 fonctionne sur toutes les paires de devises
Alien Hunter
Tebogo Kgamake Jerry Letsoalo
Short description A confirmed trend-change alerts and an ATR-based take-profit level. H1 is the recommended timeframe. ## Full description Alien Hunter displays a Trend line and identifies the latest confirmed change in trend. It can be used on any chart timeframe; H1 is the recommended timeframe. A signal is confirmed after the candle closes. The indicator draws an entry level and a take-profit level at a configurable multiple of ATR from the entry price. The default distance is 4.5 ATR. A
Introducing the Power Trade Plus indicator designed by a small group of traders with a few years of experience trading the market profitably.  The Power Trade Plus is derived from the Power Trade indicator,  the indicator strive in powerful sniper entries and take profit levels,  with an algorithm that's can determine the markets volatility and Provides entries based on the current market volatility. This indicator is much more effective in stock ,currencies and indices.
Chart Pattern MT5
Young Ho Seo
5 (1)
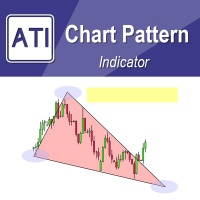
Introduction to Chart Pattern MT Chart Pattern MT is a chart pattern scanner to detect the triangle pattern, falling wedge pattern, rising wedge pattern, channel pattern and so on. Chart Pattern MT uses highly sophisticated chart pattern detection algorithm. However, we have designed it in the easy to use with intuitive user interface. Chart Pattern MT will show all the patterns in your chart in the most efficient format for your trading. You do not have to do tedious manual pattern detection an

Rainbow EA MT5
Jamal El Alama
Description : Rainbow EA MT5 is a simple Expert advisor based on   Rainbow MT5 indicator witch is based on Moving average with period 34. The indicator is incorporated in the EA, therefore, it is not required for the EA to operate, but if you wish, you can download it from   my product page . The Expert Advisor settings are as follows : Suitable for Timeframes up to H1 The parameters below can be set according to your trading rules. StopLoss ( Stop Loss in pips) TakeProfit ( Take Profit in pips
HAS RSI Signal — Indicateur de Tendance Professionnel avec Calcul SL/TP HAS RSI Signal est un outil de trading puissant combinant des classiques éprouvés et des algorithmes modernes de filtrage du bruit. L'indicateur analyse le marché à travers le prisme des bougies Heiken Ashi Smoothed (HAS) et de l'oscillateur RSI , offrant au trader des signaux d'entrée clairs lors des retournements de tendance ou des sorties de zones de surachat/survente. Principaux Avantages : Double Filtrage : L'utilisatio
Structure King AI Signal Structure King AI Signal is a professional MetaTrader 5 trading indicator designed to help traders analyze market structure, trend direction, multi-timeframe confirmation and trade management from one clean dashboard. Key Features • Market Structure & Trend Analysis • BUY / SELL Signals • Multi-Timeframe (HTF) Confirmation • Entry Price Levels • Dynamic Stop Loss (SL) • TP1 / TP2 / TP3 Levels • ATR Volatility Analysis • ADX Trend Strength Filter • Adaptive Market Filter
SmartPullback
Samuel Jesus Fidalgo Lopez
Smart Pullback Pro v4 High-Probability Pullback Indicator for MT5 Smart Pullback Pro v4 is a professional trend-following indicator for MetaTrader 5 that identifies high-probability pullback entries in real time. It automatically plots entry zones, Stop Loss, and Take Profit levels directly on the chart, giving traders a complete visual trading plan with every signal. How It Works Smart Pullback Pro v4 combines multiple confluence filters to eliminate low-quality signals and focus only on va
TradeForge AlphaGain AI
Akshay Chunilal Patil
AlphaGain AI – Précision de niveau expert avec IA nouvelle génération AlphaGain AI est un Expert Advisor (EA) haut de gamme pour MetaTrader 5, alimenté par l’intelligence artificielle et plus de 10 ans de données historiques pour des signaux fiables et une gestion des risques avancée. Caractéristiques principales : Noyau IA : détecte les figures de chandeliers, zones de volatilité et impulsion du marché ; Entraîné sur 10+ années de données ; Stratégie intelligente d’entrée/sortie : SL/T
Prices move for many reasons and these can vary from one operator to another: software, private and institutional traders simultaneously contribute to the formation of the price, making predictive art very difficult. However, there are measurable factors that bind the price to an underlying trend in line with the physical reality that the financial asset represents: these are the macroeconomic indicators. Large investors use this information wisely to set their strategies. Understanding these m
Les acheteurs de ce produit ont également acheté
Boba Analysis Suite
Trade Ready Solutions LLC
5 (2)
Boba Analysis Suite Boba Analysis Suite est un indicateur d’analyse pour MetaTrader 5. Il réunit la structure du marché, les zones de prix pertinentes et le contexte général du marché dans une même vue graphique. Développé à partir de l’expérience pratique d’un trader et formateur en trading, il accompagne une démarche d’analyse structurée : évaluer la direction du marché, identifier les niveaux importants et analyser plusieurs unités de temps conjointement. Une analyse en contexte La significat
Azimuth Pro
Ottaviano De Cicco
5 (7)
Azimuth Pro V2: Synthetic Fractal Structure and Confirmed Entries for MT5 Overview Azimuth Pro is a multi-level swing structure indicator by Merkava Labs . Four nested swing layers, swing-anchored VWAP, ABC pattern detection, three-timeframe structural filtering, and closed-bar confirmed entries — one chart, one workflow from micro-swings to macro-cycles. This is not a blind signal product. It is a structure-first workflow for traders who care about location, context, and timing. 1. What Change
SQN Max indicator for MT5 by ITC
Renaud Herve Francois Candel
Sqn Max Indicator Sqn Max is an exclusive indicator to trade the market with high effectiveness. The indicator is based on price action, volatility and trend. This indicator is as simple as possible but not too simple. The indicator can generate alerts to ease the trading process. You don't have to stay all day in front of your screen. The indicator can be used with any class of assets and with any time frame. It is possible to achieve better results trading our list of selected assets. We achi
ScalpPoint
Temirlan Kdyrkhan
ScalpPoint is a powerful trading companion designed to generate high-probability entry signals with dynamic TP/SL/DP levels based on volatility. Built-in performance tracking shows win/loss stats, PP1/PP2 hits, and success rates — all updated live. Key Features: Buy/Sell signals with adaptive volatility bands Real-time TP/SL/DP levels based on ATR Built-in MA Filter with optional ATR/StdDev volatility Performance stats panel (Success, Profit/Loss, PP1/PP2) Alerts via popup, sound, push, or emai
ARIPoint
Temirlan Kdyrkhan
1 (4)
ARIPoint is a powerful trading companion designed to generate high-probability entry signals with dynamic TP/SL/DP levels based on volatility. Built-in performance tracking shows win/loss stats, PP1/PP2 hits, and success rates all updated live. Key Features: Buy/Sell signals with adaptive volatility bands Real-time TP/SL/DP levels based on ATR Built-in MA Filter with optional ATR/StdDev volatility Performance stats panel (Success, Profit/Loss, PP1/PP2) Alerts via popup, sound, push, or email Cu
Zain Gold Scalping
Ahmed Gamal Abdel Nasser Mohamed
A complete price-action analysis tool built around dual independent entry logic, each confirmed against a volatility band, combined with a configurable set of nine optional confirmation filters that let you shape exactly how conservative or aggressive the tool's signals behave. Core Strategy Two independent entry setups, each triggering only when price moves outside a dynamic volatility band — giving two distinct ways to spot potential reversal points, which can be used together or separately.
OrderFlow Absorption – Indicateur professionnel de delta et de signaux d’absorption pour MT5 Libérez la puissance de l’analyse réelle du flux d’ordres avec OrderFlow Absorption – l’indicateur ultime d’histogramme delta et de signaux d’absorption pour MetaTrader 5. Conçu pour les traders qui veulent comprendre ce qui se passe réellement derrière chaque mouvement de prix, cet outil révèle la pression d’achat/vente cachée et les événements d’absorption qui font bouger le marché. Fonctionnalités Vis
Orderflow Big Trade Révélez la pression cachée au cœur des bougies grâce aux cartes thermiques du Delta estimé Manquez-vous l'activité critique qui se déroule à l'intérieur des bougies japonaises classiques ? Orderflow Big Trade utilise des algorithmes avancés de pondération par la plage de prix et le cours de clôture pour estimer la pression d'achat et de vente sur des niveaux de prix regroupés. Au lieu de s'appuyer uniquement sur le volume brut, il transforme la dynamique du Price Action en
SMC Sniper Pro MT5
Jordan Steven R Machell
SMC Sniper Pro MT5 SMC Sniper Pro by QuantFlow Labs is a chart indicator for liquidity-based intraday analysis. It combines session ranges, tracked liquidity sweeps and three selectable entry models in one configurable workspace. It displays setup context and entry references; it does not open, manage or close trades. Three selectable entry models Model 1 - Inverse Fair Value Gap breakout: after an eligible liquidity sweep, the indicator waits for a confirmed close through the relevant fair valu
VTrende Pro
Andrii Diachenko
5 (1)
VTrende Pro - MTF indicator for trend trading with a display panel for MT5 *** Videos can be translated into any language using subtitles (video language - Russian) Although the signals of the VTrende Pro indicator can be used as signals of a full-fledged trading system, it is recommended to use them in conjunction with the Bill Williams TS. VTrende Pro is an extended version of the VTrende indicator. Difference between Pro version and VTrende: - Time zones - Signal V - signal 1-2 waves -    S
QNC Scalper
Yordiana Enggelina Seko
Here is a professional and engaging description for the Indikator QNC Scalper tool in English, tailored for traders and platforms: Indikator QNC Scalper Unlock precision trading in fast-paced markets with the Indikator QNC Scalper —an advanced technical analysis tool engineered specifically for scalpers and day traders. Whether you are trading forex, crypto, or indices, this indicator cuts through market noise to deliver clear, high-probability entry and exit signals. Key Features Real-Time M
TrendMaestro5
Stefano Frisetti
note: this indicator is for METATRADER4, if you want the version for METATRADER5 this is the link:  https://www.mql5.com/it/market/product/108106 TRENDMAESTRO ver 2.5 TRENDMAESTRO recognizes a new TREND from the start, he never makes mistakes. The certainty of identifying a new TREND is priceless. DESCRIPTION TRENDMAESTRO identifies a new TREND in the bud, this indicator examines the volatility, volumes and momentum to identify the moment in which there is an explosion of one or more of these da
OmniSync Projection
Antonio-alin Teculescu
5 (1)
Chronos Fractal Engine is an innovative price projection indicator for MetaTrader 5, designed to transform your technical analysis by intelligently identifying and projecting historical price patterns. Built upon an advanced correlation algorithm and the fractal principles of the market, this powerful tool visualizes potential future price movements, giving you a unique edge in your trading decisions. What is Chronos Fractal Engine? At its core, the Chronos Fractal Engine employs a sophisticat
Title:FX-AIEA Supply and Demand Zone Indicator (MT5) — Technical Overview Version: 2.51 | Platform: MetaTrader 5 Introduction Supply and demand zones are considered a core manifestation of institutional order flow, providing a more direct reflection of buying and selling pressure than traditional support/resistance levels. This indicator attempts to automate the identification of high-probability supply and demand zones using an adaptive ZigZag algorithm, reducing the subjectivity and time asso
Zain Gold ScalpingV5
Ahmed Gamal Abdel Nasser Mohamed
Zain Gold Scalping V5 is a technical analysis indicator for MetaTrader 5 designed for Forex and Gold markets. It provides chart-based market information, trend analysis, signal conditions, and an on-screen dashboard to help traders analyze price movement across multiple timeframes. Main Features The indicator supports multiple timeframes, including M1, M5, M15, M30, H1 and higher timeframes. It can be used with Gold (XAUUSD), Forex currency pairs, indices and other supported instruments. The in
The indicator is designed to close positions on the market in time. For example: to take profits ahead of schedule if the price has not reached TakeProfit, and the market is turning around. The indicator analyzes the momentum, not the trend. He does not give any information about the trend. The indicator is well suited for finding divergence. The Ershov 38 Parrots indicator dynamically adjusts to the market and detects price movement impulses of medium and high amplitude. It almost does not rea
First time on MetaTrader, introducing IQ Star Lines, an original Vedic Astrology Based Intraday Trading Indicator. We don't offer free or bonus indicators in exchange of reviews from you. You won't need any free products with this indicator to make it work. ;) Enjoy! Welcome to the new and updated  IQ Star Lines , the ultimate fusion of ancient planetary cycles and modern quantitative trading, published for the first time on Metatrader. This is an indicator built by the developer, who has spent
AriX
Temirlan Kdyrkhan
1 (4)
AriX Indicator for MT5 A powerful trend-following and signal-evaluation tool AriX is a custom MT5 indicator that combines Moving Averages and ATR-based risk/reward logic to generate clear buy/sell signals. It visualizes dynamic SL/TP levels, evaluates past trade outcomes, and displays win/loss statistics in a clean on-chart panel. Key features include: Buy/Sell signals based on MA crossovers ATR-based SL/TP1/TP2/TP3 levels with visual lines and labels Signal outcome tracking with real-time stat
Meravith Scanner
Ivan Stefanov
5 (3)
MERAVITH SCANNER est un indicateur professionnel pour les marchés financiers sur MetaTrader 5, qui regroupe plusieurs outils d’analyse en un seul système intégré. Il effectue tous les calculs automatiquement en utilisant une méthodologie propriétaire de prix moyen pondéré par le volume (VWAP), éliminant ainsi toute interprétation subjective. Cet indicateur fonctionne sur toutes les classes d’actifs (Forex, actions, indices, matières premières, cryptomonnaies) et sur toutes les périodes, de M1 au
Boom & Crash & PainX & GainX Ultimate Spike Detector Trade Spikes With Confidence — Not Guesswork Catching spikes should be one of the most profitable strategies in synthetic markets. But for most traders, it becomes one of the most frustrating. You enter too early… price goes against you. You wait for a spike… it never comes. You finally catch one… but don’t know whether to hold or close. You make profit… then give it all back because there’s no exit plan. This is exactly the problem the Ultim
En bref Cet indicateur combine deux experts — le RSI et le MACD — en un seul système. Au lieu de regarder deux graphiques séparés et de faire des suppositions, il prend la décision pour vous : lorsque les deux indicateurs sont d'accord, il dessine une flèche (achat ou vente). Le plus important : les flèches ne sont pas repeintes . Une fois apparues, elles restent là où elles sont. Vous pouvez backtester et trader en direct en toute confiance. Que signifie "Combo" Normalement, un trader regarde l
Meravith MT5
Ivan Stefanov
5 (3)
MERAVITH est un indicateur de volume et de liquidité multi-unités de temps pour MetaTrader 5 qui montre la tendance, les zones de support et de résistance, l'entrée, les objectifs et le stop loss sur chaque unité de temps. Il vous donne une carte complète de la liquidité du marché, un outil de liquidité dans le style des hedge funds, et il fait tous les calculs automatiquement avec une méthode propre de prix moyen pondéré par le volume, donc il n'y a pas d'interprétation subjective. Fonctionne s
Cycles Plotter
Edoardo Centorame
Cycles Plotter Indicateur de Cycles Personnalisables avec Moyennes Mobiles et Date de Début Le Cycles Plotter est un indicateur technique avancé qui trace deux cycles sinusoïdaux entièrement personnalisables, uniquement sur input de l’utilisateur. Il ne génère pas de cycles automatiquement: tous les cycles sont calculés exclusivement en fonction des paramètres définis par l’utilisateur, offrant aux traders un outil visuel pour étudier les oscillations de prix et les changements potentiels de ten
Volume Arrow Signal Product Description Volume Arrow Signal is a smart trading indicator designed to help traders identify potential buy and sell opportunities using price action, volume behavior, and directional arrow signals. The indicator places clear arrows directly on the chart, making it easy to spot possible market reversals, trend continuations, and entry opportunities without spending hours analyzing charts manually. Whether you are trading Gold (XAUUSD) , Forex pairs, Indices, or Crypt
MasterTrend
Temirlan Kdyrkhan
MasterTrend Indicator for MT5 A powerful trend-following and signal-evaluation tool MasterTrend   is a custom MT5 indicator that combines Moving Averages and ATR-based risk/reward logic to generate clear buy/sell signals. It visualizes dynamic SL/TP levels, evaluates past trade outcomes, and displays win/loss statistics in a clean on-chart panel. Key features include: Buy/Sell signals based on MA crossovers ATR-based SL/TP1/TP2/TP3 levels with visual lines and labels Signal outcome tracking wit
SMC Sweep Fvg MT5
Daniil Sleptsov
5 (1)
SMC Sweep Fvg MT5 — voyez le marché comme le smart money, directement sur votre graphique Vous connaissez ce sentiment : le prix prend votre stop, se retourne et part exactement là où vous l’attendiez. Vous aviez raison sur la direction. Vous n’avez eu tort que sur l’entrée. Cet indicateur existe pour que cela arrive moins souvent. Il prend en charge la partie la plus lourde de l’analyse — le marquage du graphique — et vous laisse l’essentiel : la décision. Ce que vous voyez sur le graphique
Gold Xausd Hunter
Metin Erkamoglu
5 (2)
MATADOR GOLD XAUUSD M5 Scalp Signals for MT5 MATADOR GOLD is a decision-support indicator for MetaTrader 5, designed for traders who analyze short-term Gold movement on the M5 timeframe. The indicator does not open, close, or manage trades automatically. It provides buy and sell signal guidance so the user can make their own trading decisions according to their risk plan, broker conditions, and trade management rules. Main purpose MATADOR GOLD is built to help traders avoid noisy signal flow and
Footprint is an indicator for order flow and volume analysis. It helps identify market structure at the cluster level, find key zones with increased activity, and work with filters directly on the chart without constantly opening the settings window. Footprint Indicator Features cluster-based Bid x Ask and Delta charts; on-chart control panel; sliders for filter adjustments; Absorption; Initiative; Stacked Imbalances; Big Trades; dPOC / Dynamic Point of Control; Delta; side market profile; cumul
KenKem Master Volume Profiler - Brief Introduction A Display-only volume-profile cockpit for XAUUSD, BTCUSD and other liquid symbols. Draws profile structure, multi-timeframe flow, EMA trend and study-only setup markers. Places no orders. Not a signal service.  It maps where the market has actually traded and reads recent order flow, so you can see structure and lean at a glance.  What it shows: Master and local volume profiles (POC and value-area high/low) - the price shelves that matter. A liv
Plus de l'auteur
CGE Trade Desk
Carl Gustav Johan Ekstrom
5 (1)
Professional Trade Desk for MT5: Limit & Market Orders, Risk Control and Grid Bot CGE Trade Desk is a chart-driven order panel for MT5 traders on retail accounts or prop firm challenges. Plan the trade on the chart, size it from your risk, and let the desk protect your account from costly mistakes. Drag your entry, stop and take-profit lines on the chart, then click PLACE ORDER. The desk handles lot size, expiry and risk limits for you. Daily loss caps, profit targets, a daily lockout and a fail
FREE
Filtrer:
eman11
1844
eman11 2026.10.29 18:24 

Nice suite of trading tools, including some less common but powerful ones. Beyond that, what stands out is the seller's responsiveness and pride in his work. The product is constantly being updated with new features and useful ideas. Recommend.

Carl Gustav Johan Ekstrom
5273
Réponse du développeur Carl Gustav Johan Ekstrom 2026.10.29 18:35
Thanks! Really appreciate that. Glad the updates and responsiveness come through. I put a lot into keeping this moving and supporting people properly, so that means a lot.
tomgrovess
101
tomgrovess 2026.04.16 18:01 

The most professional indicator you will find. Its so much more, it is packed full of various ways to be profitable in markets. Each individual part of the CGE suit is amazing as a stand alone yet the suit allows you to combine and use them all with extreme smoothness. I will never use anything else and would one million percent advise anyone to take the trial and experience how elite the CGE trading suit really is. Your subscription or purchase will follow after, i guarantee it. Support is offered from the creator carl and he is a genuine, extremely helpful man.

Carl Gustav Johan Ekstrom
5273
Réponse du développeur Carl Gustav Johan Ekstrom 2026.10.14 12:18
Thank you for this outstanding review! Each module is built to stand strong on its own and work seamlessly with the rest, so it's great to hear that comes through in your trading. I truly appreciate your kind words about the support.

dannyloveridge
134
dannyloveridge 2026.01.11 09:57 

Unbelievable value for money, This is tool have everything a trader needs all in one place from the teachings of martin Armstrong a leading pioneer in the world of economics, Clean visible key levels making it evident on how they are truly respected, Capital flow index giving you the intermarket analysis necessary to position yourself in a high probability trend, MIDAS one of the most underrated and unheard custom formulars of VWAP to identify the average price willing to be paid within the current trend and a automatic supply and demand area highlighter showing you where big entity's was likely involved in the market giving you a insight for a potential area that if prices retraces to will give a reaction. This is a no fluff tool with real logic behind each aspect that any serious trader can use to there advantage

Carl Gustav Johan Ekstrom
5273
Réponse du développeur Carl Gustav Johan Ekstrom 2026.10.14 12:17
Thank you for taking the time to write such a detailed review. I'm pleased the depth and practical logic behind the CGE Trading Suite are making a difference in your trading. Every part of the suite is designed to deliver clear, reliable information directly on the chart, so you can make confident decisions with less noise.
Répondre à l'avis