Compare Graphs
- Indicadores
- Versión: 1.0
- Activaciones: 5

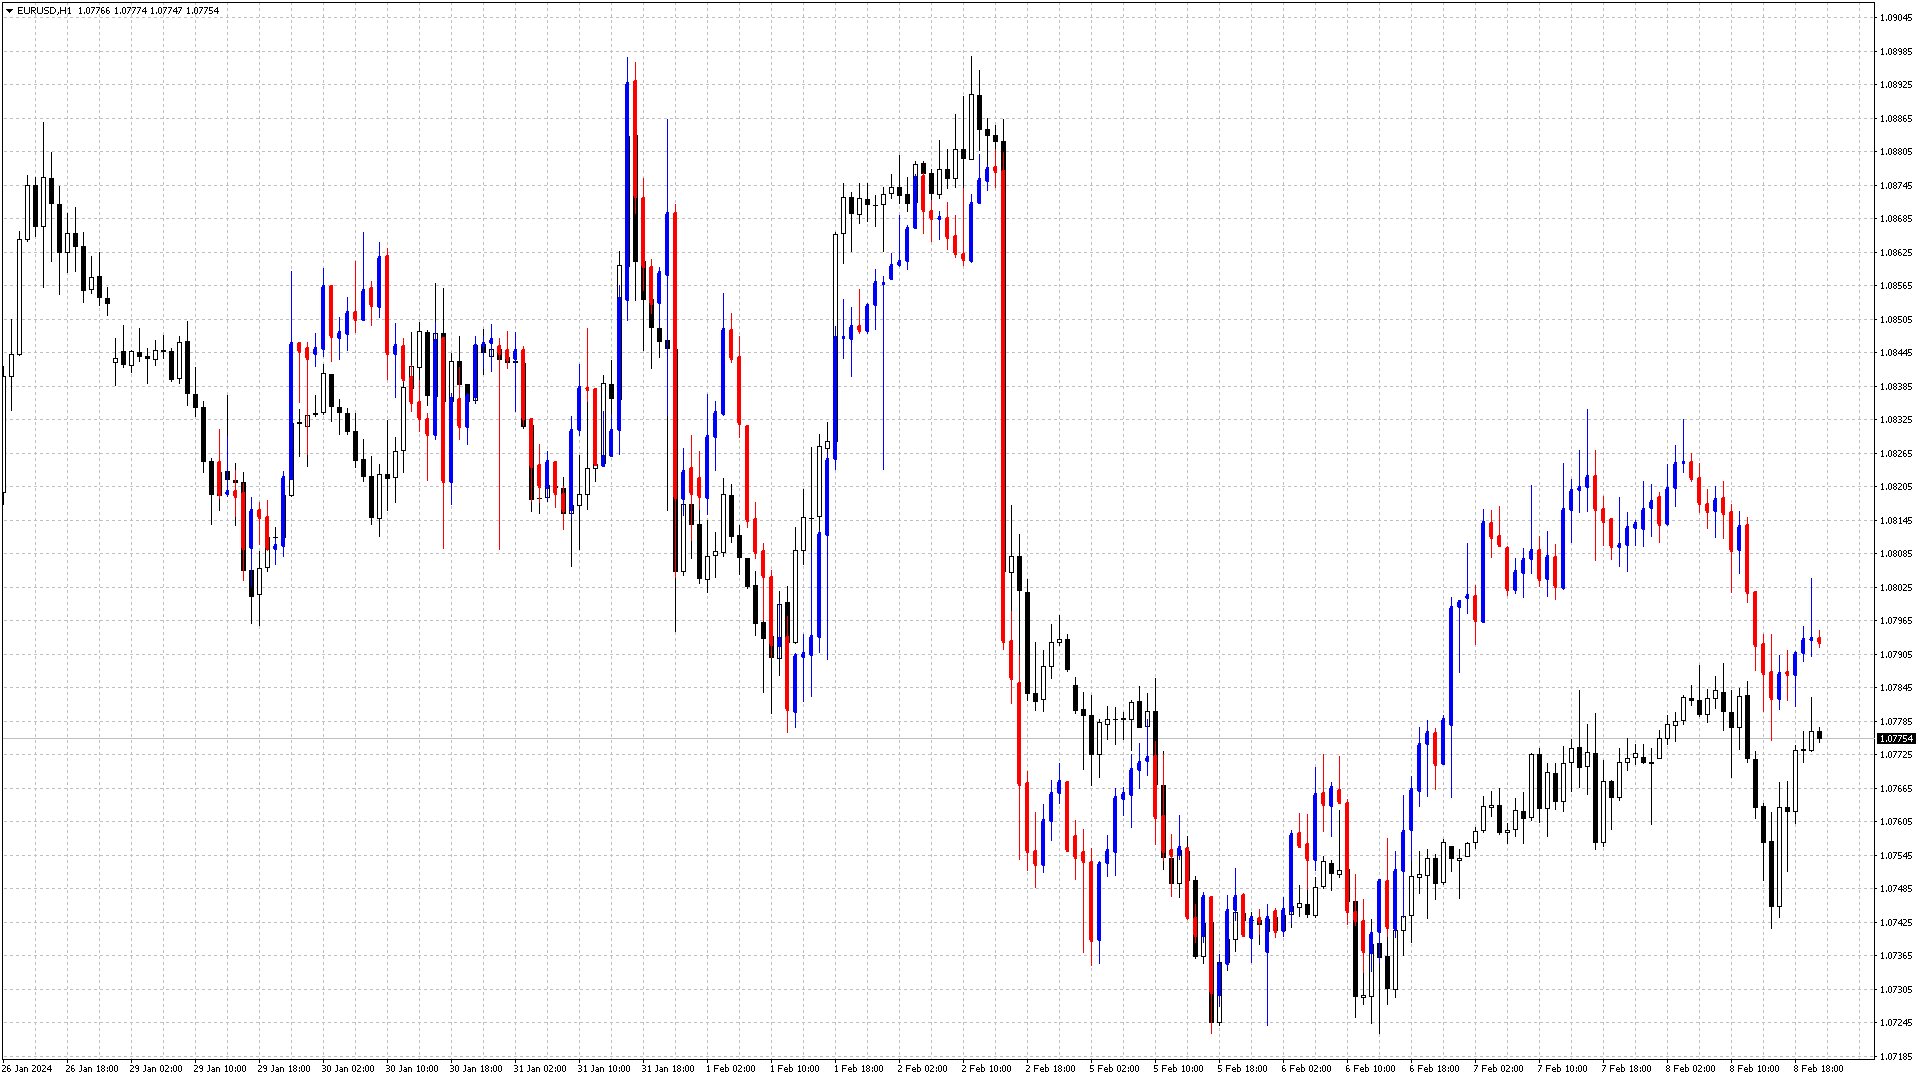
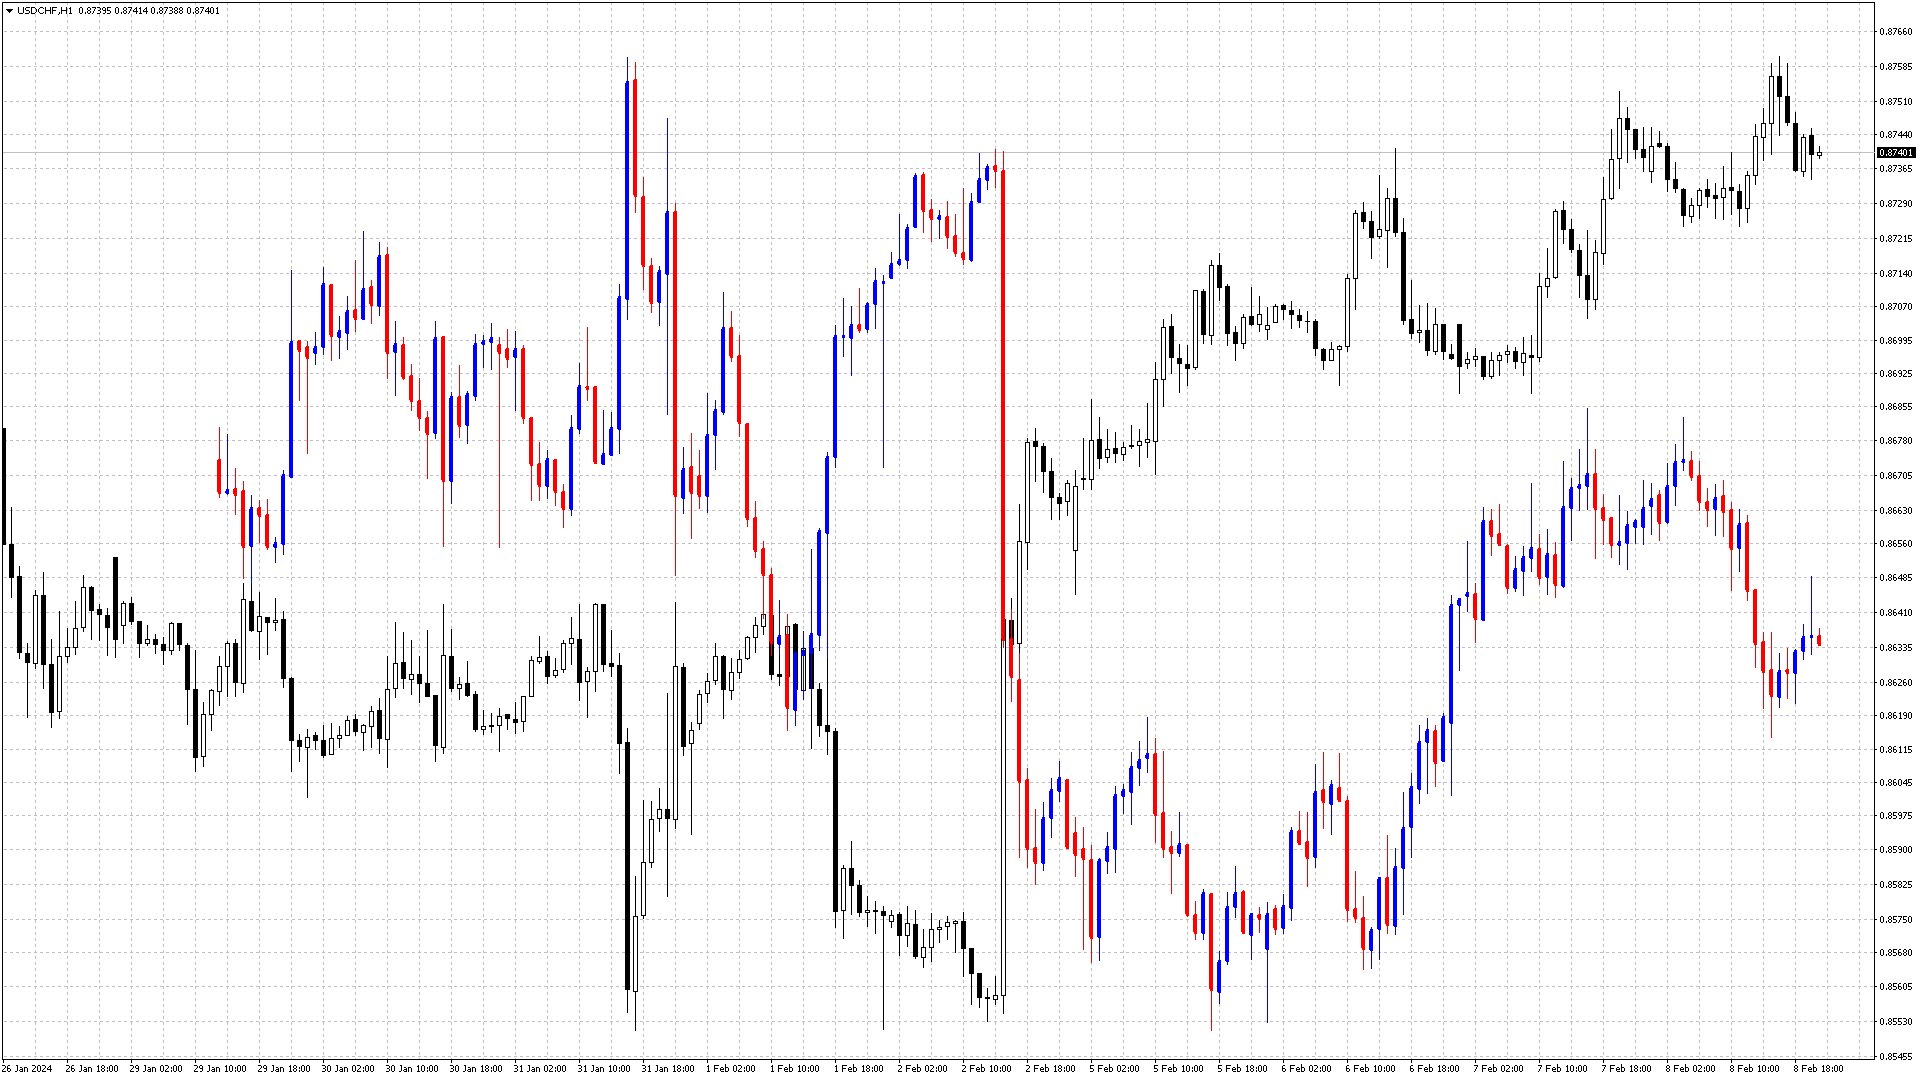
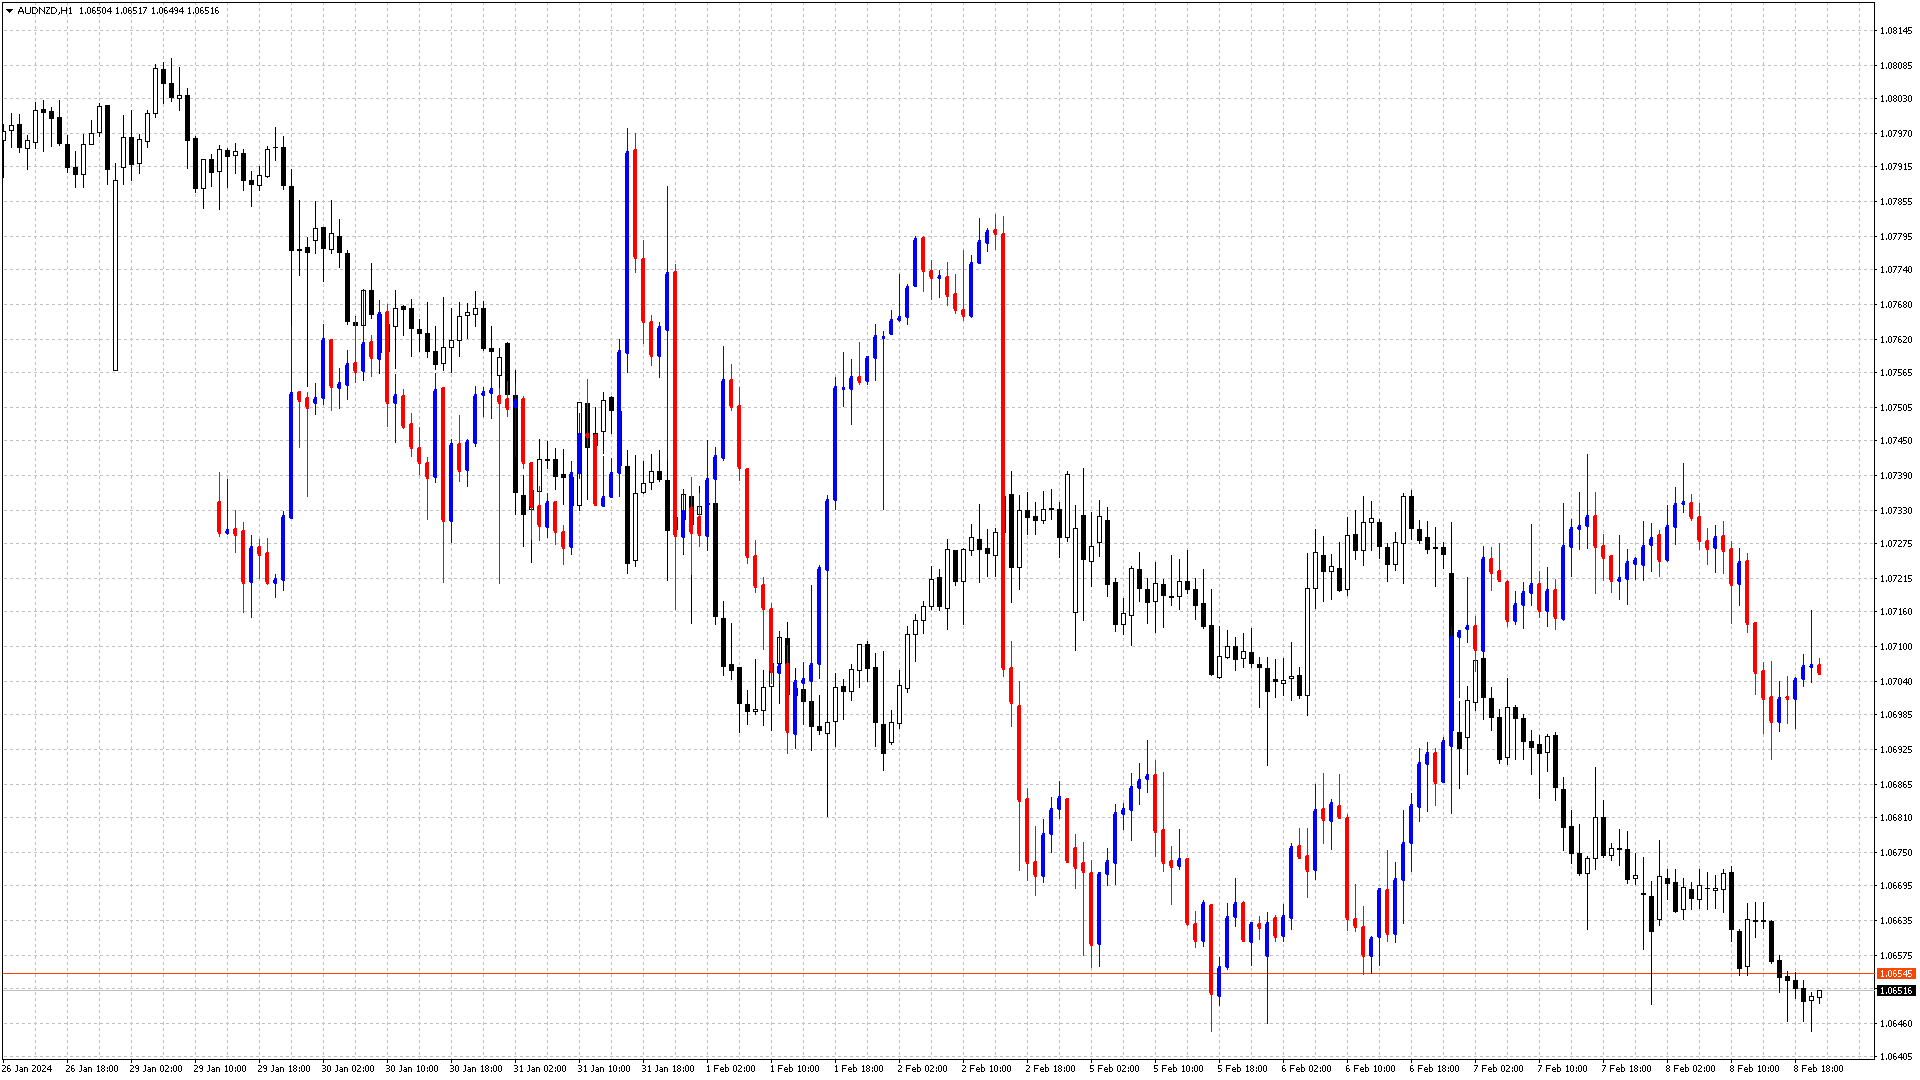
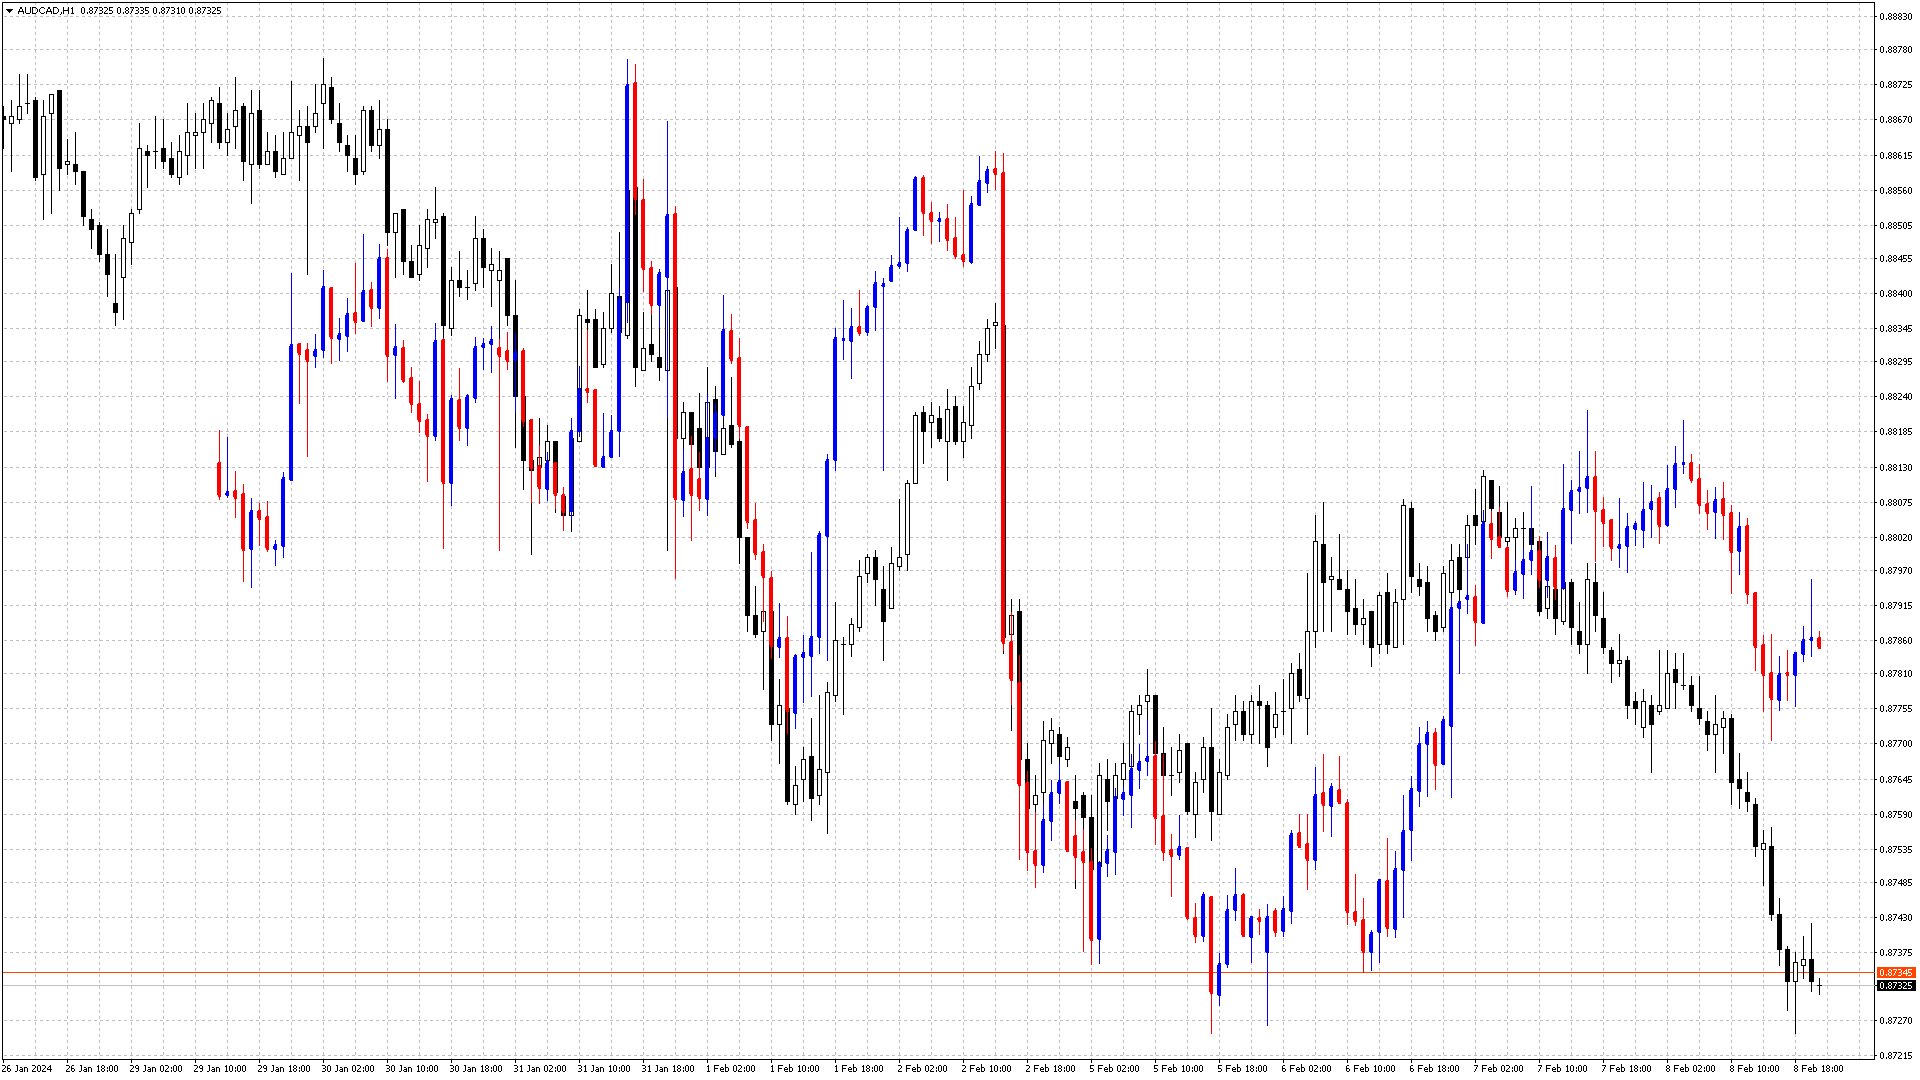
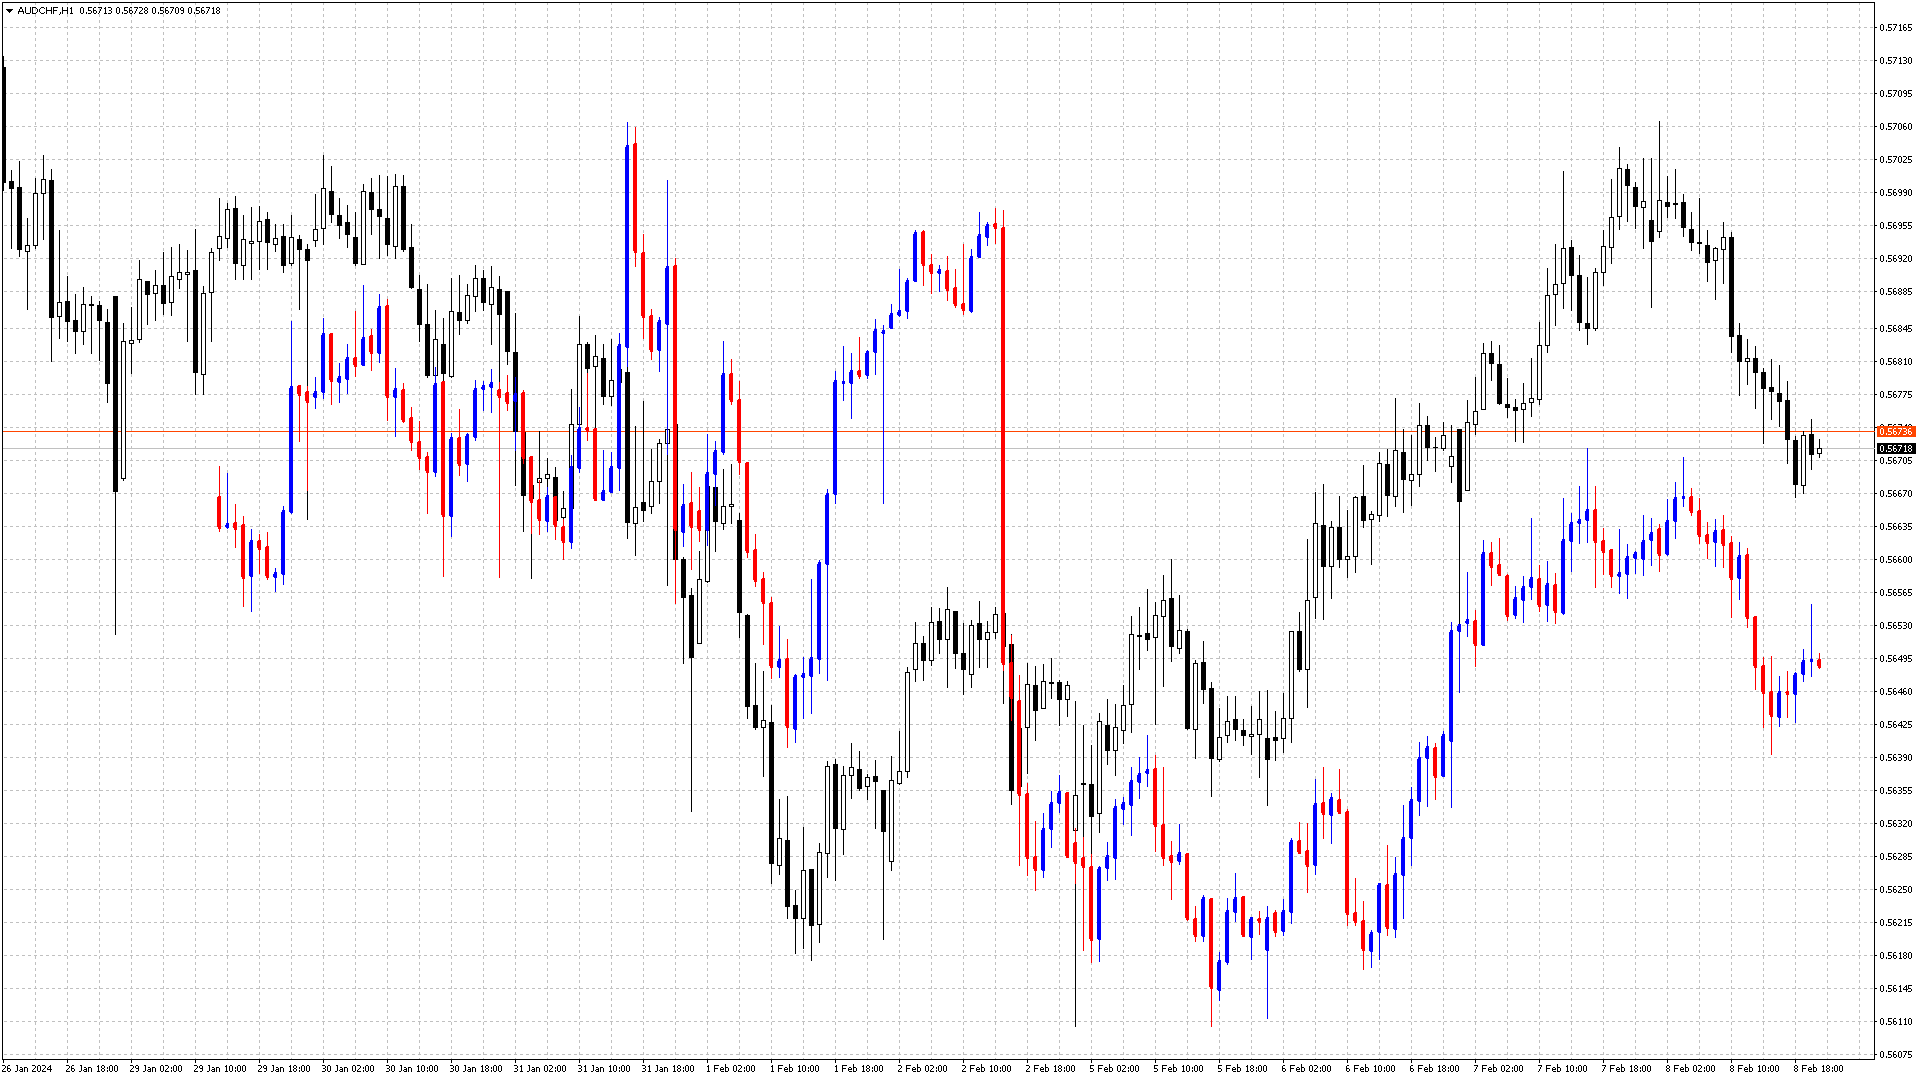
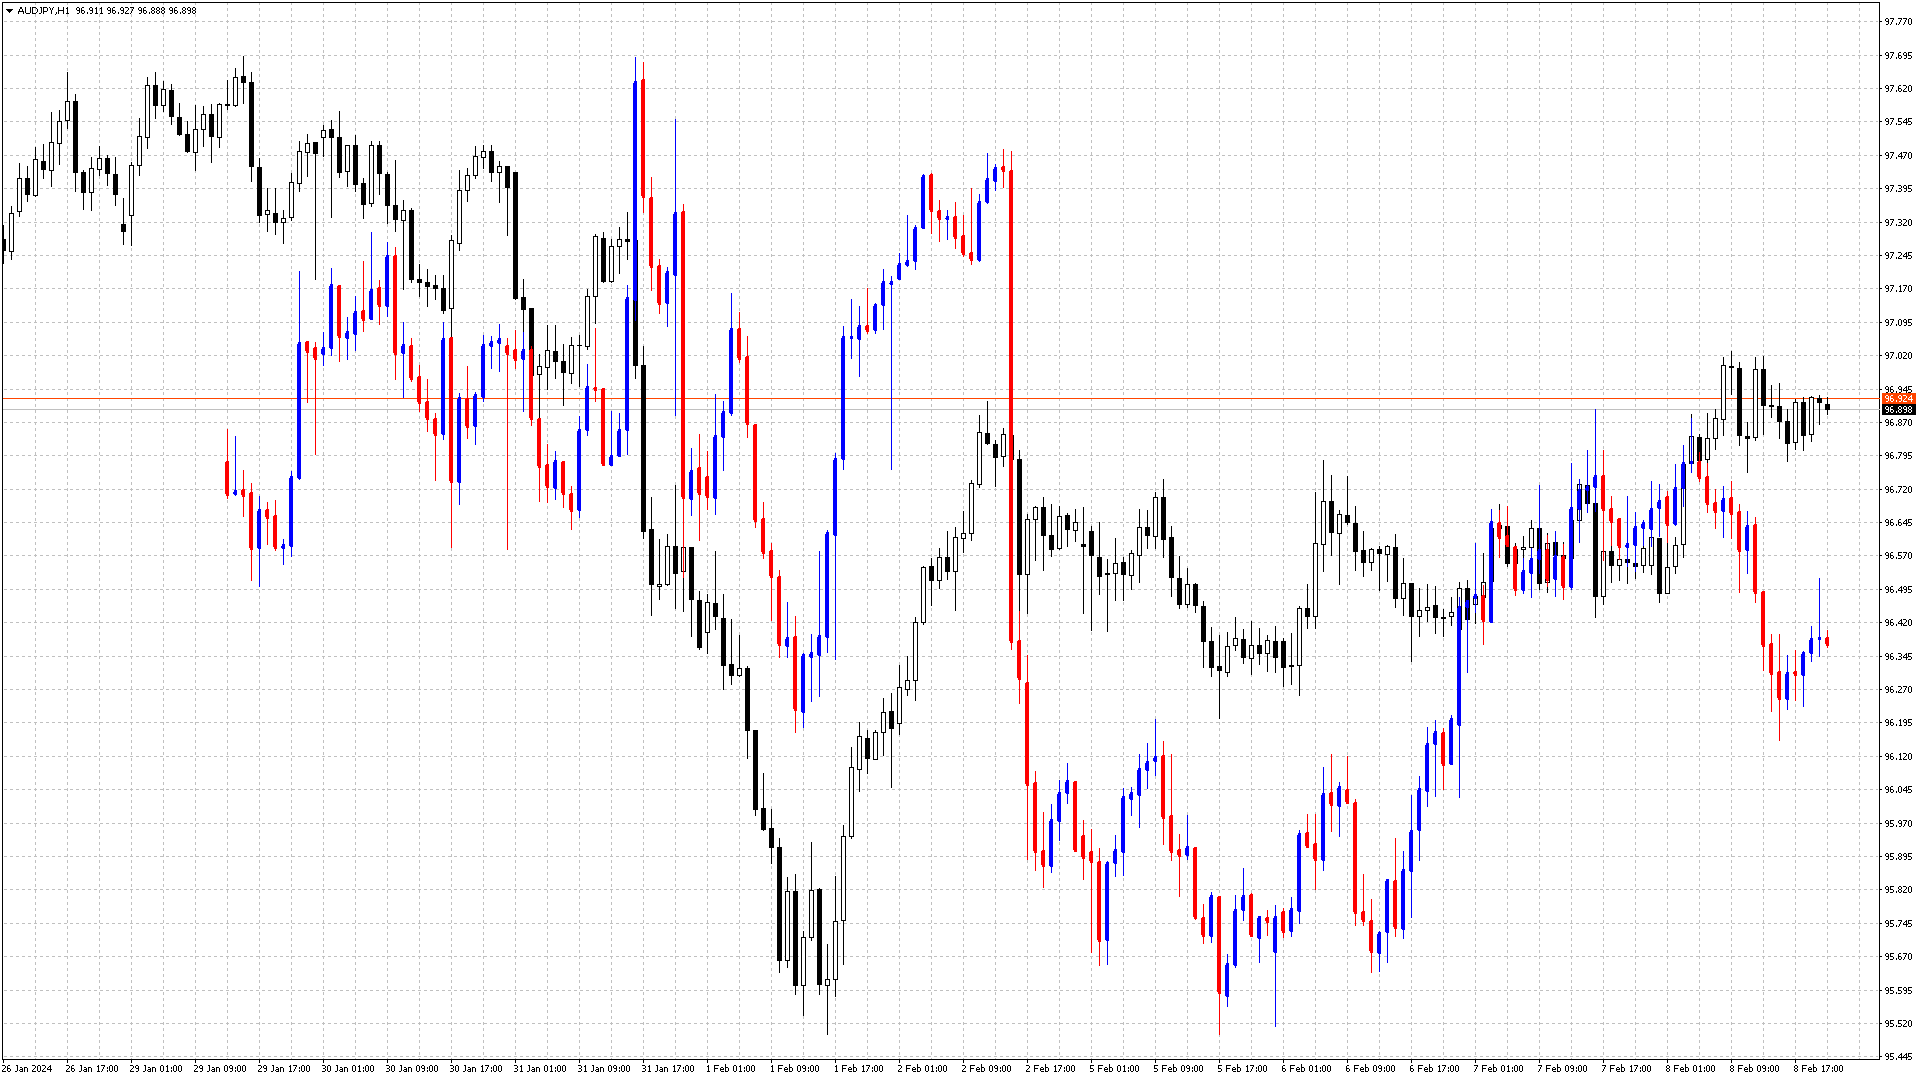
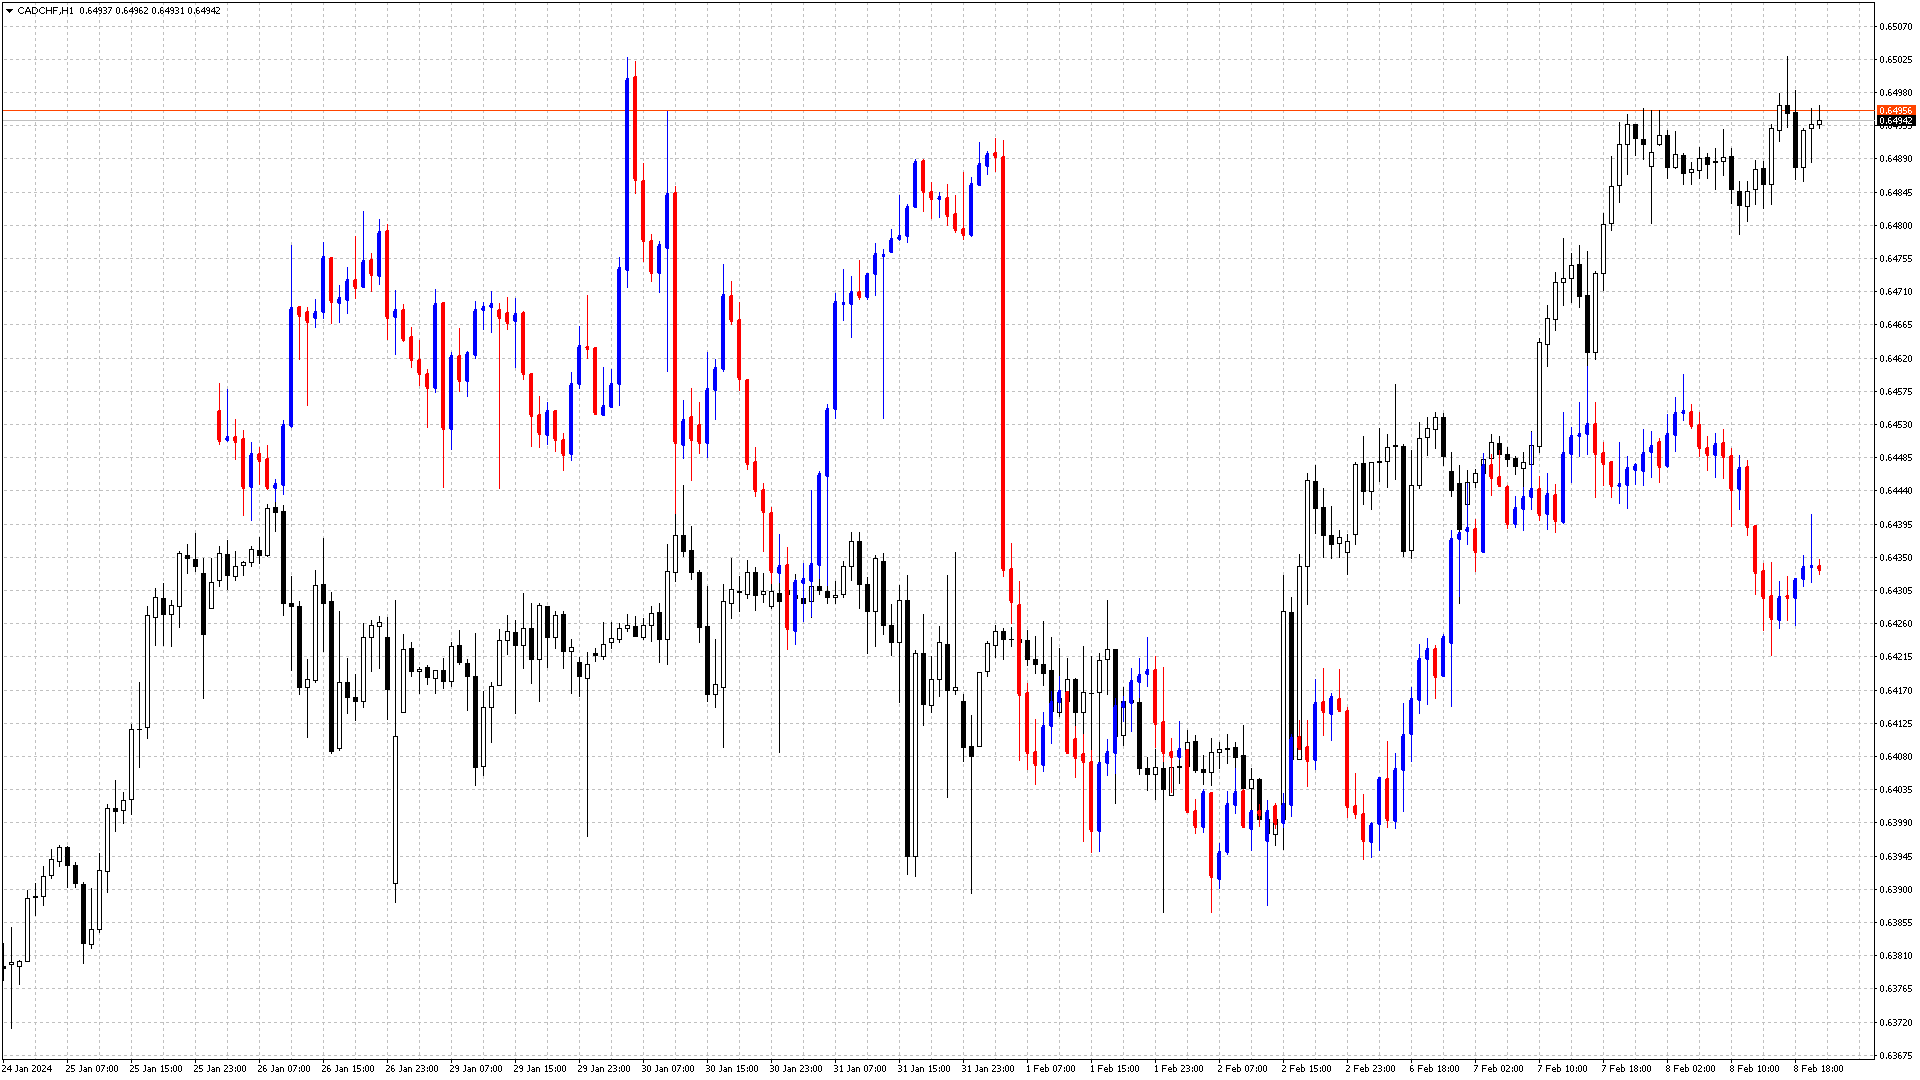
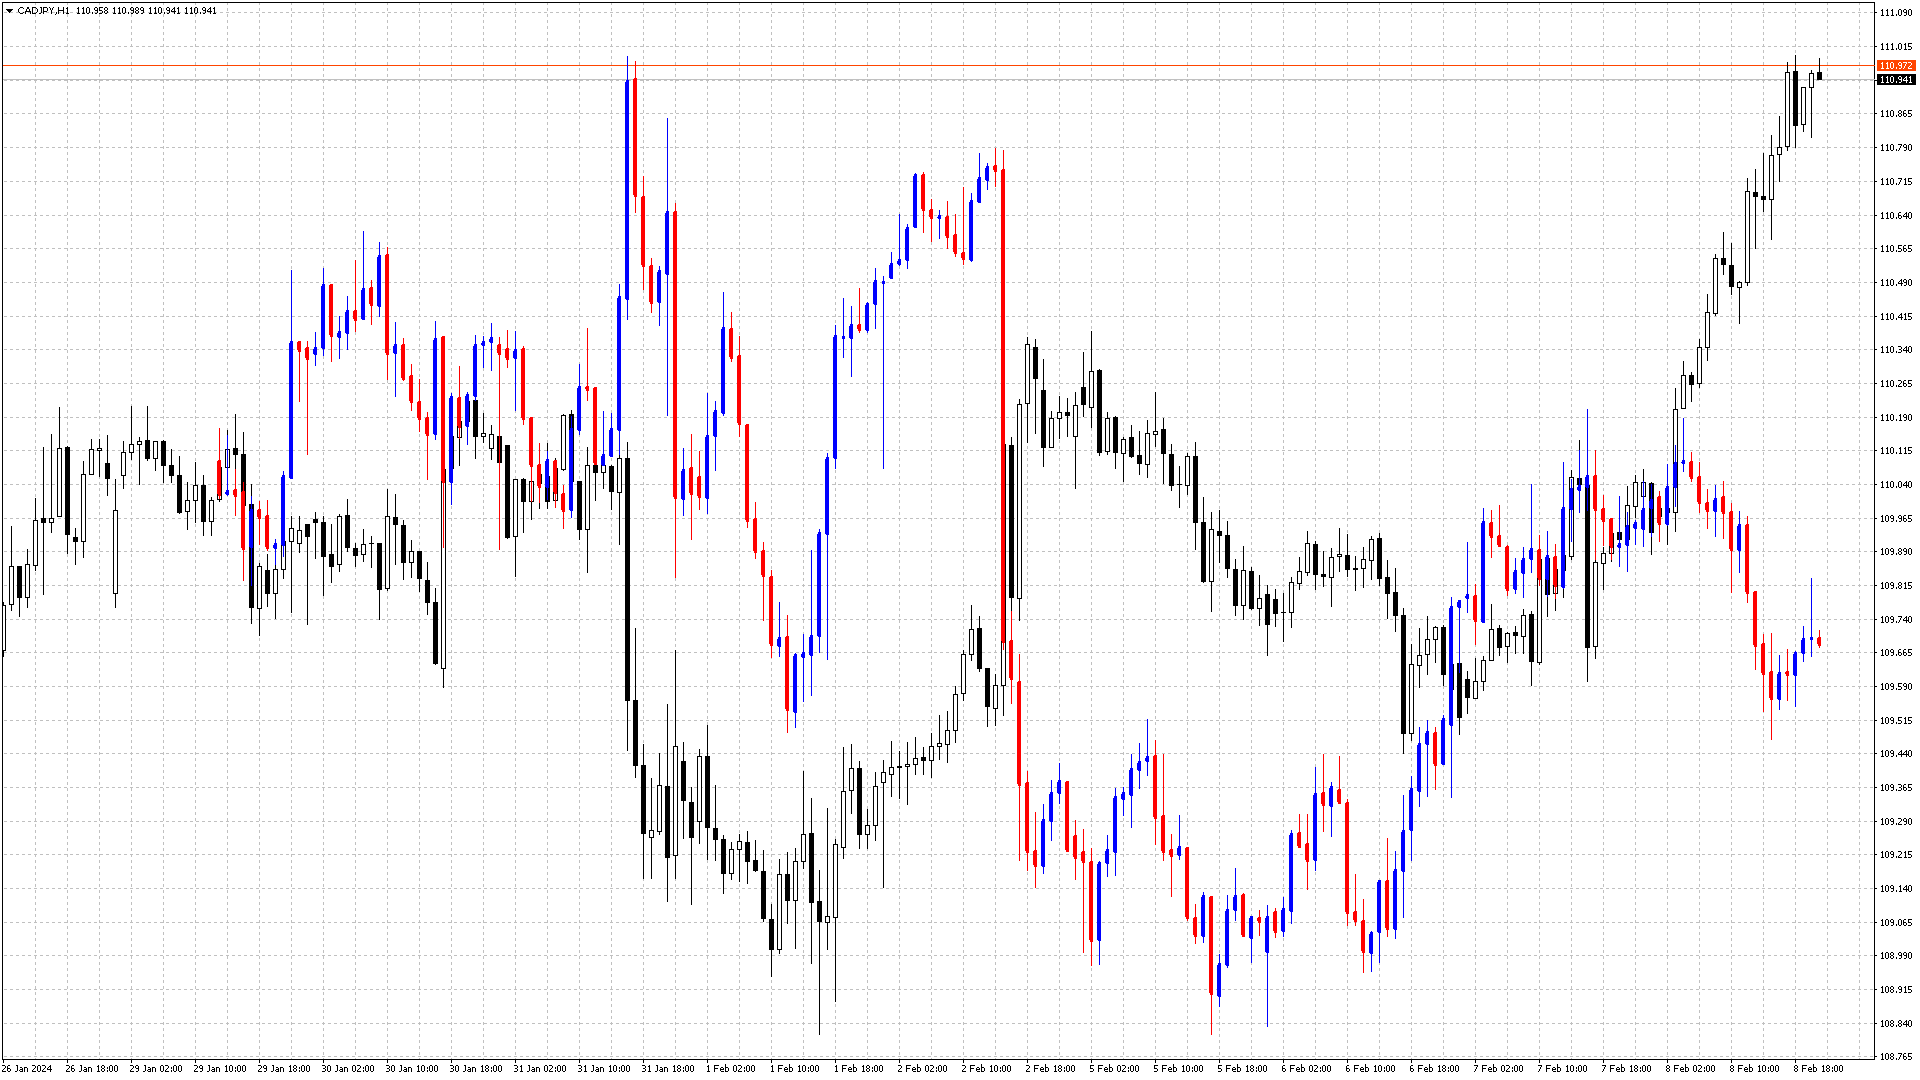
El indicador Comparar gráficos es una herramienta de análisis que permite a los operadores comparar dos o más gráficos en la misma ventana del gráfico. Este indicador se utiliza habitualmente en plataformas de negociación como MetaTrader y proporciona una comparación más clara de diferentes instrumentos financieros o marcos temporales.
Las funciones del indicador Comparar Gráficos pueden incluir:
- Seleccionar Gráficos: El operador puede seleccionar los gráficos que desea comparar, como gráficos de precios de diferentes pares de divisas o indicadores en el mismo gráfico.
- Ajustes: El indicador puede proporcionar varios ajustes para adaptarse a las necesidades del operador, como elegir colores, tipos de línea, etc.
- Análisis dinámico: Con este indicador, los operadores pueden analizar la dinámica de los cambios entre gráficos, identificando similitudes o diferencias en el movimiento del precio u otros indicadores.
- Zoom y movimiento: El indicador puede ofrecer opciones de zoom y movimiento de los gráficos para comparar mejor los datos.
El indicador Comparar Gráficos puede ser una herramienta útil para los operadores que desean realizar un análisis más profundo del mercado, comparando diferentes aspectos de la acción del precio u otros factores que afectan a la negociación. Comparar gráficos en el mercado Forex es una herramienta importante para el análisis y la toma de decisiones de los operadores. La comparación de gráficos ayuda a los operadores a tomar decisiones más informadas sobre la entrada de operaciones, la gestión del riesgo y la salida de posiciones en el mercado Forex.