ADX Dashboard MT5
- Indicadores
- Versión: 4.10
- Actualizado: 12 abril 2026
- Activaciones: 10

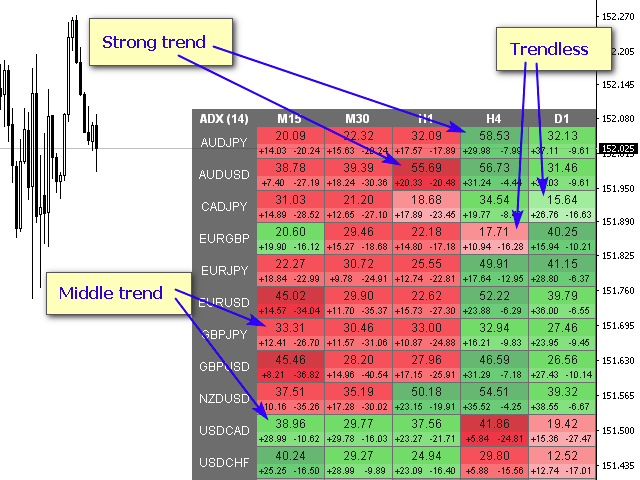
El indicador ADX se utiliza para determinar la tendencia y su fuerza. La dirección del precio se muestra mediante los valores +DI y -DI, y el valor ADX muestra la fuerza de la tendencia. Si +DI está por encima de -DI, entonces el mercado está en una tendencia alcista, si por el contrario, está en una tendencia bajista. Si ADX está por debajo de 20, entonces no hay una dirección definida. Tan pronto como el indicador supera este nivel, comienza una tendencia de fuerza media. Los valores superiores a 40 indican una tendencia fuerte (una tendencia bajista o alcista).
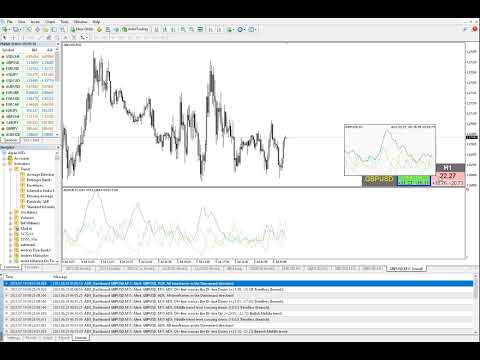
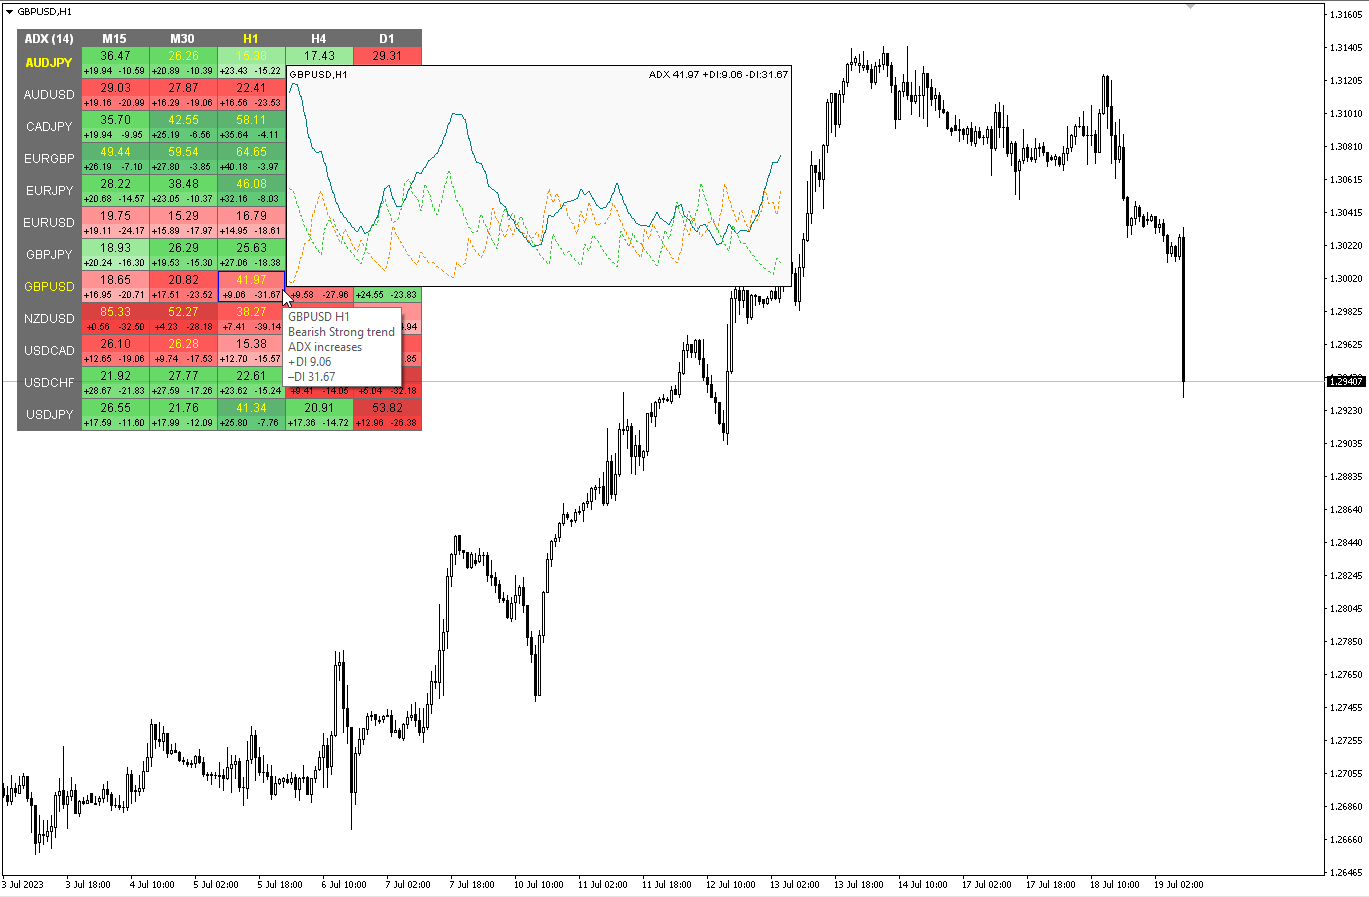
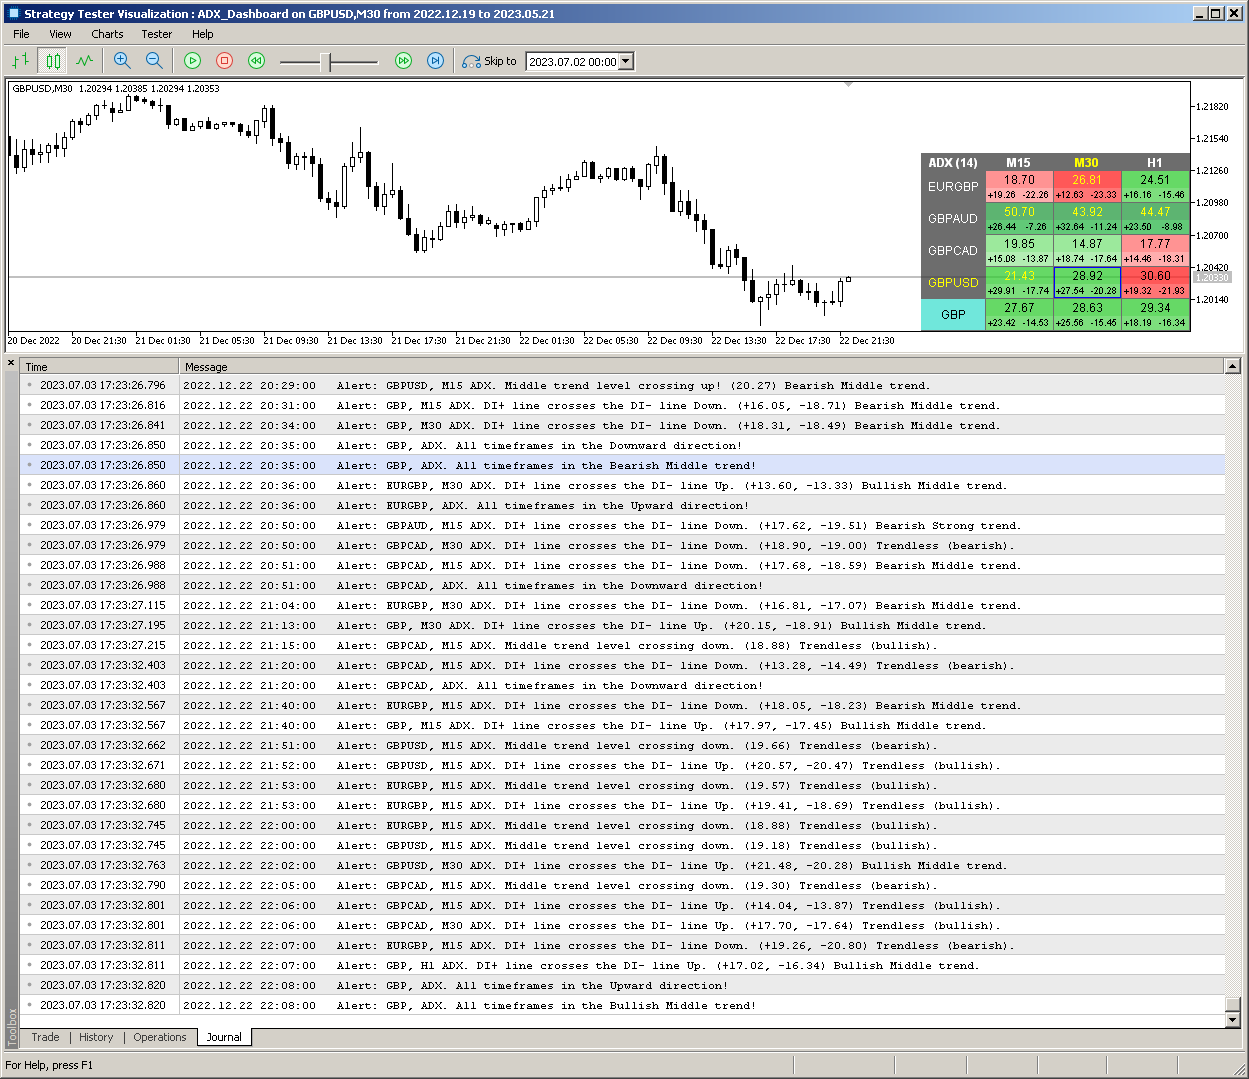
Modificación multidivisa y multitemporal del indicador Índice de movimiento direccional promedio (ADX). Puede especificar las monedas y plazos que desee en los parámetros. Además, el indicador puede enviar notificaciones cuando se cruzan los niveles de fuerza de la tendencia y cuando se cruzan las líneas +DI y -DI. Al hacer clic en una celda con un punto, se abrirá este símbolo y punto. Este es el escáner MTF.
De manera similar al medidor de fortaleza de la moneda, el Panel puede seleccionar automáticamente pares que contengan una moneda específica o aquellos pares que tengan esa moneda como moneda base. El indicador busca Moneda en todos los pares especificados en el “Conjunto de Pares”; otros pares se ignoran. Y en base a estos pares, se calcula el ADX total para esta moneda. Y puedes ver cuán fuerte o débil es esa moneda.
La clave para ocultar el panel del gráfico es "D" de forma predeterminada
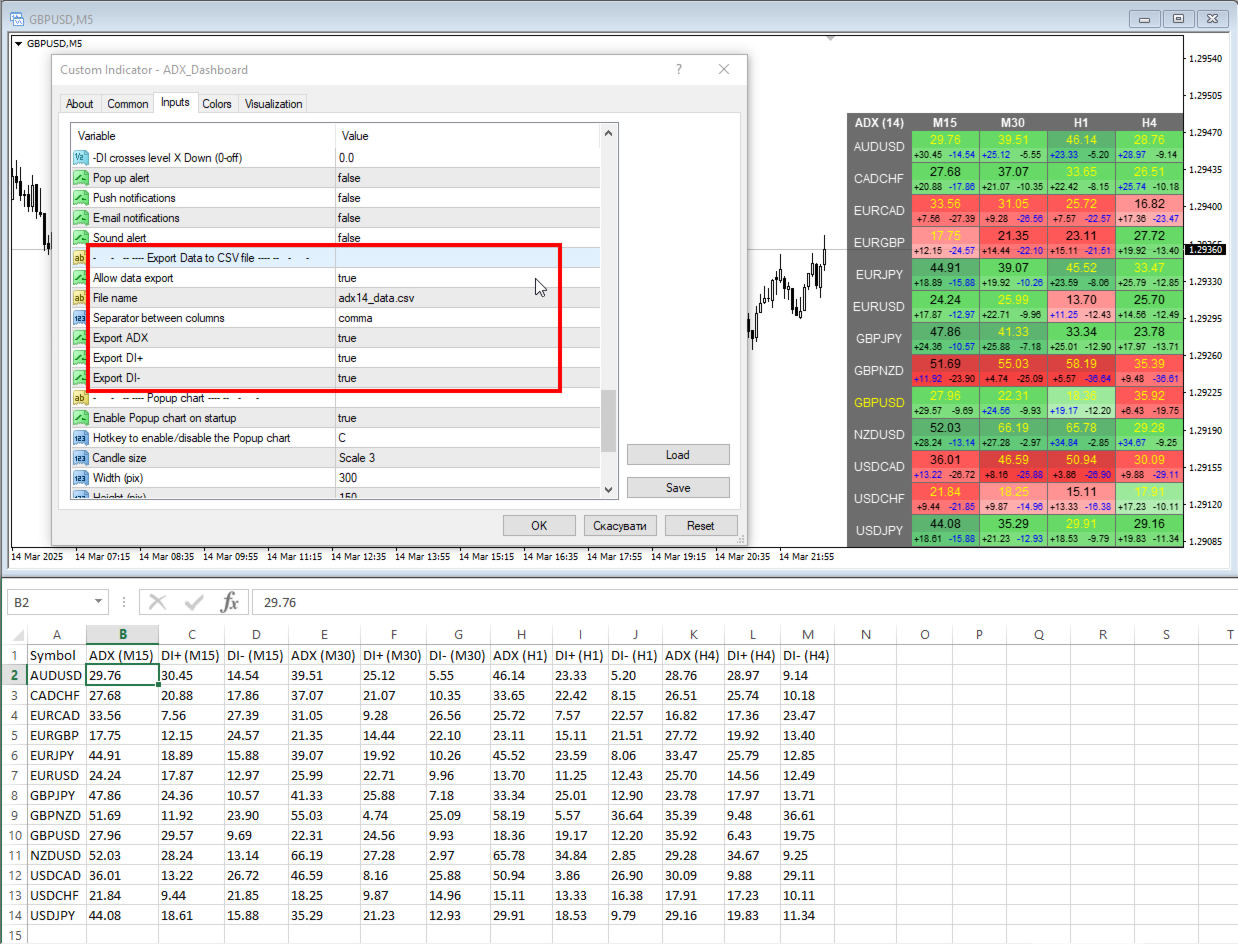
Puede exportar datos del panel de ADX a un archivo CSV. El archivo se guardará en la carpeta de la terminal: \MQL5\Files.
Los datos se registrarán según el temporizador: "Actualizar el panel cada (segundos)".
Para actualizar el archivo guardado al abrirlo en Excel, debe abrirlo en la pestaña "Datos" - "Obtener datos externos del texto". El panel y Excel actualizarán el archivo.
Parámetros
ADX Period - período de promediación.
ADX Applied Price - tipo de precio.
Clear the chart at startup - borre el gráfico al inicio
Set of Pairs - conjunto de símbolos:
— Market Watch — Pares del "Market Watch" del MT.— Specified manually - pares especificados manualmente, en los parámetros "Pares".— Current pair - muestra solo el par actual.
Pairs (separated by a space or semicolon) - lista de símbolos separados por espacios o punto y coma. Los nombres de las monedas deben escribirse exactamente igual que los del bróker, manteniendo las mayúsculas y minúsculas y el prefijo/sufijo.
Time Frames (separated by a space or semicolon) - lista de períodos de tiempo separados por espacios o punto y coma (marcos de tiempo múltiples).
Sort pairs - ordenar la lista de pares.
Position on chart - esquina para mostrar el panel en el gráfico.
X offset (pix) - desplaza el panel a lo largo del eje X.
Y offset (pix) - desplaza el panel a lo largo del eje Y.
Allow to move the table manually - permite mover la mesa con el mouse.
Refresh dashboard every (seconds) - período de actualización para todos los pares y períodos de tiempo.
Refresh cells only on new bar - las actualizaciones de celda (y alertas) solo se producirán cuando aparezca una nueva barra.
Open the pair in a new window - abra un símbolo en una nueva ventana del gráfico haciendo clic.
Chart template - el nombre de la plantilla del gráfico, si el gráfico se abre en una ventana nueva.
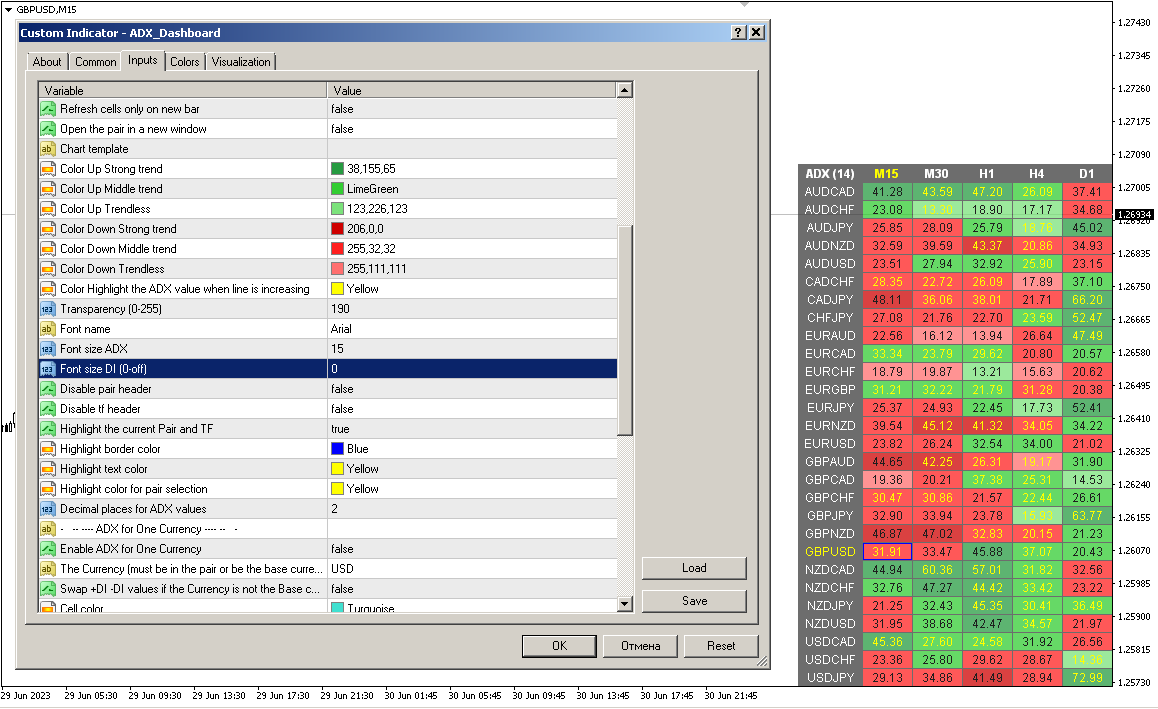
Configuraciones de color
Color Up Strong trend - color de celda si hay una tendencia fuerte.
Color Up Middle trend - color de celda, si es la tendencia media.
Color Up Trendless - color de celda si no hay tendencia.
Color Down Strong trend - color de celda si hay una tendencia fuerte.
Color Down Middle trend - color de celda, si es la tendencia promedio.
Color Down Trendless - color de celda si no hay tendencia.
Transparency (0-255) — transparencia del panel.
Font name - Nombre de la fuente.
Font size ADX - Tamaño de fuente ADX.
Font size DI (0-off) - Tamaño de fuente DI (0-apagado).
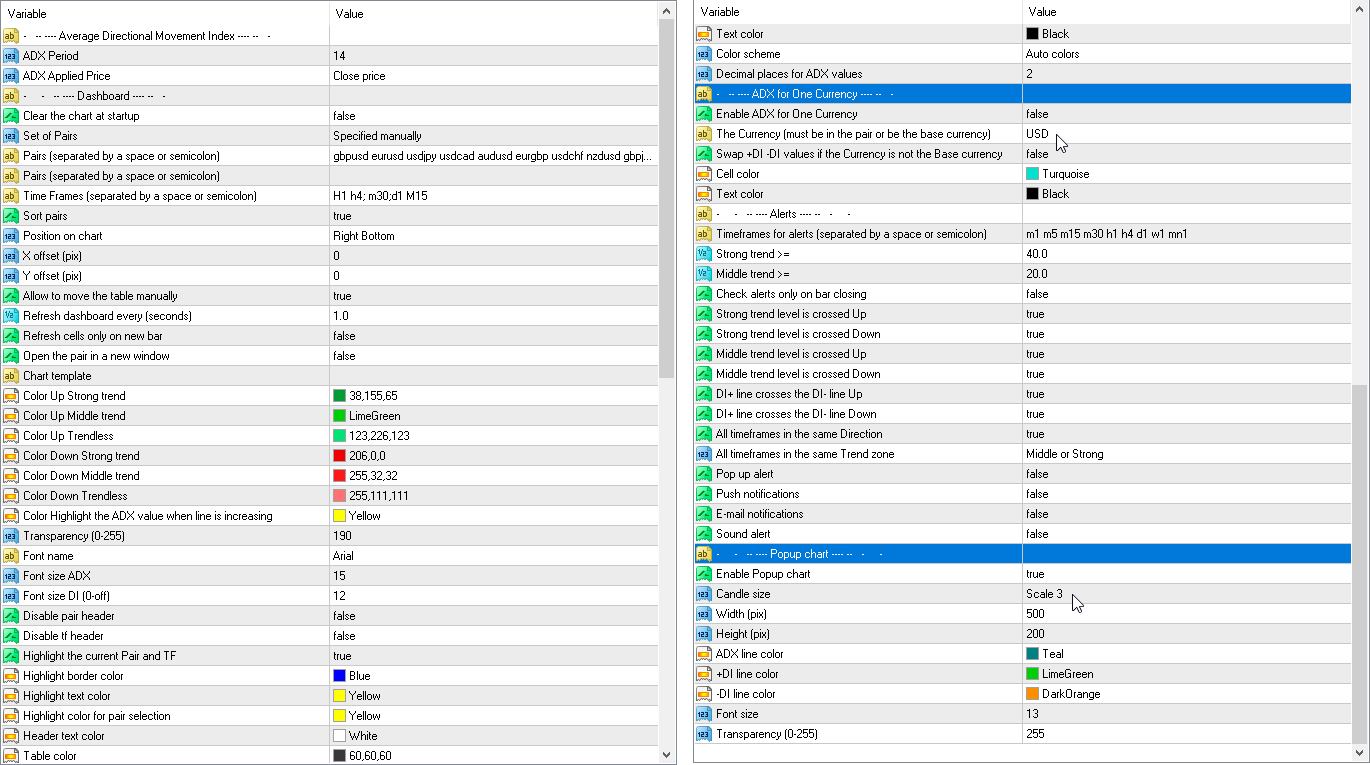
Alertas
Timeframes for alerts (separated by a space or semicolon) - lista de períodos durante los cuales se enviará la alerta (separados por un espacio o punto y coma).
Strong trend >= — el nivel de una tendencia fuerte
Middle trend >= — el nivel de la tendencia media.
Check alerts only on bar closing - verifique el paso a nivel solo después del cierre de la barra.
Strong trend level is crossed Up - alerta cuando ADX cruza el nivel de una tendencia fuerte hacia arriba.
Strong trend level is crossed Down - alerta cuando ADX cruza el nivel de una tendencia fuerte hacia abajo.
Middle trend level is crossed Up - alerta cuando el nivel de la tendencia media se cruza hacia arriba.
Middle trend level is crossed Down - alerta cuando el nivel de la tendencia media se cruza hacia abajo.
DI+ line crosses the DI- line Up - alerta cuando DI+ cruza la línea DI-arriba.
DI+ line crosses the DI- line Down - alerta cuando DI+ cruza DI- hacia abajo.
All timeframes in the same direction - alerta cuando todas las celdas muestran la misma dirección.
DI+ changes direction - DI+ cambia de dirección.
DI- changes direction - DI- cambia de dirección.
DI+ crosses level X (0-off) - DI+ cruza el nivel X (0-apagado).
DI- crosses level X (0-off) - DI- cruza el nivel X (0-off).
Pop up alert - Alerta emergente.
Push notifications - Notificaciones push.
E-mail notifications - Notificaciónes de Correo Electrónico.
Sound alert - Alerta sonora.
Export Data to CSV file
Allow data export
File name
Separator between columns
Export ADX
Export DI+
Export DI-
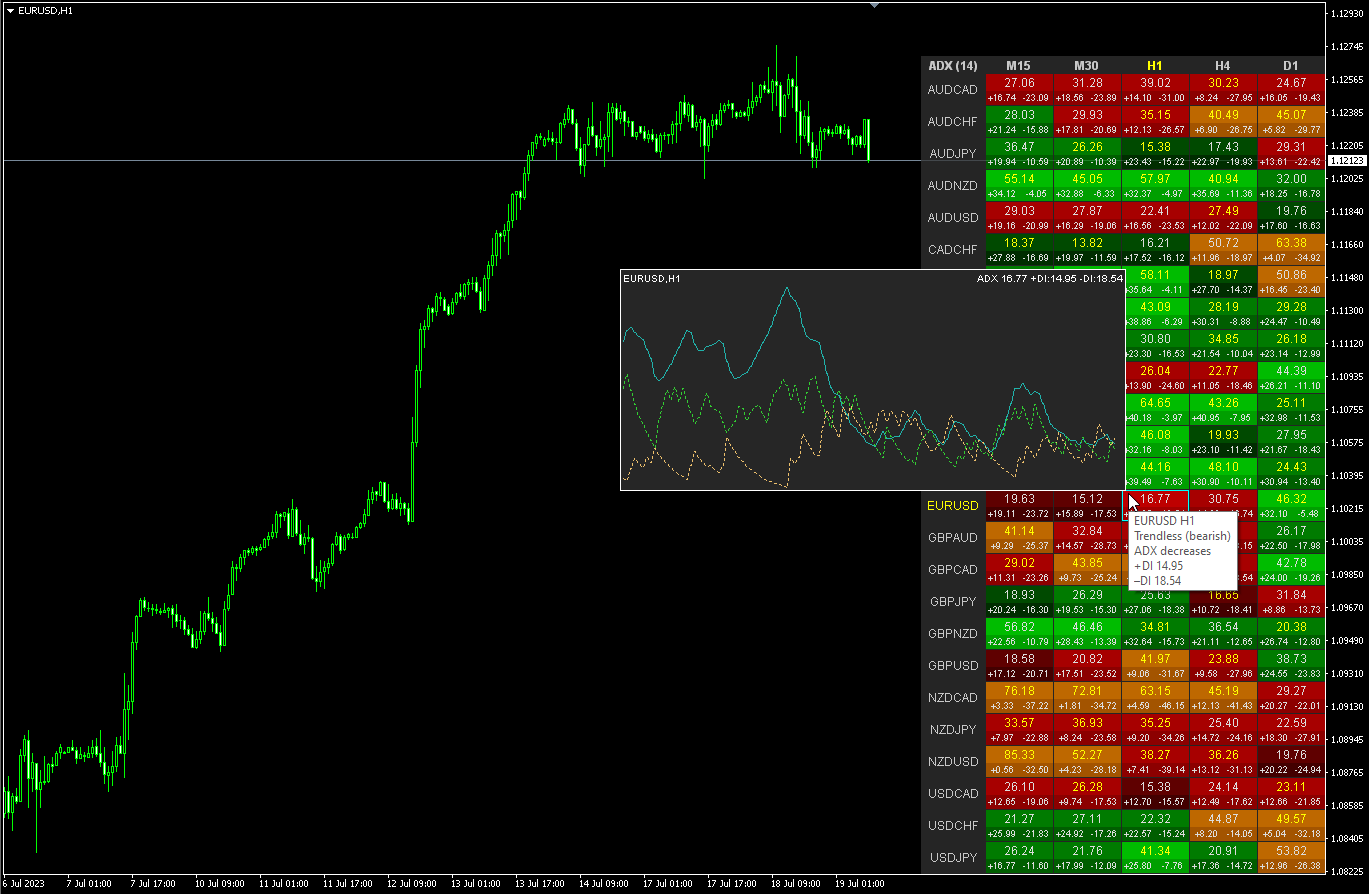
Gráfico emergente
Enable Popup chart - Habilitar gráfico emergente
Candle size - Tamaño de la vela
Width (pix) - Ancho (píxeles)
Height (pix) - Altura (píxeles)
Font size - Tamaño de fuente
Transparency (0-255) - Transparencia (0-255)


One of the best ADX indicator on the market place, with great support!