FX Snipers T3 CCI Divergence version
- Indicadores
- Versión: 2.10
- Actualizado: 18 noviembre 2021
- Activaciones: 10

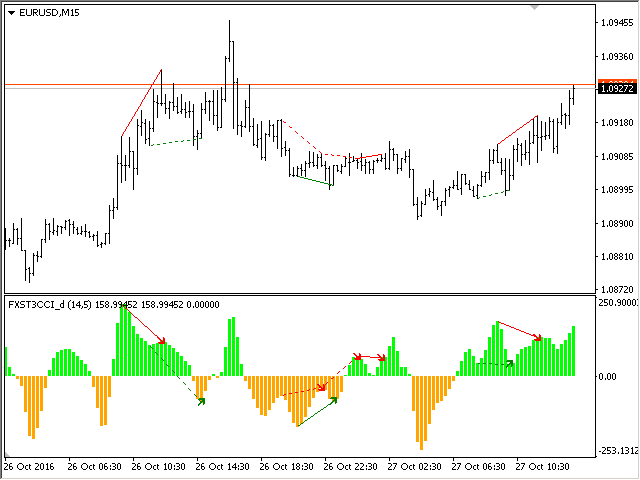
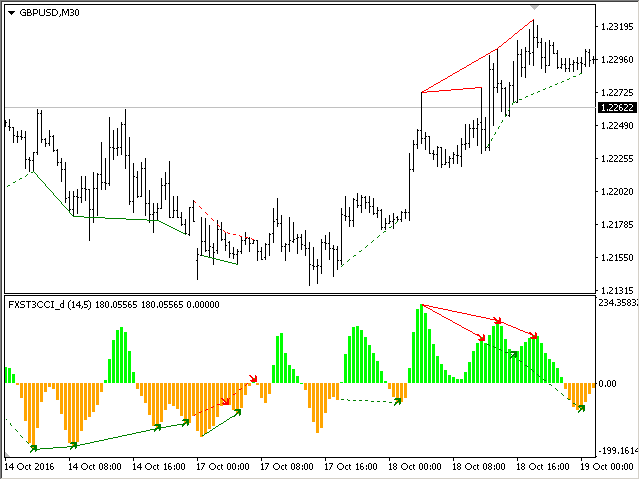
Este es el famoso indicador T3 CCI de FX Sniper. Es una versión fija que contiene adicionalmente búsqueda de divergencia clásica e inversa (oculta). La divergencia clásica se muestra como una línea sólida, la divergencia inversa se muestra como una línea de puntos. Las divergencias se dibujan en el indicador y en el gráfico (si selecciona las opciones adecuadas).
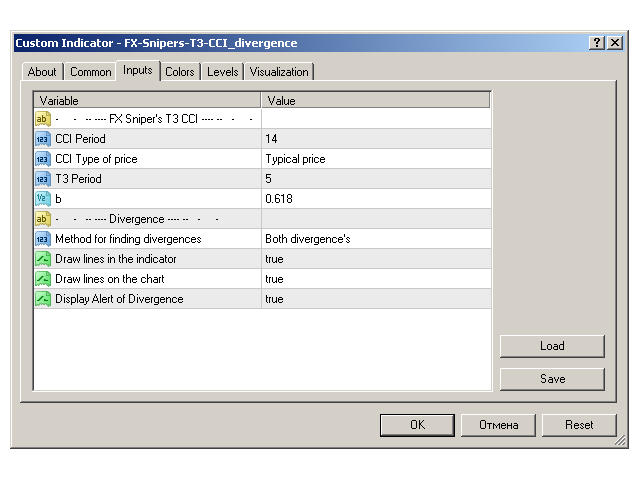
Parámetros
- Periodo del CCI - periodo del indicador Commodity Channel Index
- CCI Tipo de precio - precio utilizado para el cálculo del indicador
- T3 Período - Período de francotirador
- b - Multiplicador de francotirador
- Método de búsqueda de divergencias - visualización de las divergencias:
- Divergencia clásica
- Divergencia inversa
- Ambas divergencias
- Desactivar - no mostrar divergencias
- Dibujar líneas en el indicador - mostrar líneas en el indicador
- Dibujar líneas en el gráfico - mostrar líneas en el gráfico
- Mostrar alerta de divergencia - mostrar alertas emergentes.
El usuario no ha dejado ningún comentario para su valoración