Fibo Candle Previous for MT5
- Indicadores
- Versión: 4.0
- Actualizado: 14 octubre 2025
- Activaciones: 10

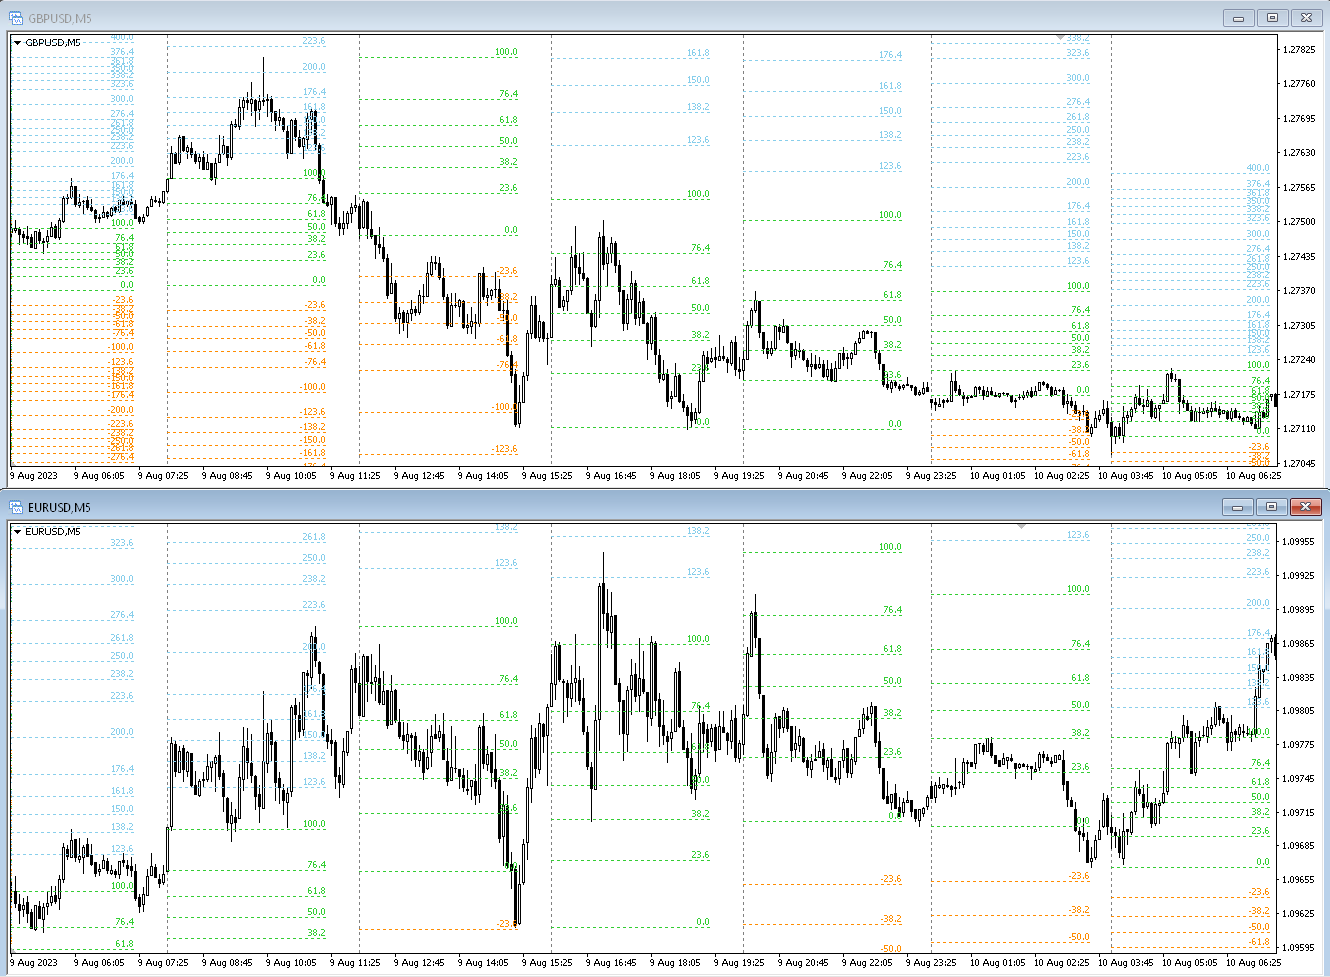
El indicador dibuja automáticamente los niveles de Fibonacci basándose en el indicador ZigZag, sesiones de negociación, fractales o velas (incluidos períodos de tiempo no estándar: año, 6 meses, 4 meses, 3 meses, 2 meses) (retroceso automático de Fibo). Puede elegir cualquier período de tiempo superior para el cálculo de Fibonachi.
Los niveles se vuelven a dibujar cada vez que se cierra la barra actual. Es posible habilitar alertas al cruzar los niveles especificados.
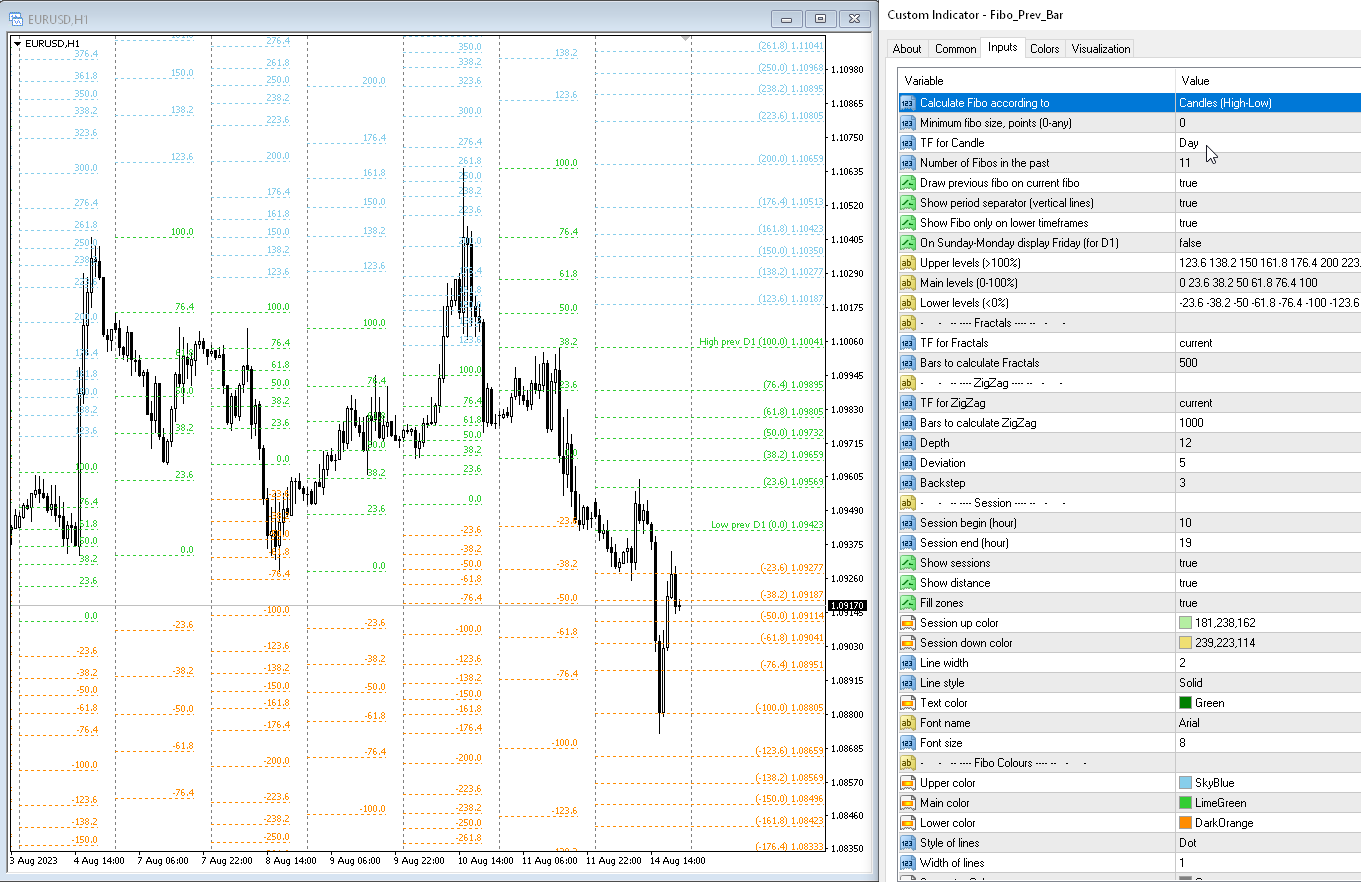
También puedes analizar niveles en el historial. Para hacer esto, es necesario especificar el número de niveles de Fibo en el parámetro "Número de Fibo en el pasado".
Parámetros
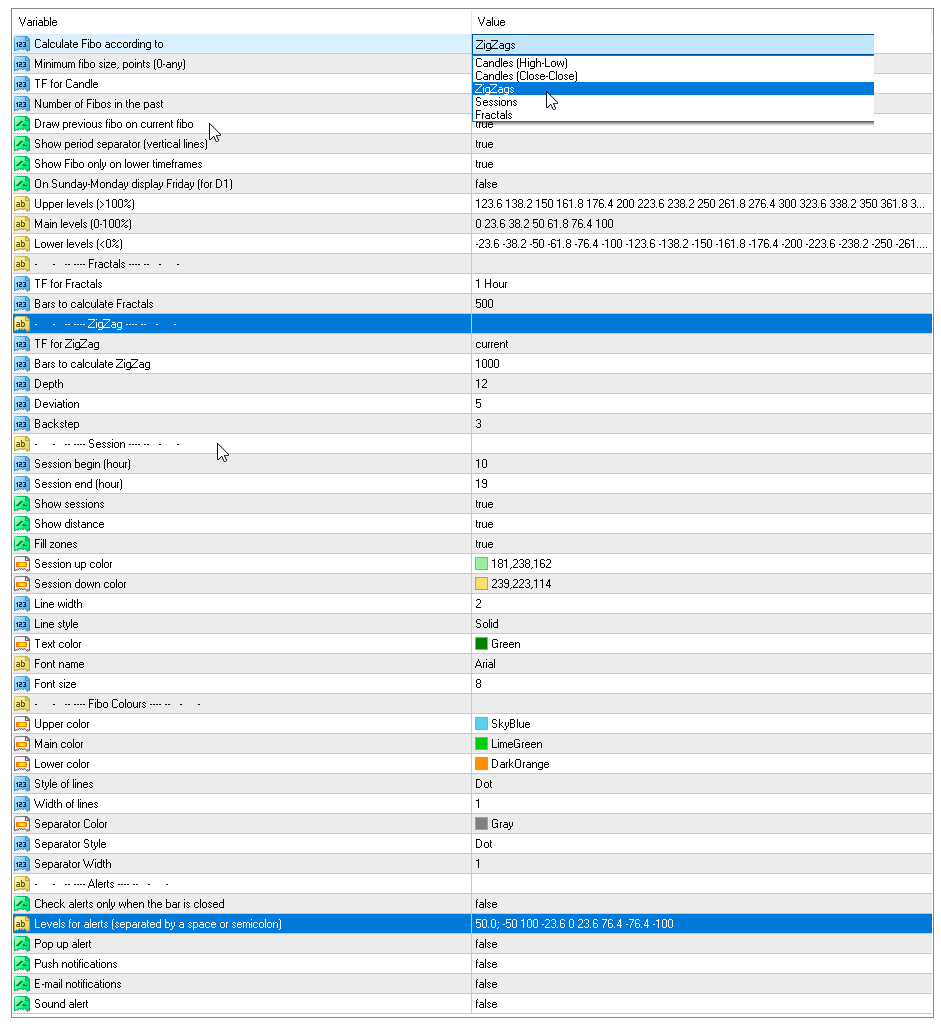
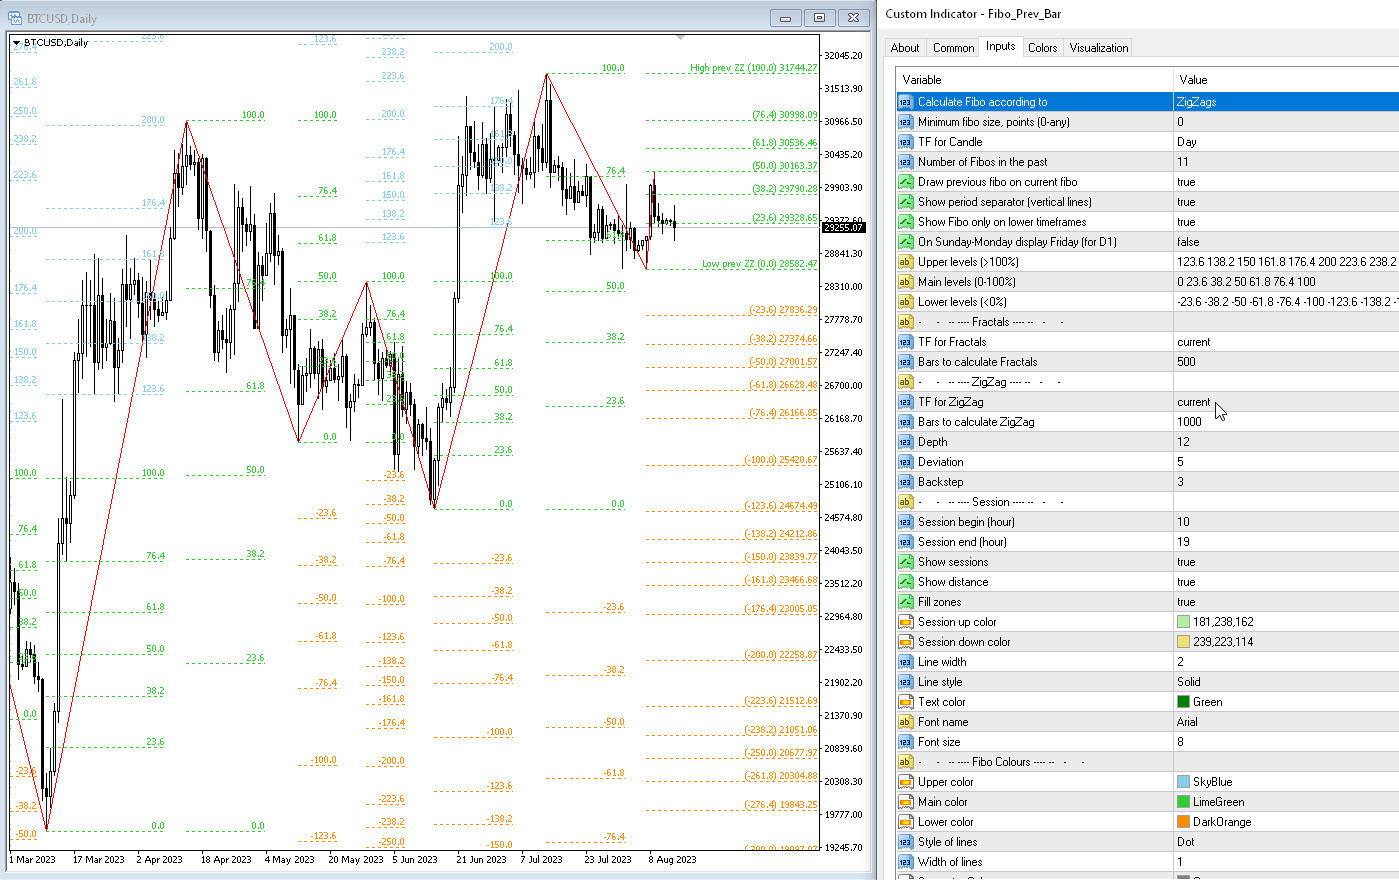
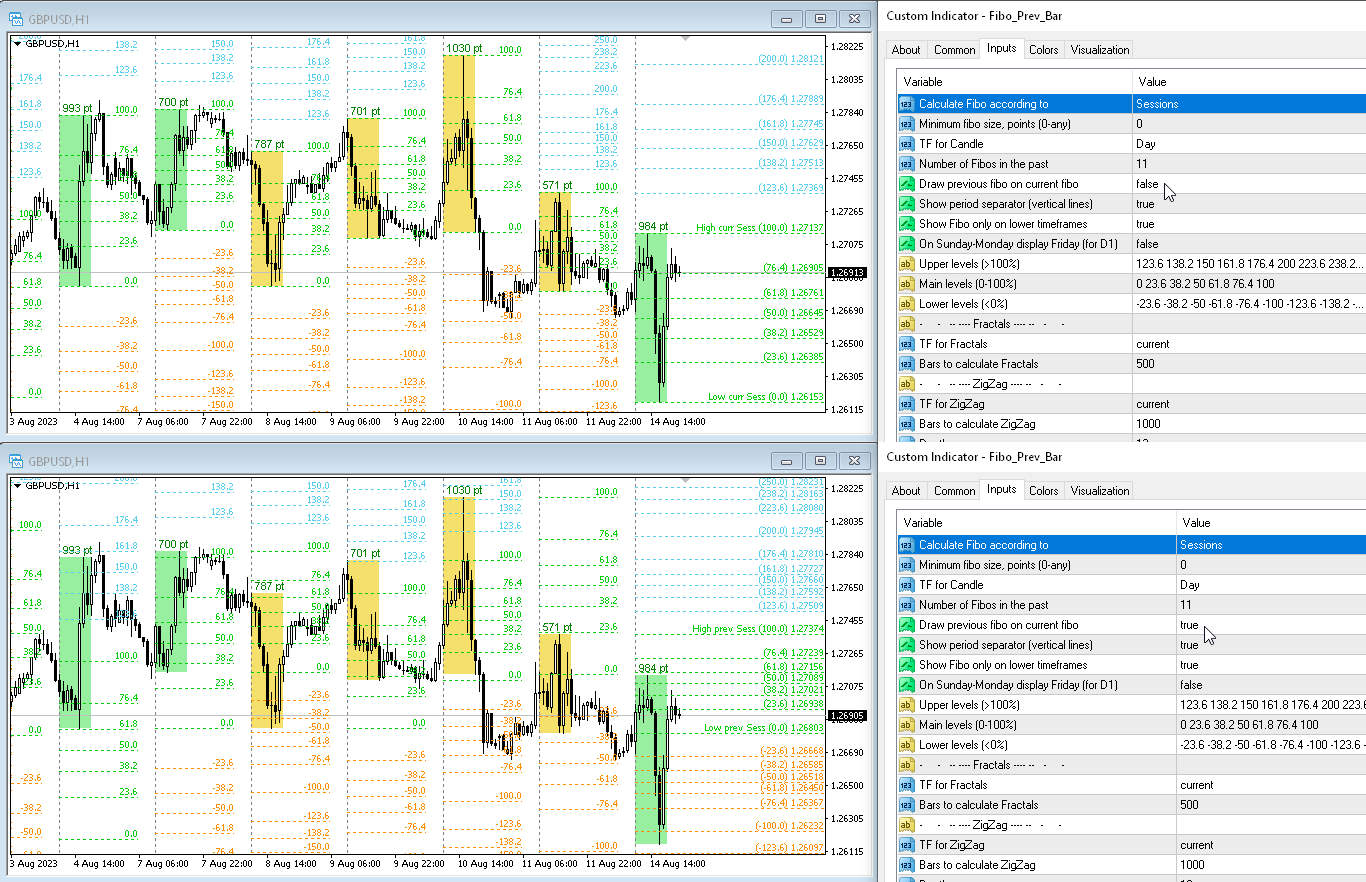
Calculate Fibo according to — Modos de cálculo de Fibonacci:
- Candles (High-Low) — construye un fibo basado en el máximo-bajo;
- Candles (Close-Close) — construye un fibo basado en el cierre;
- ZigZags — construye fibo mediante puntos ZigZag;
- Sessions — cree fibo mediante sesiones de negociación;
- Fractals — construye fibo mediante puntos de Fractales.
Minimum fibo size, points (0-any) — el tamaño mínimo de Fibo en puntos. Si el fibonacci es menor que este tamaño, se ignora.
TF for Candle — período de tiempo de las velas para construir niveles de Fibo;
Number of Fibo in the past — el número de niveles de Fibo que se trazarán en el historial;
Upper levels (>100%) — niveles superiores, los valores deben ser mayores que 100 (separados por espacio o punto y coma);
Main levels (0-100%) — niveles intermedios, los valores deben estar entre 0 y 100 (separados por espacio o punto y coma);
Lower levels (<0%) — niveles inferiores, los valores deben ser inferiores a 100 (separados por espacio o punto y coma);
Draw previous fibo on current fibo — dibuja el Fibo anterior en lugar del Fibo actual. Si desactiva este parámetro, los Fibos se dibujarán en los niveles en los que fueron calculados.
On Sunday-Monday display Friday (for D1) — si hay cotizaciones de sábado a domingo, extraiga un fibo de viernes. Sólo para el período D1;
Show period separator (vertical lines) — muestra el separador de períodos. Se mostrarán como líneas verticales en el gráfico;
Show Fibo only on lower timeframes — dibuja Fibo solo en períodos más cortos;
Upper color — color de las líneas superiores;
Main color — color de las líneas medias;
Lower color — color de las líneas inferiores;
Style of lines — estilo de línea;
Width of lines — ancho de línea;
Min pause between signals (sec) — pausa entre alertas en segundos;
Levels for alerts (separated by a space or semicolon) — niveles para alertas, separados por espacios o punto y coma;
Alerts — habilite alertas emergentes;
Push notification — habilite las notificaciones push;
Send e-mail — enviar correos electrónicos.


This is one of the main indicators for my reviews, excellent the attentiveness of the developer to implement suggestions for improvements, great job!