Protected highs lows and trend detected
- Indicadores
-
Minh Truong Pham
 Hello, my name is Pham and I am a programmer and trader! At here, I create amazing forex indicators and expert advisors for Metatrader.
I will try:
+ Provide best tools base on my 5 years experience as a trader and 10 years as a programmer. - Versión: 1.10
- Actualizado: 31 diciembre 2024
- Activaciones: 5
Este indicador presenta un enfoque alternativo para identificar la Estructura del Mercado. La lógica utilizada se deriva del material de aprendizaje creado por DaveTeaches (en X)
Actualización v1.10:
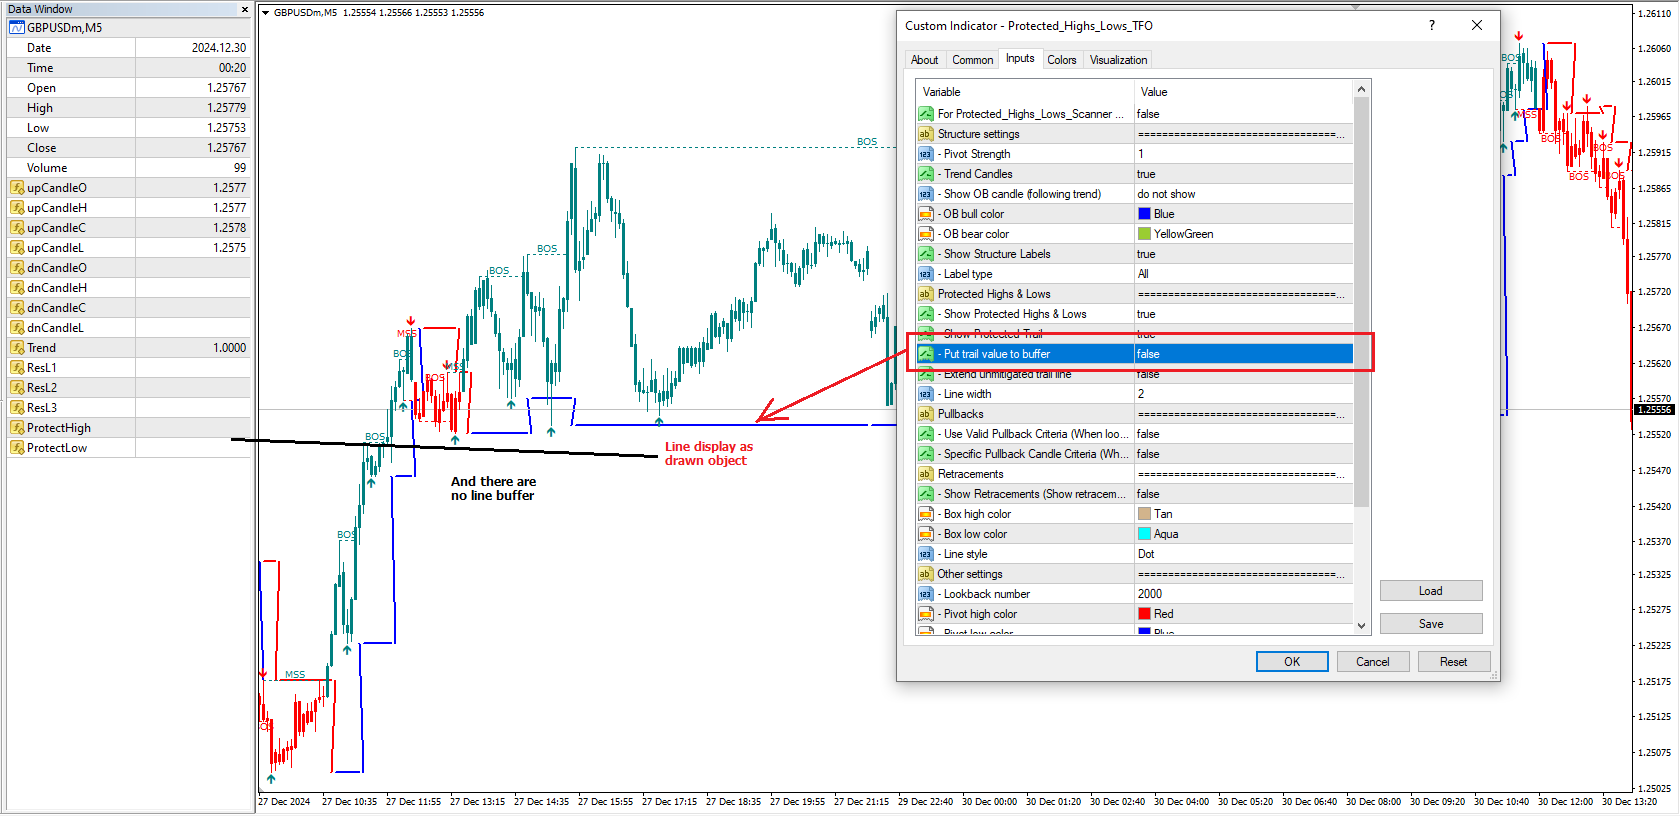
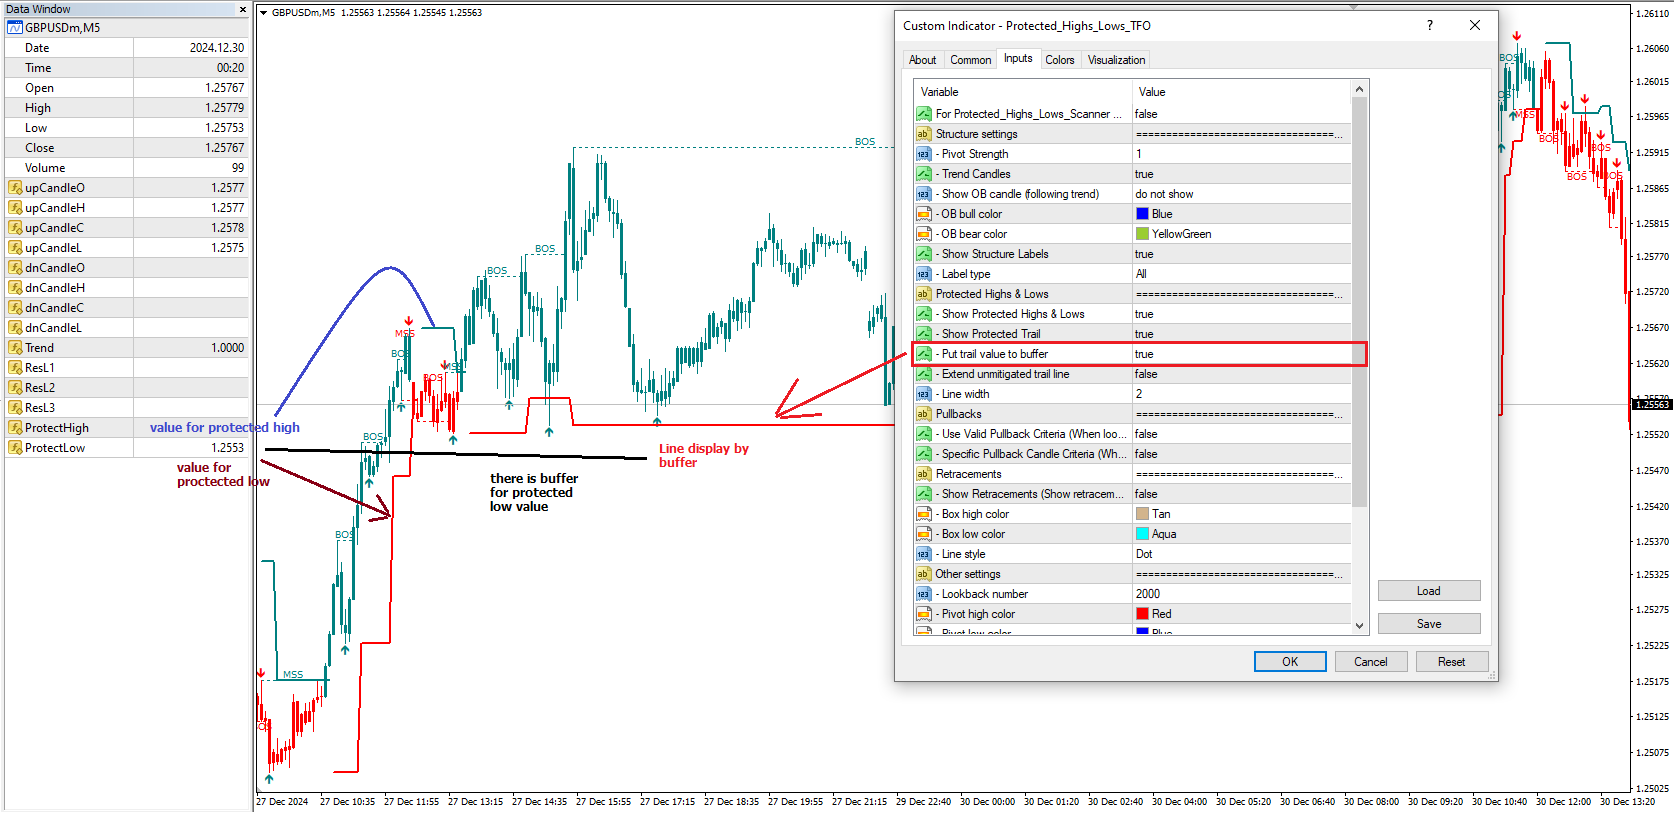
+ añadir la opción de poner el valor alto/bajo protegido en el buffer (figura 11, 12)
+ añadir valor de Retracements al buffer cuando se muestran Retracements
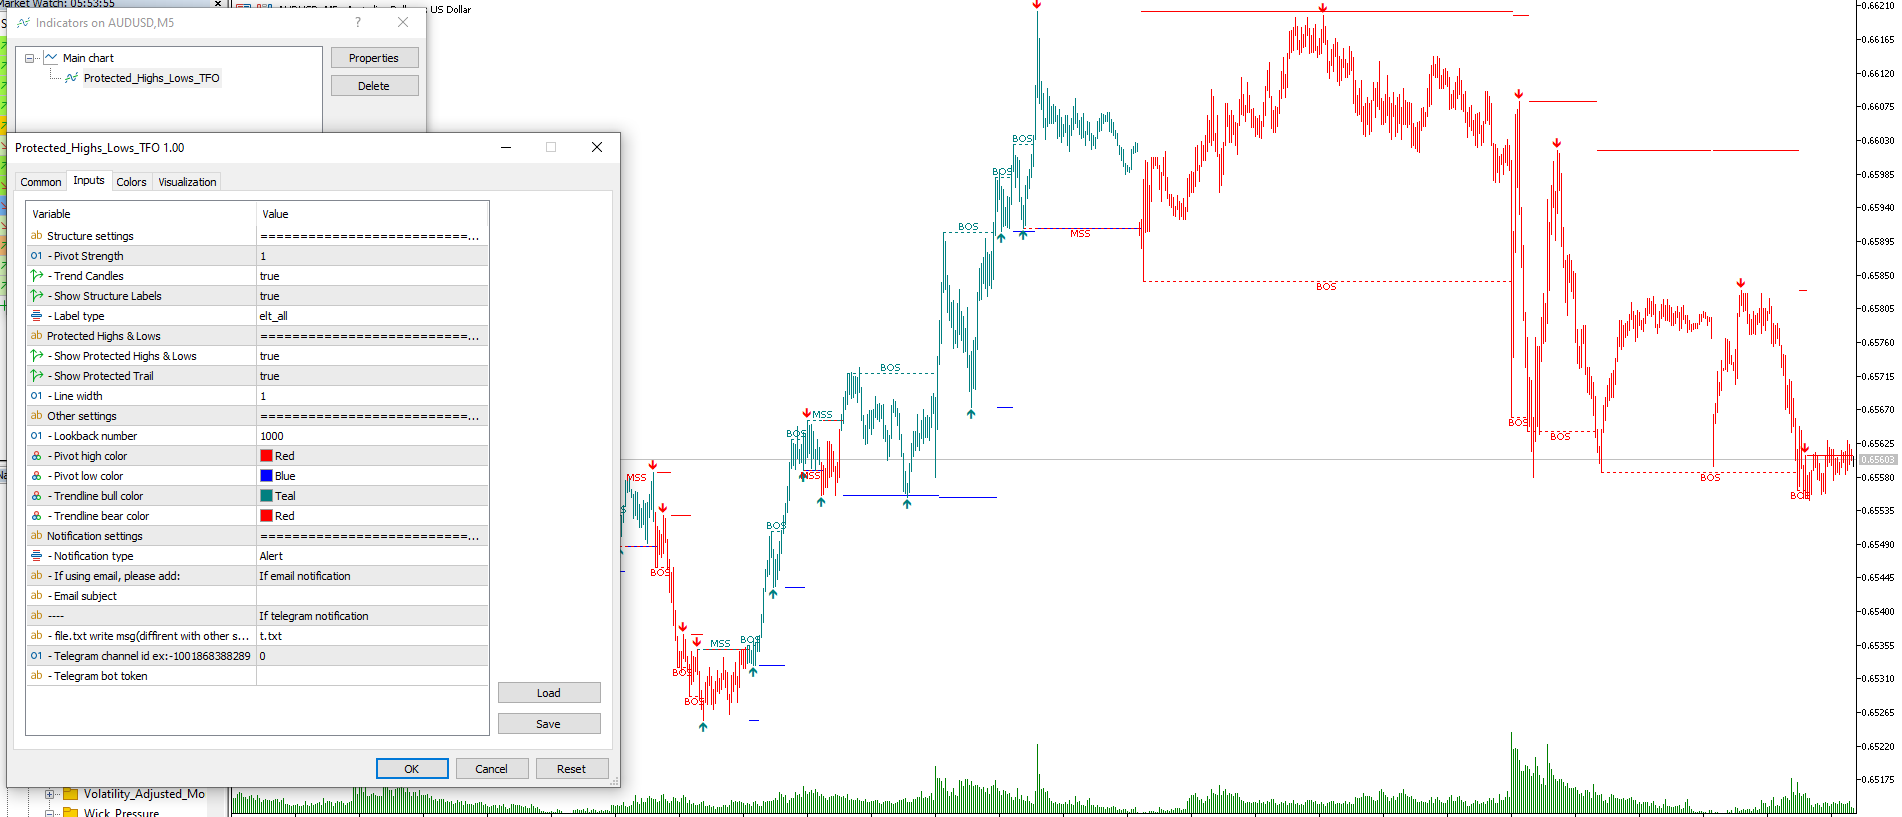
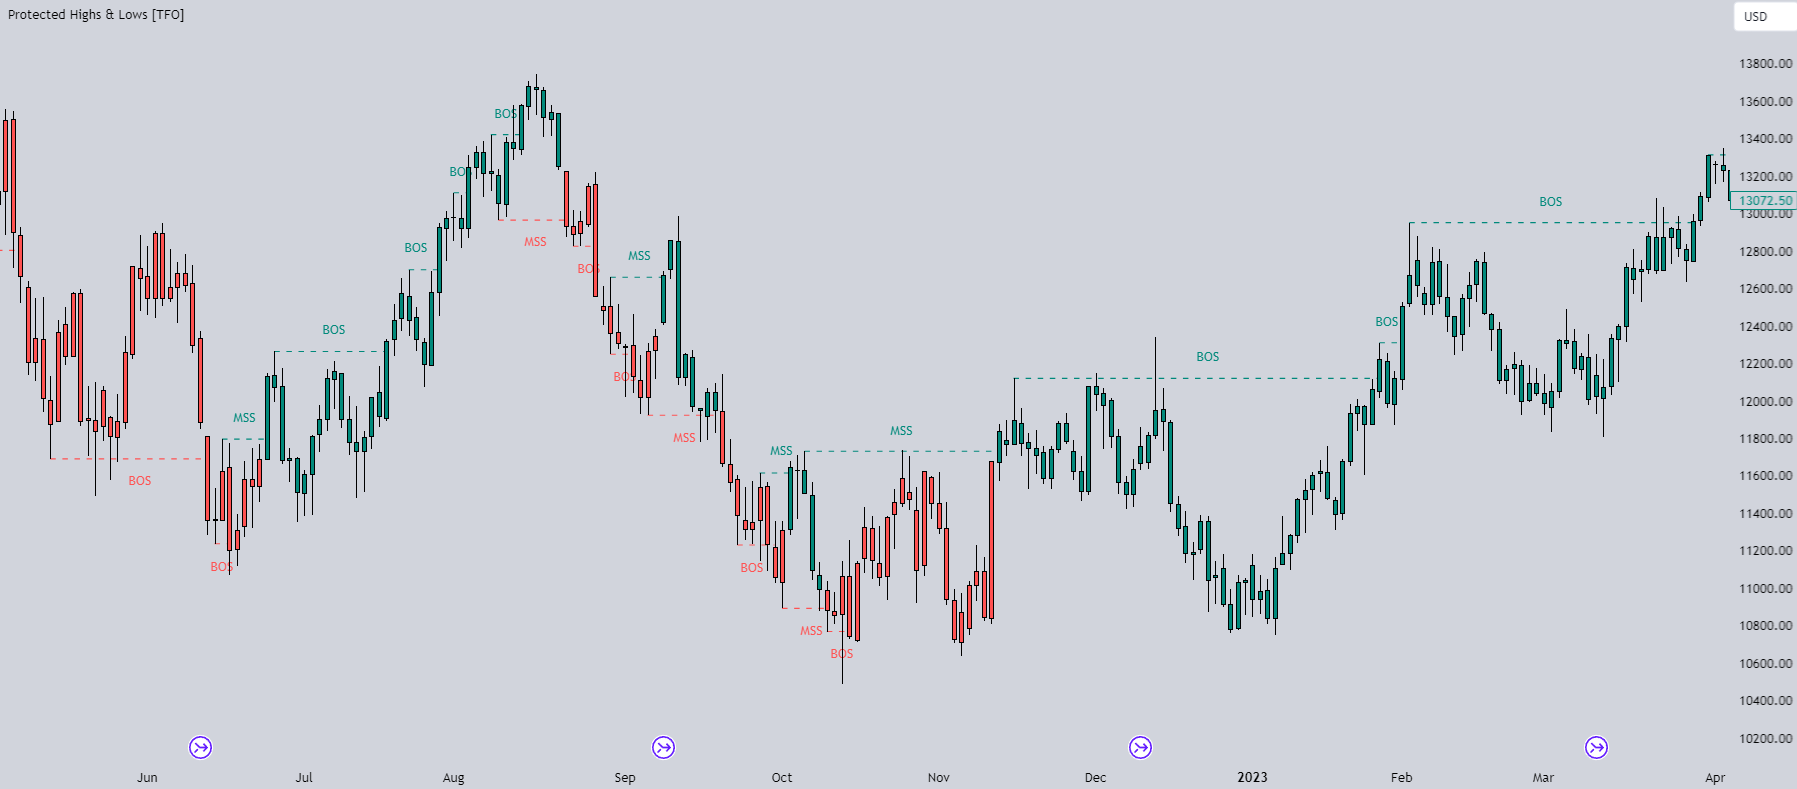
Al cuantificar la Estructura del Mercado, es común utilizar máximos y mínimos fractales para identificar pivotes de oscilación "significativos". Cuando el precio cierra a través de estos pivotes, podemos identificar un Desplazamiento de la Estructura del Mercado (MSS) para los retrocesos o una Ruptura de la Estructura (BOS) para las continuaciones. La principal diferencia con esta lógica "protegida" está en cómo determinamos los pivotes/niveles que se utilizan para determinar un MSS o BOS válido.
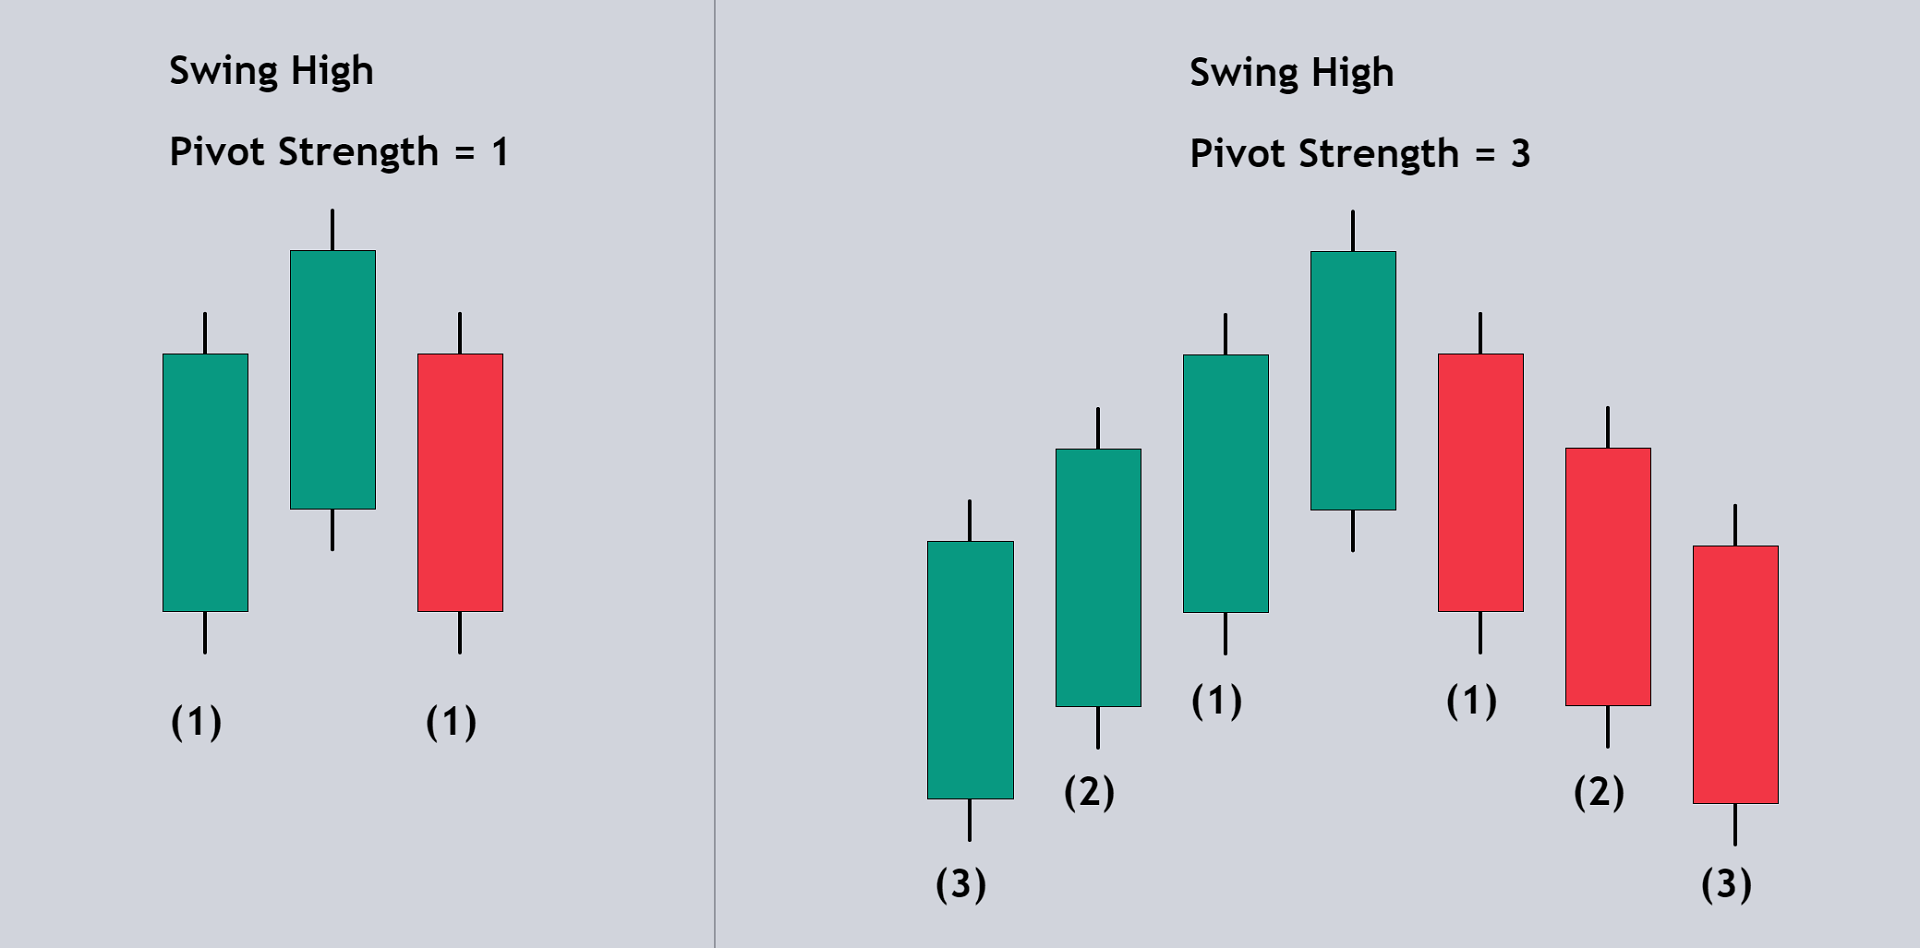
No obstante, la importancia de nuestros pivotes oscilantes sigue estando regida por el parámetro de entrada Fuerza del Pivote, que requiere que los pivotes oscilantes válidos se comparen con tantas barras a la izquierda y a la derecha de ellos. Se trata de un parámetro opcional, ya que tradicionalmente se establece en 1 por defecto. (Imagen 2)
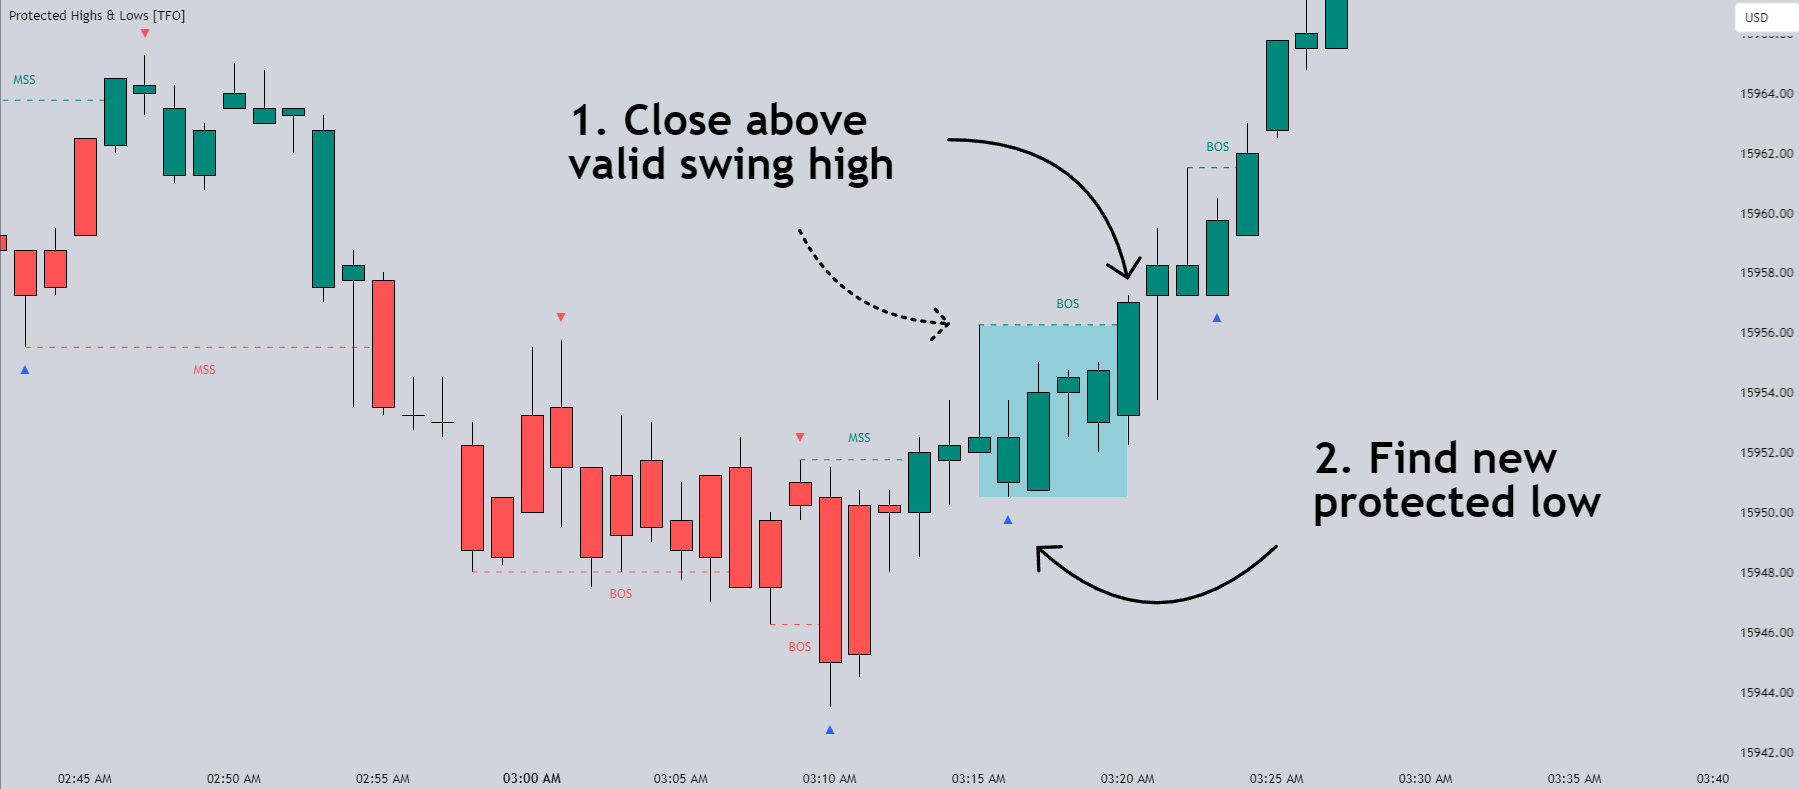
Al identificar un BOS: Cuando el precio cierra por debajo de un mínimo oscilante válido, miramos hacia atrás desde la barra actual para encontrar el máximo más alto que se hizo en ese rango. Del mismo modo, cuando el precio cierra por encima de un máximo oscilante válido, miramos hacia atrás desde la barra actual para encontrar el mínimo más bajo que se hizo en ese rango, que se convierte en nuestro mínimo protegido.
Tenga en cuenta que estos máximos y mínimos válidos son los primeros pivotes oscilantes creados después de un MSS/BOS. Por ejemplo, cuando el precio hace un BOS/MSS alcista y luego se aleja, se forma un swing high. Este primer máximo de oscilación es lo que necesita ser negociado para ver un BOS válido. (Imagen 3)
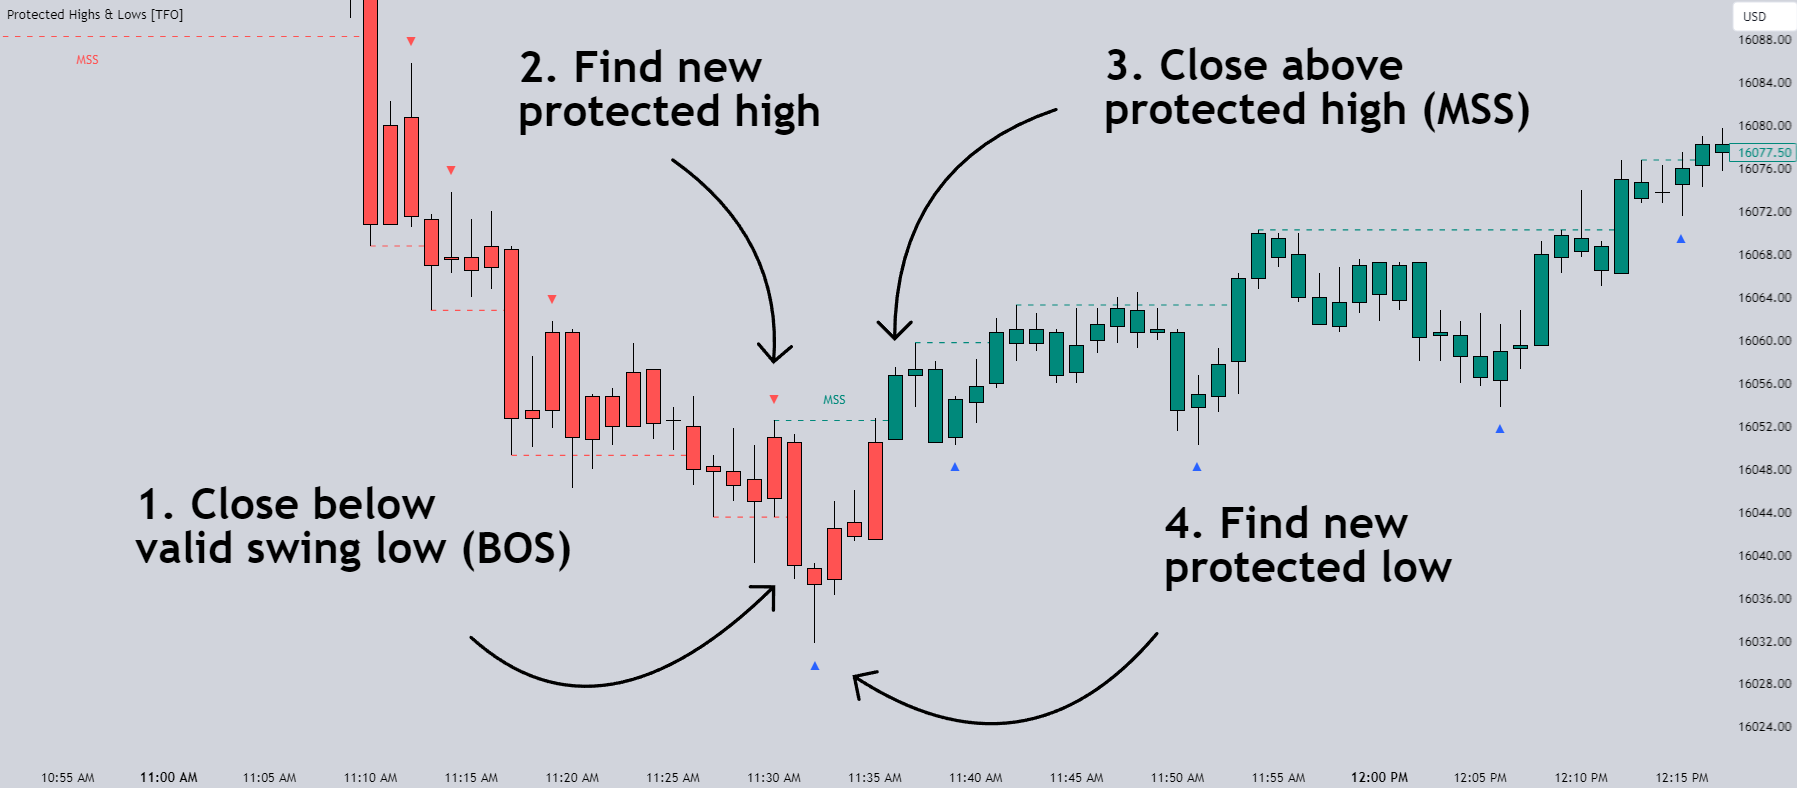
Al identificar un MSS: Si la tendencia actual es bajista y estamos buscando una reversión alcista, necesitaríamos que el precio cerrara por encima del máximo protegido más reciente. Cuando esto sucede, seguimos mirando hacia atrás para encontrar el mínimo más bajo que se creó en ese rango, y lo convertimos en nuestro nuevo mínimo protegido. Del mismo modo, cuando buscamos una reversión bajista, el precio tendría que cerrar por debajo del mínimo protegido más reciente, lo que nos daría como resultado un nuevo máximo protegido (el punto más alto de ese rango). (Imagen 4)
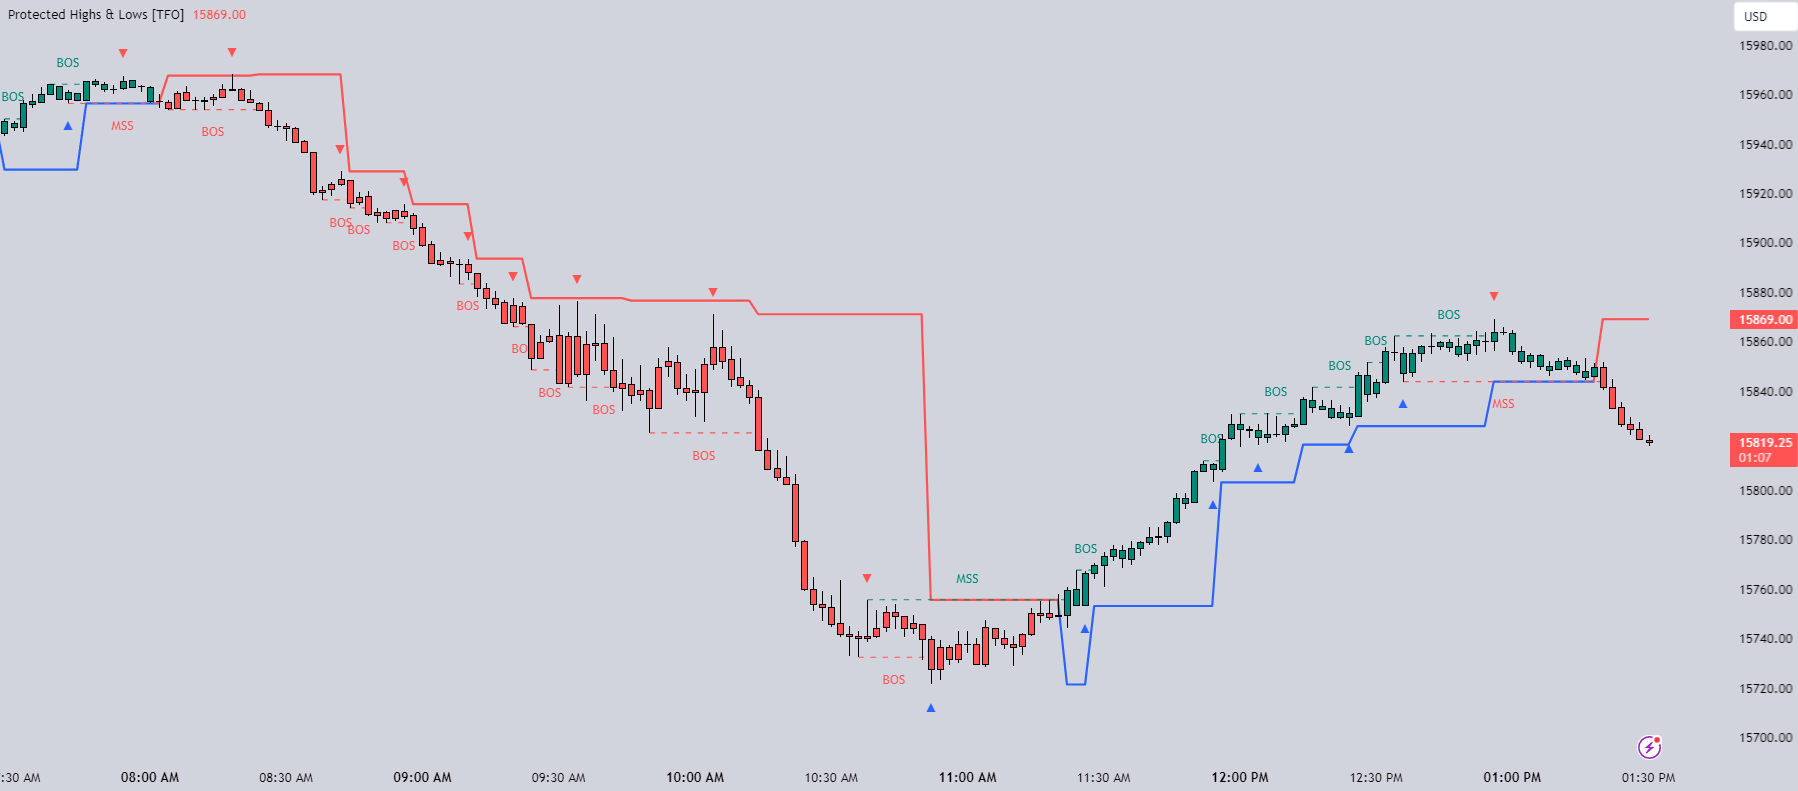
La opción Velas de Tendencia permite a los usuarios visualizar fácilmente el estado actual de la Estructura de Mercado con colores alcistas y bajistas. Los usuarios también pueden mostrar las etiquetas BOS y MSS si lo desean. (Imagen 5)
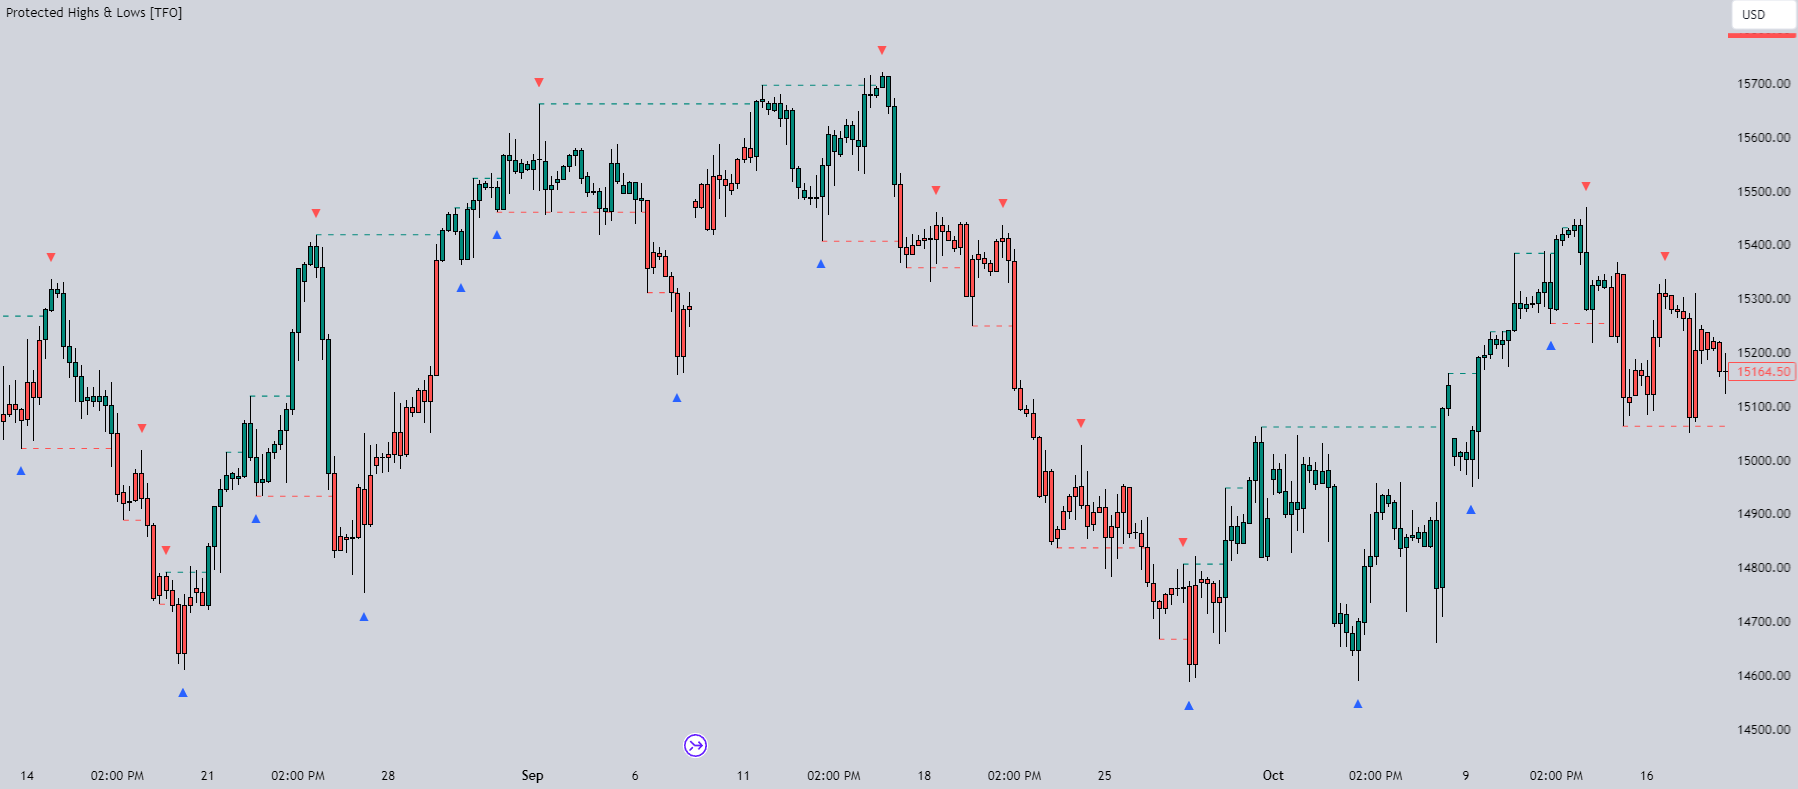
Mostrar Máximos y Mínimos Protegidos anotará los máximos y mínimos protegidos, sólo tenga en cuenta que las propias etiquetas se trazan en el pasado debido a la función lookback necesaria para identificarlas. (Imagen 6)
Por último, la opción Mostrar Trayectoria Protegida dibujará una línea para indicar esencialmente una línea similar a un trailing stop para denotar el mínimo protegido más reciente (si es alcista) o el máximo protegido (si es bajista). (Imagen 7)
Actualización
A partir de la v1.2 el cliente puede leer fácilmente la tendencia de este índice vía buffer para construir un escáner o EA. Todo el mundo puede descargar escáner libre (con código fuente) en aquí
+ La configuración "Para el escáner Protected_Highs_Lows" debe serfalsaen el modo de visualización.
Desde v1.8
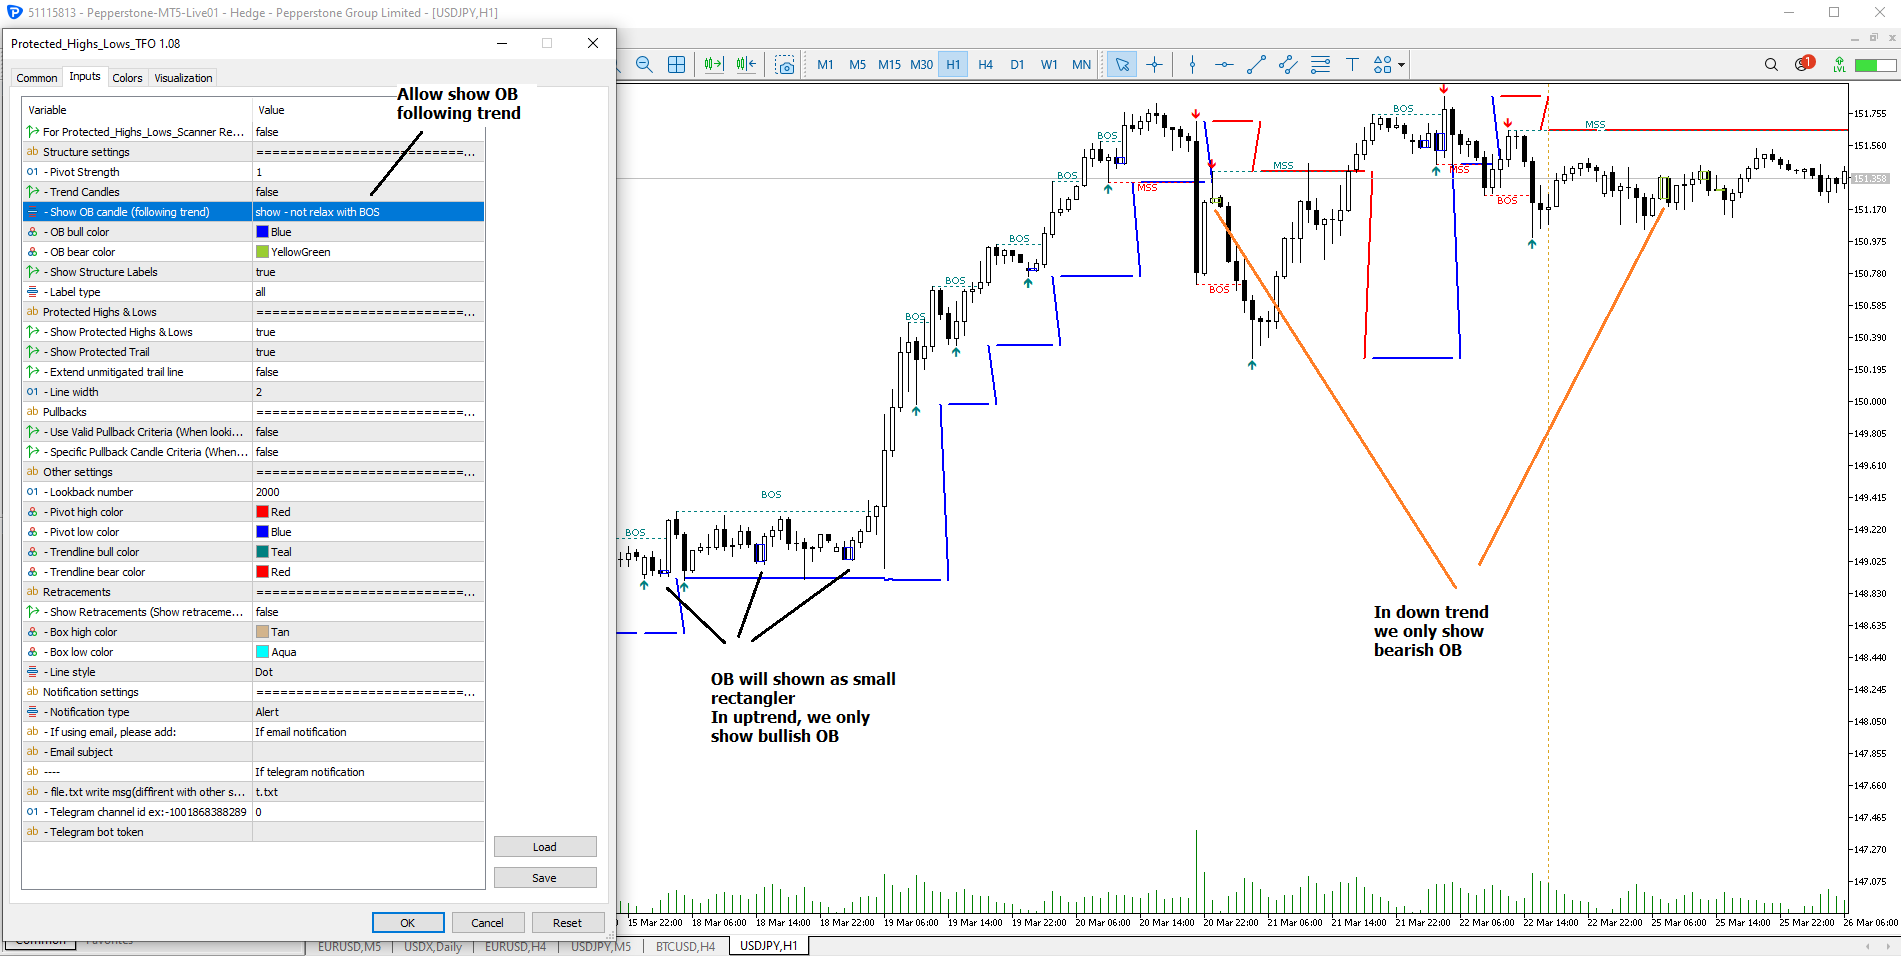
1. Añadida nueva función para mostrar el bloque de órdenes según la tendencia: (imagen 8)
+ Tendencia alcista => mostrar solo OB alcista
+ Tendencia bajista => mostrar solo OB bajista
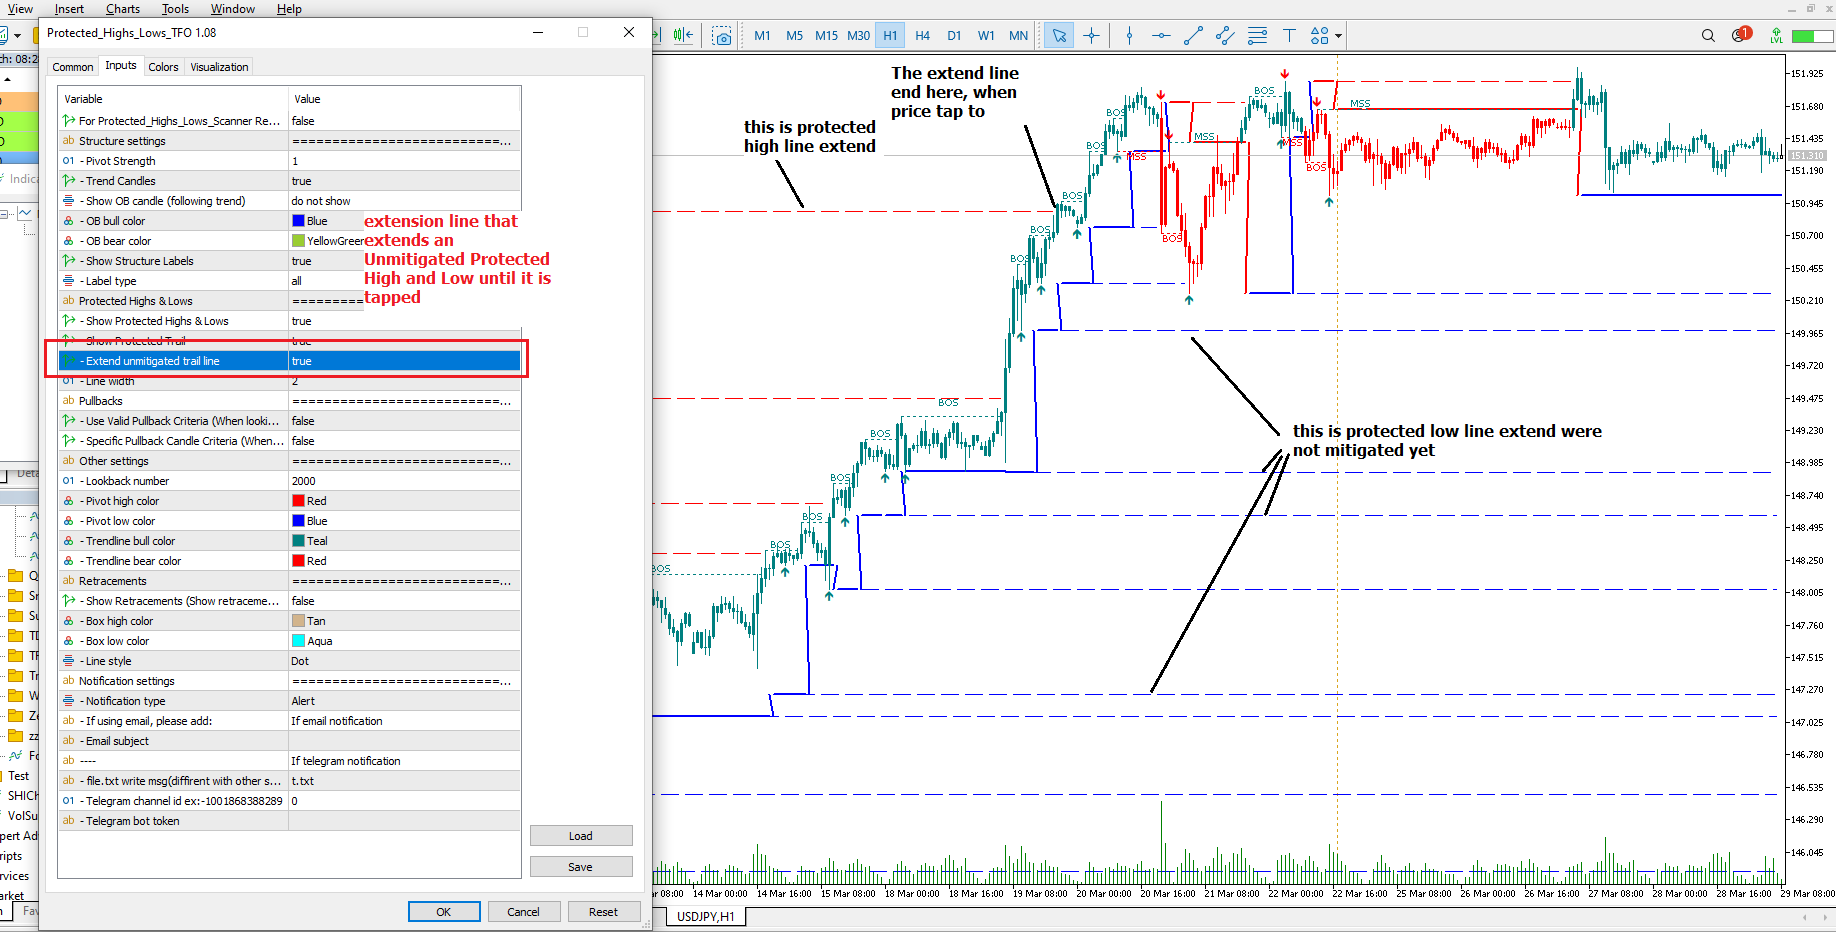
2. Añadida función por una línea de extensión que extiende un Máximo y Mínimo Protegido no mitigado hasta que sea tocado (imagen 9)