Fibo Candle Previous for MT5

5
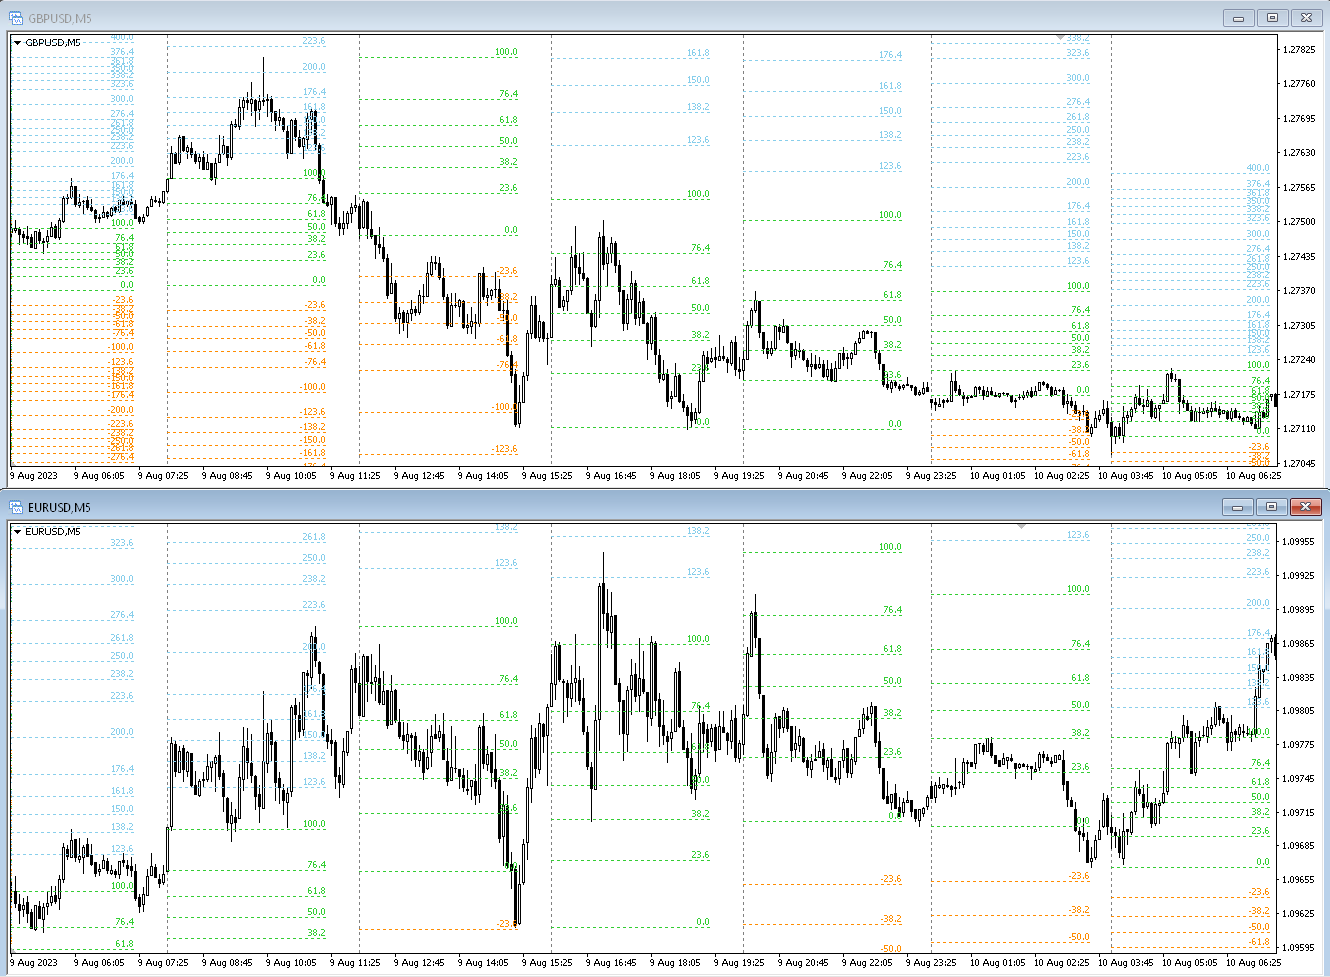
L'indicateur dessine automatiquement les niveaux de Fibonacci en fonction de l'indicateur ZigZag, des sessions de trading, des fractales ou des bougies (y compris les délais non standard : année, 6 mois, 4 mois, 3 mois, 2 mois) (Retracement Auto Fibo). Vous pouvez choisir n’importe quel délai plus élevé pour le calcul de Fibonachi.
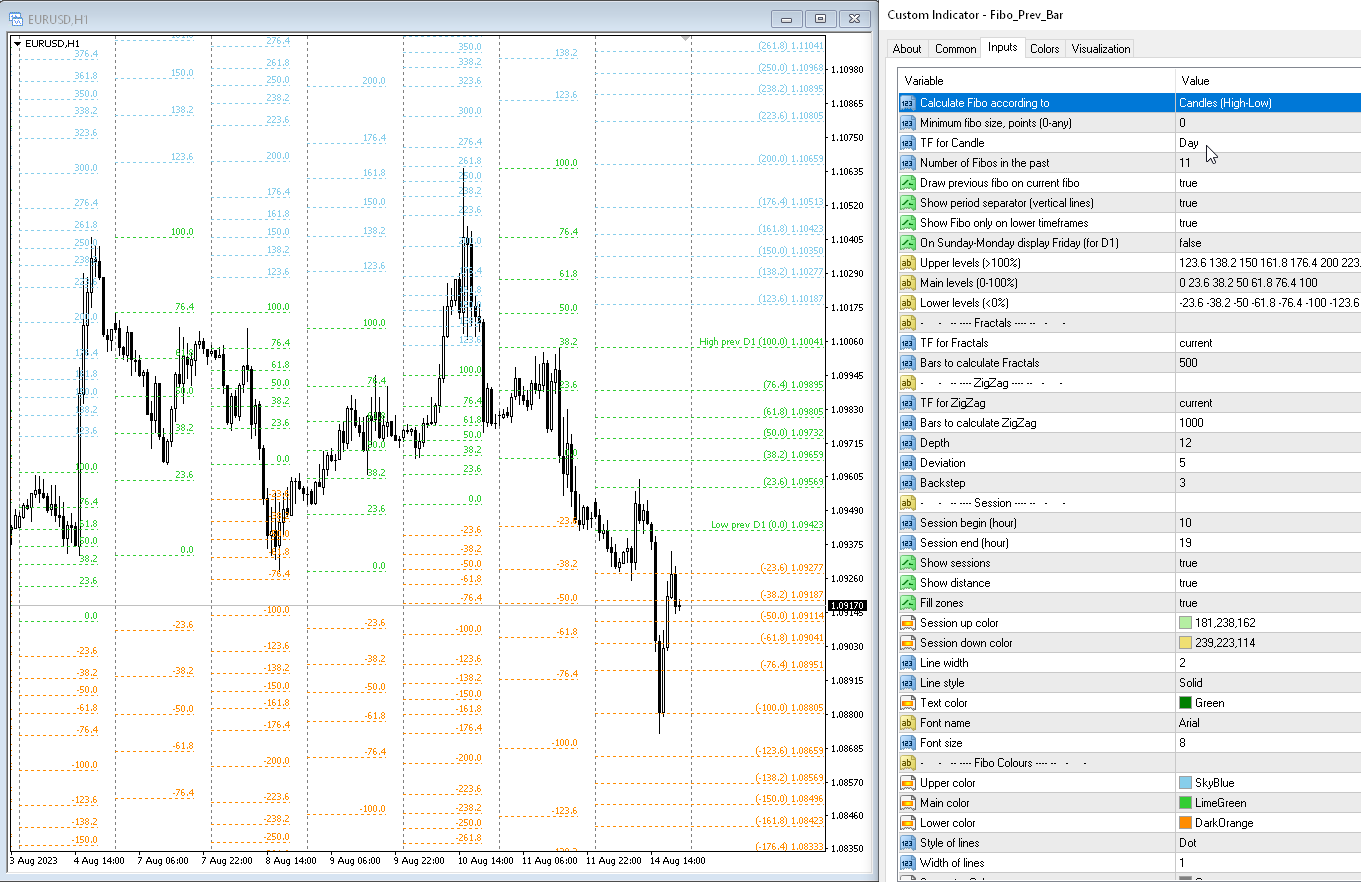
Les niveaux sont redessinés à chaque fermeture de la barre actuelle. Il est possible d'activer des alertes lors du franchissement des niveaux spécifiés.

Vous pouvez également analyser les niveaux de l'historique. Pour ce faire, il faut préciser le nombre de niveaux de Fibo dans le paramètre « Nombre de Fibo dans le passé ».


Paramètres

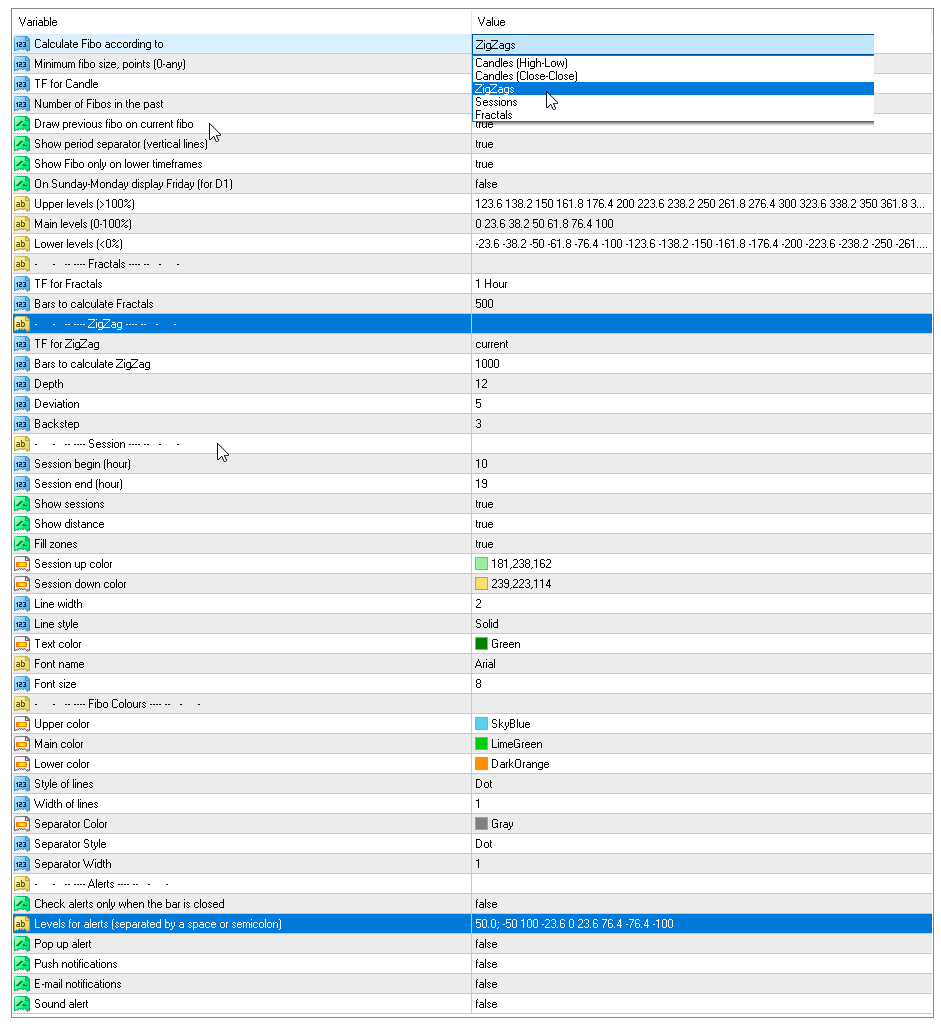
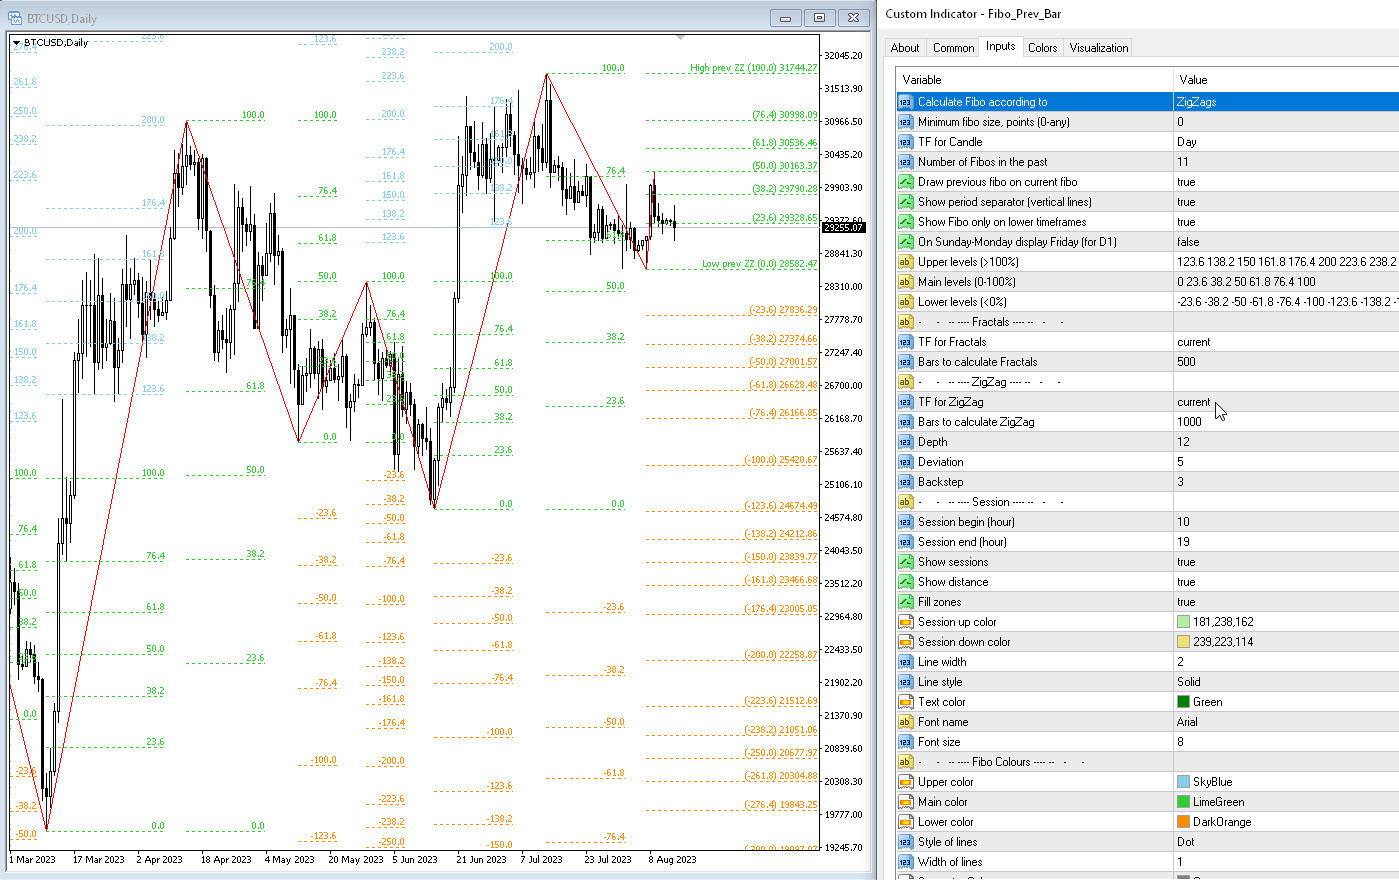
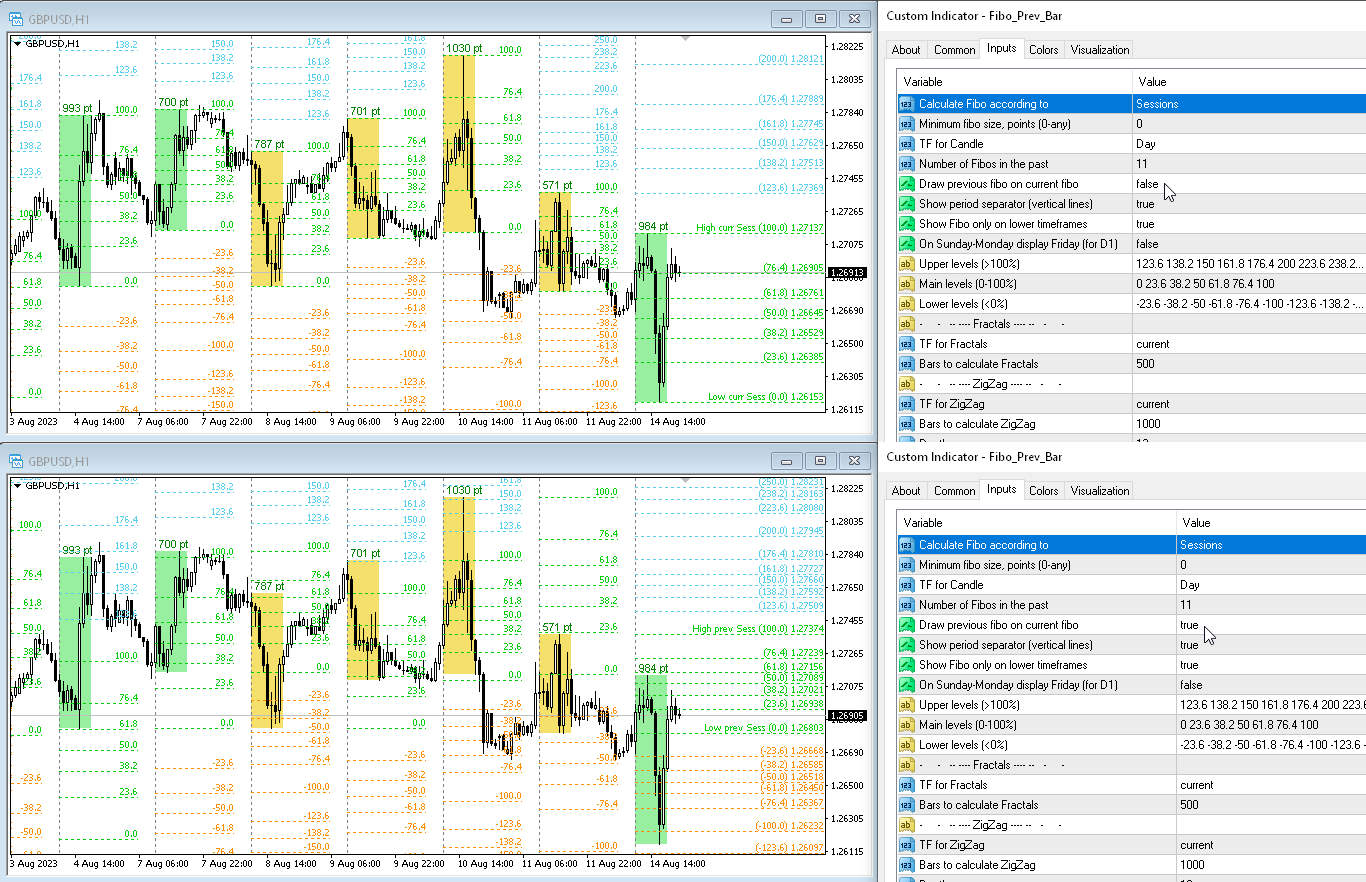
Calculate Fibo according to — Modes de calcul de Fibo:
  • Candles (High-Low) — construisez un fibo basé sur le haut-bas ;
  • Candles (Close-Close) — onstruisez un fibo basé sur la fermeture-fermeture ;
  • ZigZags — construisez Fibo par points ZigZag ;
  • Sessions — construire Fibo par sessions de trading ;
  • Fractals — construisez Fibo par points Fractales.
Minimum fibo size, points (0-any) — la taille minimale de Fibo en points. Si le fibo est inférieur à cette taille, il est alors ignoré.
TF for Candle — délai des bougies pour construire les niveaux de Fibo ;
Number of Fibo in the past — le nombre de niveaux de Fibo à tracer dans l'historique ;
Upper levels (>100%) — niveaux supérieurs, les valeurs doivent être supérieures à 100 (séparées par un espace ou un point-virgule) ;
Main levels (0-100%) — niveaux intermédiaires, les valeurs doivent être comprises entre 0 et 100 (séparées par un espace ou un point-virgule) ;
Lower levels (<0%) — niveaux inférieurs, les valeurs doivent être inférieures à 100 (séparées par un espace ou un point-virgule) ;
Draw previous fibo on current fibo — dessinez le Fibo précédent à la place du Fibo actuel. Si vous désactivez ce paramètre, alors les Fibos seront dessinés aux niveaux auxquels ils ont été calculés.
On Sunday-Monday display Friday (for D1) — s'il y a des cotations samedi-dimanche, dessinez un fibo du vendredi. Uniquement pour la période D1 ;
Show period separator (vertical lines) — affiche le séparateur de points. Sera affiché sous forme de lignes verticales sur le graphique ;
Show Fibo only on lower timeframes — dessinez Fibo uniquement sur des périodes plus courtes ;
Upper color — couleur des lignes supérieures ;
Main color — couleur des lignes médianes ;
Lower color — couleur des lignes inférieures ;
Style of lines — style de ligne ;
Width of lines — largeur des lignes ;
Min pause between signals (sec) — pause entre les alertes en secondes ;
Levels for alerts (separated by a space or semicolon) — niveaux d'alertes, séparés par des espaces ou des points-virgules ;
Alerts — activez les alertes contextuelles ;
Push notification — activez les notifications push ;
Send e-mail — envoyez des e-mails.
Avis 3
marcello 981
117
marcello 981 2023.11.26 17:36 
 

This is one of the main indicators for my reviews, excellent the attentiveness of the developer to implement suggestions for improvements, great job!

are1971
747
are1971 2022.08.20 16:33 
 

Very usefull indicator

Produits recommandés
Was: $249  Now: $99   Market Profile defines a number of day types that can help the trader to determine market behaviour. A key feature is the Value Area, representing the range of price action where 70% of trading took place. Understanding the Value Area can give traders valuable insight into market direction and establish the higher odds trade. It is an excellent addition to any system you may be using. Inspired by Jim Dalton’s book “Mind Over Markets”, this indicator is designed to suit the
Delta Profile Volume
Teresinha Moraes Correia
Technical Description of the Indicator – Delta Profile for MetaTrader 5 The Delta Profile is an indicator developed for MetaTrader 5 focused on detailed analysis of volume flow within a defined range of candles. It organizes and displays information about the imbalance of positive volumes (associated with upward movements) and negative volumes (associated with downward movements) at different price levels. The result is a clear view of the chart points where the highest concentration of trades o
Advanced Volume Profile Analysis Tool for MetaTrader 5 The Kecia Volume Profile Order Finder provides traders with volume profile analysis capabilities. This MT5 indicator combines volume profile visualization with statistical calculations to help identify potential trading opportunities and suggests entry, stop loss, and take profit levels based on market structure. Market Profile Visualization Transform your chart with customizable volume profile visualizations: Multiple visualization options
ALIEN Dashboard
Youssef Esseghaiar
ALIEN DASHBOARD FULL EDITION – Professional ICT & Precision Trading Dashboard for MT5 ( HYBRID ENGINE ) Overview The   Alien Dashboard Full Edition   is a comprehensive, all‑in‑one technical indicator for MetaTrader 5 that merges the most powerful concepts from Inner Circle Trader (ICT) methodology with advanced precision‑entry logic, multi‑timeframe analysis, and an intuitive on‑chart dashboard. Designed for serious traders who want to visualise institutional order flow, identify high‑probabili
L'indicateur SMC Venom Model BPR est un outil professionnel pour les traders travaillant dans le concept Smart Money (SMC). Il identifie automatiquement deux modèles clés sur le graphique des prix: FVG   (Fair Value Gap) est une combinaison de trois bougies, dans laquelle il y a un écart entre la première et la troisième bougie. Forme une zone entre les niveaux où il n'y a pas de support de volume, ce qui conduit souvent à une correction des prix. BPR   (Balanced Price Range) est une combinaiso
Mirror Chart MT5
Andrej Hermann
5 (1)
The Mirror Chart MT5 is a overlay indicator specifically designed to project a second financial instrument directly onto the main chart window. This tool is invaluable for traders who rely on correlation analysis, as it visualizes the price movements of two different instruments in real time. Unlike traditional overlays, this indicator utilizes intelligent, dynamic centering and scaling logic. It continuously analyzes the visible price range in the current window for both symbols and calculates
FREE
Time and Sales Tick
Pablo Filipe Soares De Almeida
Time & Sales Tick Indicator est un indicateur pour MetaTrader 5 qui affiche les données de ticks en temps réel. Il montre le prix, le volume des ticks et l’heure directement sur le graphique. Fonctionnalités Affiche les données de ticks (prix, volume et heure) dans un panneau sur le graphique. Regroupe les ticks selon des intervalles définis par l’utilisateur, avec un code couleur (vert pour la hausse, rouge pour la baisse). Le panneau peut être positionné dans n’importe quel coin du graphique.
L'indicateur construit les cotations actuelles, qui peuvent être comparées aux cotations historiques et, sur cette base, faire une prévision de l'évolution des prix. L'indicateur dispose d'un champ de texte pour une navigation rapide jusqu'à la date souhaitée. Option : Symbole - sélection du symbole que l'indicateur affichera ; SymbolPeriod - sélection de la période à partir de laquelle l'indicateur prendra des données ; IndicatorColor - couleur de l'indicateur ; HorisontalShift - décalage
Price Magnet — Price Density and Attraction Levels Indicator Price Magnet is a professional analytical tool designed to identify key support and resistance levels based on statistical Price Density. The indicator analyzes a specified historical period and detects price levels where the market spent the most time. These zones act as “magnets,” attracting price action or forming a structural base for potential reversals. Unlike traditional Volume Profile tools, Price Magnet focuses on price-time d
Crash 1000 Scalping Indicator for the Crash 1000 Deriv Synthetic Index. Introduction The Crash 1000 Scalping Indicator is a specialized tool designed for the Crash 1000 index on the Deriv Synthetic market. This indicator is particularly useful for scalping on the M1 timeframe, helping traders to identify precise entry and exit points for buy positions. It is designed to be non-repainting, providing clear signals with audible alerts and push notifications, and is compatible with mobile devices th
Cumulative Volume Delta MA-X MTF (avec Momentum de Gradient) Cet indicateur effectue une analyse multi-temporelle du Delta de Volume Cumulé (CVD) pour MetaTrader 5. Il calcule la différence nette entre la pression acheteuse et vendeuse en analysant les données de volume réel ou de ticks, offrant ainsi une représentation visuelle du sentiment du flux d'ordres. Logique et Fonctionnalités de l'Indicateur L'indicateur utilise une approche mathématique pour l'analyse du volume : Sources de Données :
Aura Smc Quantum H4
Chaibadee Dechtanankul
AURA SMC QUANTUM V1.01 code in English, structured for a professional presentation or MQL5 Market description: AURA SMC QUANTUM V1.01 | Logic Breakdown The Aura SMC Quantum is an advanced automated trading system (EA) specifically engineered for Gold (XAUUSD) on the H4 timeframe. It combines high-probability Smart Money Concepts (SMC) with a sophisticated Hybrid Grid management system. 1. Market Analysis Strategy (SMC & Trend Filter) The core "intelligence" of the EA relies on a dual-layer confi
Smart Imbalance Edge: Decode Institutional Footprints and Market Momentum The market doesn't move randomly. Its direction and structural shifts are driven by major players—institutional capital, banks, and hedge funds. Smart Imbalance Edge is an advanced, analytical MetaTrader 5 tool designed to help you spot these institutional footprints and measure the true force behind their actions. This isn't just another standard "ZigZag" indicator that blindly connects highs and lows. This algorithm sc
Order Book, known also as Market Book, market depth, Level 2, - is a dynamically updated table with current volumes of orders to buy and to sell specific financial instument at price levels near Bid and Ask. MetaTrader 5 provides the means for receiving market book from your broker, but in real time only, without access to its history. The indicator OrderBook Cumulative Indicator accumulates market book data online and visualizes them on the chart. In addition, the indicator can show the market
Le niveau Premium est un indicateur unique avec une précision de plus de 80 % des prédictions correctes ! Cet indicateur a été testé par les meilleurs Trading Specialists depuis plus de deux mois ! L'indicateur de l'auteur que vous ne trouverez nulle part ailleurs ! À partir des captures d'écran, vous pouvez constater par vous-même la précision de cet outil ! 1 est idéal pour le trading d'options binaires avec un délai d'expiration de 1 bougie. 2 fonctionne sur toutes les paires de devises
Visual CrossPulse Dynamics Indicator
AL MOOSAWI ABDULLAH JAFFER BAQER
Visual CrossPulse Dynamics: Trade with the Market's True Rhythm Unlock a new level of market insight with Visual CrossPulse Dynamics, a sophisticated trading indicator designed to adapt to ever-changing volatility and reveal the true direction of the trend. Are you tired of indicators that lag in fast-moving markets or give false signals during consolidation? The Visual CrossPulse Dynamics indicator solves this problem by using an advanced, adaptive algorithm that intelligently adjusts to the m
Donchian Breakout And Rsi
Mattia Impicciatore
4.5 (2)
Description générale Cet indicateur est une version améliorée du Canal Donchian classique, enrichie de fonctionnalités pratiques pour le trading réel. En plus des trois lignes standard (supérieure, inférieure et ligne médiane), le système détecte les cassures et les affiche visuellement avec des flèches sur le graphique, en montrant uniquement la ligne opposée à la direction actuelle de la tendance pour une lecture plus claire. L’indicateur comprend : Signaux visuels : flèches colorées lors des
FREE
What Is Trend Master Pro? Trend Master Pro   is a professional-grade trend trading indicator built for MetaTrader 5. It was designed with one goal in mind — to keep you on the right side of the market at all times by combining three powerful technical tools into a single, clean, easy-to-read display directly on your price chart. Instead of cluttering your screen with multiple separate indicators, Trend Master Pro fuses an   EMA Ribbon trend filter , a   ZigZag swing point engine , and a   breako
RSI Currency Strength Meter is a powerful and elegant multi-currency indicator that measures the real-time relative strength of the 8 major currencies using RSI logic. By calculating the smoothed performance of each currency across its major pairs and applying the RSI formula, it delivers clean and responsive strength lines that make it easy to spot which currencies are truly strong or weak at any moment. This indicator is particularly useful for visualizing currency correlations and divergence
CosmiCLab SMC FIBO CosmiCLab SMC FIBO is a professional trading indicator designed for traders who use Smart Money Concepts (SMC), market structure analysis and Fibonacci retracement levels. The indicator automatically detects market swings and builds Fibonacci levels based on the latest impulse movement. It also identifies market structure changes such as BOS (Break of Structure) and CHOCH (Change of Character), helping traders understand the current market direction. CosmiCLab SMC FIBO also pr
No Demand No Supply MT5
Trade The Volume Waves Single Member P.C.
No Demand No Supply   This indicator identifies   No Demand –No Supply candles to your chart and plots volume bars colored according to the signal. It can be applied to all timeframes or to a specific one only. It can also be used as regular volume indicator  with exceptional future of WEIGHTED VOLUME. Furthermore is has an alert notification, sound and email when a signals occurs. The indicator does not repaint but the alert will come on two candles back due to the definition of No Demand No Su
Visual Tiger Speed Indicator
AL MOOSAWI ABDULLAH JAFFER BAQER
Visual Tiger Speed Indicator: Unleash the Power of Market Velocity For just a one-time payment of $30, gain a lifetime edge in identifying explosive market moves before they happen. Are you tired of lagging indicators that only show you what has already occurred? The Visual Tiger Speed Indicator is a next-generation tool designed to measure the true, unfiltered velocity of price action, giving you a unique advantage in any market condition. It moves beyond simple price analysis to decode the mo
Noize Absorption Index - is the manual trading system that measures the difference of pressure between bears forces and bulls forces. Green line - is a noize free index that showing curent situation. Zero value of index shows totally choppy/flat market.Values above zero level shows how powerfull bullish wave is and values below zero measures bearish forces.Up arrow appears on bearish market when it's ready to reverse, dn arrow appears on weak bullish market, as a result of reverse expectation.
Value Chart Candlesticks
Flavio Javier Jarabeck
4.57 (14)
The idea of a Value Chart indicator was presented in the very good book I read back in 2020 , " Dynamic Trading Indicators: Winning with Value Charts and Price Action Profile ", from the authors Mark Helweg and David Stendahl. The idea is simple and the result is pure genius: Present candlestick Price analysis in a detrended way! HOW TO READ THIS INDICATOR Look for Overbought and Oversold levels. Of course, you will need to test the settings a lot to find the "correct" one for your approach. It
FREE
Phantom Edge SMC
Nattapon Chuekamhod
Phantom Edge SMC — The Ultimate Smart Money Indicator for MT5 Tired of manually drawing structures while trading SMC or ICT concepts? Let Phantom Edge SMC do the heavy lifting for you. Key Features Internal & Swing Structure: Automatically detects BOS and CHoCH across two structural levels. Order Blocks (OB): Identifies Internal and Swing OBs with automated mitigation tracking. Equal Highs / Lows: Highlights EQH / EQL to pinpoint Liquidity pools. Fair Value Gaps (FVG): Displays FVGs with
Volumes Direction MT5
William Oswaldo Mayorga Urduy
VOLUMES DIRECTION MT5 Normalement, l'indicateur de volume a un changement de couleur par défaut lorsque le volume actuel est plus élevé que le précédent, c'est important mais pas très utile. Pour cette raison, cet indicateur a été créé pour qu'en plus du volume normal, lorsque la bougie est haussière ou baissière, il les peint d'une couleur différente, par défaut bleu pour haussier et rouge pour baissier, mais ces couleurs peuvent être personnalisées selon le Le goût du commerçant. N'oubli
This indicator presents an alternative approach to identify Market Structure. The logic used is derived from learning material created by   DaveTeaches (on X) Upgrade v1.10: + add option to put protected high/low value to buffer (figure 11, 12) + add  Retracements  value to buffer when Show Retracements When quantifying Market Structure, it is common to use fractal highs and lows to identify "significant" swing pivots. When price closes through these pivots, we may identify a Market Structure S
Supply and Demand Pro
Godbless C Nygu
4 (1)
Join Deriv link on profile>>> GET THIS FULL COPY AND GET ANOTHER FREE INDICATOR ONE OF THE BEST AND USEFULL INDICATORS IN THE WORLD ..This is the one of the best usefull indicators which has chosen to be used by top traders in the world. AUTOMATIC SUPPORT AND RESISTANCE This way of trading is also called Supply and demand, On this way of trading you can see auto colours appear where the market changes direction buying or selling Direction. ALL KIND OF PAIRS METALS AND INDICIES ARE INCLUDED A
Your Trend Friend
Luigi Nunes Labigalini
5 (1)
The trend is your friend! Look at the color of the indicator and trade on that direction. It does not  repaint. After each candle is closed, that's the color of the trend. You can focus on shorter faster trends or major trends, just test what's most suitable for the symbol and timeframe you trade. Simply change the "Length" parameter and the indicator will automatically adapt. You can also change the color, thickness and style of the lines. Download and give it a try! There are big movements w
CVD SmoothFlow Pro
Thalles Nascimento De Carvalho
CVD SmoothFlow Pro - Analyse de Volume Illimitée pour Tout Actif ! CVD SmoothFlow Pro est la solution ultime pour les traders recherchant une analyse de volume précise et illimitée. En utilisant le calcul du Cumulative Volume Delta (CVD) avec un filtrage avancé du bruit, la version Pro offre la flexibilité et la précision nécessaires pour trader tout actif financier. Que propose CVD SmoothFlow Pro ? Analyse Claire : Filtre le bruit du marché et met en avant les mouvements de volume signifi
Les acheteurs de ce produit ont également acheté
ARIPoint
Temirlan Kdyrkhan
1 (1)
ARIPoint is a powerful trading companion designed to generate high-probability entry signals with dynamic TP/SL/DP levels based on volatility. Built-in performance tracking shows win/loss stats, PP1/PP2 hits, and success rates all updated live. Key Features: Buy/Sell signals with adaptive volatility bands Real-time TP/SL/DP levels based on ATR Built-in MA Filter with optional ATR/StdDev volatility Performance stats panel (Success, Profit/Loss, PP1/PP2) Alerts via popup, sound, push, or email Cu
SuperScalp Pro
Van Minh Nguyen
4.63 (24)
SuperScalp Pro – Système avancé d’indicateur de scalping multi-filtres SuperScalp Pro est un indicateur de scalping avancé qui combine le Supertrend classique avec plusieurs filtres de confirmation intelligents afin d’identifier les opportunités de trading. Il fonctionne efficacement sur plusieurs unités de temps, de M1 à H4, avec des performances optimisées sur XAUUSD, BTCUSD et les principales paires Forex. L’indicateur fournit des signaux d’achat et de vente clairs, ainsi que des niveaux d’en
Divergence Bomber
Ihor Otkydach
4.9 (89)
Chaque acheteur de cet indicateur reçoit également gratuitement : L’outil exclusif « Bomber Utility », qui accompagne automatiquement chaque opération de trading, fixe les niveaux de Stop Loss et de Take Profit, et clôture les positions selon les règles de la stratégie Des fichiers de configuration (set files) pour adapter l’indicateur à différents actifs Des set files pour configurer le Bomber Utility selon différents modes : « Risque Minimum », « Risque Équilibré » et « Stratégie d’Attente » U
Entry In The Zone and SMC Multi Timeframe is a real-time 2-in-1 market analysis tool that combines market structure analysis and a No Repaint BUY / SELL signal system into a single indicator, built on Smart Money Concepts (SMC) — a widely adopted framework used by professional traders to understand market structure. This indicator helps you see the market more clearly, make decisions based on structure rather than guesswork, and focus on high-probability zones where price is more likely to react
Power Candles MT5
Daniel Stein
5 (8)
Power Candles V3 - Indicateur de force à optimisation automatique Power Candles V3 transforme la force des devises et des instruments en un plan de trading exploitable sur chaque graphique auquel il est associé. Au lieu de se contenter de colorer les bougies, il effectue une optimisation automatique en temps réel en arrière-plan et vous fournit les meilleurs niveaux de Stop Loss, Take Profit et seuils de signal pour le symbole que vous avez sous les yeux. Un simple clic suffit pour l'adopter en
Si vous achetez cet indicateur, vous recevrez mon Gestionnaire de Trading Professionnel + EA  GRATUITEMENT. Tout d'abord, il convient de souligner que ce système de trading est un indicateur non repeint, non redessiné et non retardé, ce qui le rend idéal pour le trading manuel et automatisé. Cours en ligne, manuel et téléchargement de préréglages. Le "Système de Trading Smart Trend MT5" est une solution de trading complète conçue pour les traders débutants et expérimentés. Il combine plus de 10
SignalTech MT5 is a fully rule based trading system for EURUSD, USDCHF, USDJPY, AUDUSD, NZDUSD, EURJPY, AUDJPY, NZDJPY, CADJPY.  All the winning trades with chart setups are published on the comments page. 2025-12 1174 Pips 2026-01 2624 Pips 2026-02 2937 Pips 2026-03 2165 Pips 2026-04 2243 Pips It can generate signals with Buy/Sell Arrows and Pop-Up/Sound Alerts. Each signal has clear Entry and Stop Loss levels, which should be automatically flagged on the chart, as well as potential Targets 1,
Gann Made Easy   est un système de trading Forex professionnel et facile à utiliser qui est basé sur les meilleurs principes de trading en utilisant la théorie de mr. WD Gann. L'indicateur fournit des signaux d'ACHAT et de VENTE précis, y compris les niveaux Stop Loss et Take Profit. Vous pouvez échanger même en déplacement en utilisant les notifications PUSH. VEUILLEZ ME CONTACTER APRÈS L'ACHAT POUR RECEVOIR GRATUITEMENT DES INSTRUCTIONS DE TRADING ET D'EXCELLENTS INDICATEURS SUPPLÉMENTAIRES! V
Présentation       Quantum Breakout PRO   , l'indicateur révolutionnaire MQL5 qui transforme la façon dont vous négociez les zones d'évasion ! Développé par une équipe de traders expérimentés avec une expérience commerciale de plus de 13 ans,       Évasion quantique PRO       est conçu pour propulser votre parcours commercial vers de nouveaux sommets grâce à sa stratégie de zone de discussion innovante et dynamique. Quantum Breakout Indicator vous donnera des flèches de signalisation sur les z
Azimuth Pro
Ottaviano De Cicco
5 (7)
Azimuth Pro V2: Synthetic Fractal Structure and Confirmed Entries for MT5 Overview Azimuth Pro is a multi-level swing structure indicator by Merkava Labs . Four nested swing layers, swing-anchored VWAP, ABC pattern detection, three-timeframe structural filtering, and closed-bar confirmed entries — one chart, one workflow from micro-swings to macro-cycles. This is not a blind signal product. It is a structure-first workflow for traders who care about location, context, and timing. V2 Launch Offe
Tout d'abord, il convient de souligner que cet outil de trading est un indicateur non repeint, non redessiné et non retardé, ce qui le rend idéal pour le trading professionnel. Cours en ligne, manuel utilisateur et démonstration. L'indicateur Smart Price Action Concepts est un outil très puissant à la fois pour les nouveaux et les traders expérimentés. Il regroupe plus de 20 indicateurs utiles en un seul, combinant des idées de trading avancées telles que l'analyse du trader Inner Circle et le
Commençons par être honnêtes. Aucun indicateur ne vous rendra rentable à lui seul. Si quelqu’un vous dit le contraire, il vous vend un rêve. Tout indicateur qui affiche des flèches parfaites d’achat/vente peut être rendu impeccable — il suffit de zoomer sur la bonne partie de l’historique et de capturer uniquement les trades gagnants. Nous ne faisons pas cela.  SMC Intraday Formula est un outil. Il lit la structure du marché pour vous, identifie les zones de prix à la probabilité la plus élevée
RelicusRoad Pro MT5
Relicus LLC
4.96 (24)
RelicusRoad Pro : Système d'Exploitation Quantitatif du Marché 70% DE RÉDUCTION ACCÈS À VIE (DURÉE LIMITÉE) - REJOIGNEZ 2 000+ TRADERS Pourquoi la plupart des traders échouent-ils même avec des indicateurs "parfaits" ? Parce qu'ils tradent des concepts isolés dans le vide. Un signal sans contexte est un pari. Pour gagner, il faut de la CONFLUENCE . RelicusRoad Pro est un Écosystème Quantitatif complet . Il cartographie la "Fair Value Road", distinguant le bruit des cassures structurelles. Arrête
Meridian Pro
Ottaviano De Cicco
5 (2)
Meridian Pro 2.00: Professional Multi-Timeframe Trend Matrix for MT5 Meridian Pro 2.00 is a professional adaptive trend matrix for MetaTrader 5. It combines the original Meridian trend engine, a clean chart ribbon, closed-bar signal arrows, an 8-timeframe dashboard, Fuel momentum, weighted consensus, synthetic HTF processing and chart-native higher-timeframe context lines. The goal is simple: read current trend, multi-timeframe structure, strength, momentum and EA-ready state from one discipline
Quantum TrendPulse
Bogdan Ion Puscasu
5 (25)
Présentation de   Quantum TrendPulse   , l'outil de trading ultime qui combine la puissance de   SuperTrend   ,   RSI   et   Stochastic   dans un seul indicateur complet pour maximiser votre potentiel de trading. Conçu pour les traders qui recherchent précision et efficacité, cet indicateur vous aide à identifier les tendances du marché, les changements de dynamique et les points d'entrée et de sortie optimaux en toute confiance. Caractéristiques principales : Intégration SuperTrend :   suivez f
FX Trend MT5 NG
Daniel Stein
5 (4)
FX Trend NG : La Nouvelle Génération d’Intelligence de Tendance Multi-Marchés Vue d’ensemble FX Trend NG est un outil professionnel d’analyse de tendance multi-timeframe et de surveillance des marchés. Il vous permet de comprendre la structure complète du marché en quelques secondes. Au lieu de naviguer entre de nombreux graphiques, vous identifiez immédiatement quels instruments sont en tendance, où le momentum s’affaiblit et où plusieurs unités de temps sont alignées. Offre de Lancement – Ob
Atomic Analyst MT5
Issam Kassas
3.94 (31)
Tout d'abord, il convient de souligner que cet indicateur de trading n'est ni repainting, ni redrawing et ne présente aucun délai, ce qui le rend idéal à la fois pour le trading manuel et automatisé. Manuel de l'utilisateur : réglages, entrées et stratégie. L'Analyste Atomique est un indicateur d'action sur les prix PA qui utilise la force et le momentum du prix pour trouver un meilleur avantage sur le marché. Équipé de filtres avancés qui aident à éliminer les bruits et les faux signaux, et à
FX Power MT5 NG
Daniel Stein
5 (31)
FX Power : Analysez la force des devises pour des décisions de trading plus intelligentes Aperçu FX Power est l'outil essentiel pour comprendre la force réelle des principales devises et de l'or, quelles que soient les conditions du marché. En identifiant les devises fortes à acheter et les faibles à vendre, FX Power simplifie vos décisions de trading et révèle des opportunités à forte probabilité. Que vous suiviez les tendances ou anticipiez les retournements à l'aide de valeurs extrêmes de D
KT Alpha Hunter Arrows MT5
KEENBASE SOFTWARE SOLUTIONS
La plupart des indicateurs à flèches vous donnent un signal, puis vous laissent gérer tout le reste seul. KT Alpha Hunter Arrows vous fournit un plan de trading complet. Chaque flèche de signal apparaît avec un plan complet déjà tracé : ligne d’entrée, stop loss, quatre niveaux de take profit et un verdict d’edge en temps réel qui vous indique si ce symbole et cette unité de temps valent la peine d’être tradés maintenant. Le Trade Manager EA inclus prend en charge l’exécution après votre entrée,
Market Structure Order Block Dashboard MT5 est un indicateur MT5 conçu pour les traders qui veulent lire la structure de marché et les principales zones de réaction du prix directement sur le graphique. Il combine BOS, ChoCH, Order Blocks, Fair Value Gaps (FVG), Liquidité, Kill Zones, Volume Profile, et un dashboard compact pour une analyse rapide. Cet indicateur s'adresse aux traders qui utilisent la structure de marché, les concepts ICT et Smart Money comme cadre de décision. Il peut aider à r
Btmm state engine pro
Garry James Goodchild
5 (4)
BTMM State Engine Pro is a MetaTrader 5 indicator for traders who use the Beat The Market Maker approach: Asian session context, kill zone timing, level progression, peak formation detection, and a multi-pair scanner from a single chart. It combines cycle state logic with a built-in scanner dashboard so you do not need the same tool on many charts at once. What it does Draws the Asian session range; session times can follow broker server offset or be set in inputs. Tracks level progression (L
Trend Screener Pro MT5
STE S.S.COMPANY
4.85 (104)
Indicateur de tendance, solution unique révolutionnaire pour le trading et le filtrage des tendances avec toutes les fonctionnalités de tendance importantes intégrées dans un seul outil ! Il s'agit d'un indicateur multi-période et multi-devises 100 % non repeint qui peut être utilisé sur tous les symboles/instruments : forex, matières premières, crypto-monnaies, indices et actions. Trend Screener est un indicateur de suivi de tendance efficace qui fournit des signaux de tendance fléchés avec des
Grabber System MT5
Ihor Otkydach
4.83 (23)
Je vous présente un excellent indicateur technique : Grabber, qui fonctionne comme une stratégie de trading "tout-en-un", prête à l'emploi. En un seul code sont intégrés des outils puissants d'analyse technique du marché, des signaux de trading (flèches), des fonctions d'alerte et des notifications push. Chaque acheteur de cet indicateur reçoit également gratuitement : L'utilitaire Grabber : pour la gestion automatique des ordres ouverts Un guide vidéo étape par étape : pour apprendre à installe
Top indicator for MT5   providing accurate signals to enter a trade without repainting! It can be applied to any financial assets:   forex, cryptocurrencies, metals, stocks, indices .  Watch  the video  (6:22) with an example of processing only one signal that paid off the indicator! MT4 version is here It will provide pretty accurate trading signals and tell you when it's best to open a trade and close it. Most traders improve their trading results during the first trading week with the help of
Trend Forecaster
Alexey Minkov
5 (7)
Trend Forecaster – Since 2023. The Trend Forecaster indicator utilizes a unique proprietary algorithm to determine entry points for a breakout trading strategy. The indicator identifies price clusters, analyzes price movement near levels, and provides a signal when the price breaks through a level. The Trend Forecaster indicator is suitable for all financial assets, including currencies (Forex), metals, stocks, indices, and cryptocurrencies. You can also adjust the indicator to work on any time
Ce tableau de bord affiche les derniers   modèles harmoniques   disponibles pour les symboles sélectionnés, ce qui vous permettra de gagner du temps et d'être plus efficace /   version MT4 . Indicateur gratuit:   Basic Harmonic Pattern Colonnes de l'indicateur Symbol :   les symboles sélectionnés apparaissent Trend   :   haussière ou baissière Pattern :   type de motif (gartley, papillon, chauve-souris, crabe, requin, cypher ou ABCD) Entry:   prix d'entrée SL:   prix du stop loss TP1:   1er
TREND LINES PRO   Cet indicateur permet de comprendre les véritables changements de direction du marché. Il révèle les renversements de tendance et les points de retour des principaux acteurs. Tu vois   Lignes BOS   Détection des changements de tendance et des niveaux clés sur des unités de temps supérieures, sans paramètres complexes ni interférences inutiles. Les signaux restent affichés sur le graphique même après la fermeture de la bougie. Version MT4   -   Révèle son potentiel maximal lorsq
RFI levels PRO MT5
Roman Podpora
3.67 (3)
L'indicateur montre avec précision les points de retournement et les zones de retour des prix où le       Acteurs majeurs   . Vous repérez les nouvelles tendances et prenez des décisions avec une précision maximale, en gardant le contrôle de chaque transaction. VERSION MT4     -    Révèle son potentiel maximal lorsqu'il est combiné à l'indicateur   TREND LINES PRO Ce que l'indicateur montre : Structures et niveaux d'inversion avec activation au début d'une nouvelle tendance. Affichage des nivea
Super Signal Market Slayer Sans repaint | Haute précision | Indicateur de tendance intelligent multi-marchés En trading, la vraie difficulté n’est pas de passer un ordre, mais de distinguer clairement le début d’une tendance dans le bruit du marché. C’est pour cette raison que Market Slayer a été conçu. Il s’agit d’un indicateur intelligent sans repaint, spécialement développé pour le trading intraday. Grâce à une confirmation multi-niveaux et à un filtrage de tendance, il ne fournit des signau
OmniSync Projection
Antonio-alin Teculescu
5 (1)
Chronos Fractal Engine is an innovative price projection indicator for MetaTrader 5, designed to transform your technical analysis by intelligently identifying and projecting historical price patterns. Built upon an advanced correlation algorithm and the fractal principles of the market, this powerful tool visualizes potential future price movements, giving you a unique edge in your trading decisions. What is Chronos Fractal Engine? At its core, the Chronos Fractal Engine employs a sophisticat
Plus de l'auteur
ZigZag Lines MTF
Taras Slobodyanik
4.38 (13)
Multi timeframe ZigZag indicator. It displays the support/resistance horizontal lines and their breakouts, as well as draws the current targets of the market. It can also display lines of the Fractals indicator and candles from other periods (up to Quarterly). So, you can actually see the supply and demand levels. Indicator – connects key lows and highs to show trend lines. You can also use it as indicator for the Break of Structure(BOS) & Market Structure Shift(MSS). The indicator redraws the
The indicator has three main tools: Magnifier (Zoom chart), Ruler  ( Time and Price scales ),   and Crosshair. You can move it all around with your mouse and customize different formats for  displaying , customize   size and color of each element. The Magnifier (zoom chart) allows you to display candles from any time frame and at different scales. Hotkeys: 'Q' - higher timeframe, 'A' - lower timeframe, 'W' - decrease candle size, 'S' - increase candle size, 'Z' - show/hide zoom chart. You can
MACD Dashboard
Taras Slobodyanik
5 (2)
Multi-currency and multi-timeframe indicator MACD. The dashboard can display both the Traditional (true) MACD and the MACD which is built into MetaTrader. On the panel you can see the current state of the indicator — the direction of movement of the MACD lines, their intersection and a pop-up window with the indicator chart. In the parameters you can specify any desired pairs-symbols and timeframes. The scanner can also send notifications about lines crossing each other and about lines crossing
Time Scale for MT5
Taras Slobodyanik
4.77 (30)
The indicator draws the time scale on the chart. You can specify the time offset, adjust the size and font to display on the chart ( it is displaying your local time on your chart instead of MT time ). You can also select the desired format for displaying the date and time. You may be interested in my other product , which contains a more advanced version of the Time Scale . You can also find my other products here . Parameters Hours (time shift) — time shift (hours); Minutes (time shift) — tim
FREE
CCI Dashboard for MT5
Taras Slobodyanik
5 (1)
Multicurrency and multitimeframe modification of the Commodity Channel Index (CCI) indicator. You can specify any desired currencies and timeframes in the parameters. Also, the panel can send notifications when crossing overbought and oversold levels. By clicking on a cell with a period, this symbol and period will be opened. This is MTF Scanner. The key to hide the dashboard from the chart is "D" by default. Parameters CCI Period  — averaging period. CCI Applied price  — price type. Clear th
MA Dashboard MT5
Taras Slobodyanik
5 (4)
Modification multidevises et multitemporelles de l'indicateur Moving Average (MA). Sur le tableau de bord, vous pouvez voir l'état actuel de l'indicateur - les cassures et les touches (par prix) du Fast MA et du Slow MA, ainsi que l'intersection des lignes MA entre elles (croisement de moyenne mobile). Dans les paramètres, vous pouvez spécifier les devises et les délais souhaités. En outre, l'indicateur peut envoyer des notifications sur le prix touchant les lignes et sur leur franchissement. E
ZigZag Lines MTF for MT5
Taras Slobodyanik
5 (11)
Multi timeframe ZigZag indicator. It displays the support/resistance horizontal lines and their breakouts, as well as draws the current targets of the market. It can also display lines of the Fractals indicator and candles from other periods (up to Quarterly). So, you can actually see the supply and demand levels. Indicator – connects key lows and highs to show trend lines. You can also use it as indicator for the Break of Structure(BOS) & Market Structure Shift(MSS). The indicator redraws the
Multi-currency and multitimeframe Heikin Ashi indicator. Shows the current state of the market. On the scanner panel you can see the direction, strength and number of bars of the current trend. The Consolidation/Reversal candles are also shown using color. You can specify any desired currencies and periods in the parameters. Also, the indicator can send notifications when the trend changes or when reversal and consolidation candles (dojis) appear. By clicking on a cell, this symbol and period wi
Lines Profit Loss MT5
Taras Slobodyanik
4.62 (13)
L'indicateur affiche le profit (la perte) sur le symbole actuel. Vous pouvez librement faire glisser et déposer la ligne pour afficher le profit ou la perte actuel. Vous pouvez retrouver mes produits   ici . Paramètres Calculation in money or in points — calculez le profit/la perte en points ou en argent. Add pending orders to calculate — prenez en compte les commandes en attente dans les calculs. Magic Number (0 - all orders on symbol) — nombre magique, s'il est nécessaire d'évaluer des com
FREE
ZigZag Dashboard for MT5
Taras Slobodyanik
5 (4)
Multicurrency and multitimeframe modification of the ZigZag indicator. Displays the current direction of the market, the height of the last movement, the number of bars in this movement and the breaking of the previous point of the ZigZag (horizontal line). This is MTF Scanner, you can actually see the supply and demand levels. You can specify any desired currencies and timeframes in the parameters. Also, the panel can send notifications when the ZigZag changes direction or when there was a br
Symbol Manager for MT5
Taras Slobodyanik
5 (3)
Symbol Manager or Grid Manager, designed to group orders into one position (by Symbol or by Magic Number). This utility will be useful to multi-currency traders (many EAs), who can have multiple orders on several pairs. You will be able to see the total number of lots, the total profit, and set virtual stop loss and virtual take profit. To set a real TP (or SL), you must first set the virtual value, and then enter the command in this cell: "set". If you want to set real TP/SL for all orders at
Symbol Manager
Taras Slobodyanik
5 (4)
Symbol Manager or Grid Manager, designed to group orders into one position (by Symbol or by Magic Number). This utility will be useful to multi-currency traders (many EAs), who can have multiple orders on several pairs. You will be able to see the total number of lots, the total profit, and set virtual stop loss and virtual take profit. To set a real TP (or SL), you must first set the virtual value, and then enter the command in this cell: "set". If you want to set real TP/SL for all orders at
Modification multidevises et multitemporelles de l’indicateur Relative Strength Index (RSI). Vous pouvez spécifier les devises et les délais souhaités dans les paramètres. En outre, le panneau peut envoyer des notifications lors du franchissement des niveaux de surachat et de survente. En cliquant sur une cellule avec un point, ce symbole et ce point seront ouverts. Il s'agit du scanner MTF. La clé pour masquer le tableau de bord du graphique est "D" par défaut. Semblable au Currency Strength
ADX Dashboard MT5
Taras Slobodyanik
5 (4)
L'indicateur ADX est utilisé pour déterminer la tendance et sa force. La direction du prix est indiquée par les valeurs +DI et -DI, ​​et la valeur ADX montre la force de la tendance. Si +DI est supérieur à -DI, ​​alors le marché est dans une tendance haussière, si au contraire, c'est une tendance baissière. Si l’ADX est inférieur à 20, il n’y a pas de direction définie. Dès que l'indicateur dépasse ce niveau, une tendance de force moyenne commence. Les valeurs supérieures à 40 indiquent une ten
Modification multidevises et multitemporelles de l’indicateur Relative Strength Index (RSI). Vous pouvez spécifier les devises et les délais souhaités dans les paramètres. En outre, le panneau peut envoyer des notifications lors du franchissement des niveaux de surachat et de survente. En cliquant sur une cellule avec un point, ce symbole et ce point seront ouverts. Il s'agit du scanner MTF. La clé pour masquer le tableau de bord du graphique est "D" par défaut. Semblable au Currency Strength
Modification multidevises et multitemporelles de l'oscillateur stochastique. Vous pouvez spécifier les devises et les délais souhaités dans les paramètres. Le panneau affiche les valeurs actuelles et les intersections des lignes — Signal et Principal (croisement stochastique). En outre, l'indicateur peut envoyer des notifications lors du franchissement des niveaux de surachat et de survente. En cliquant sur une cellule avec un point, ce symbole et ce point seront ouverts. Il s'agit du scanner M
Lines Profit Loss
Taras Slobodyanik
4.65 (17)
L'indicateur affiche le profit (la perte) sur le symbole actuel. Vous pouvez librement faire glisser et déposer la ligne pour afficher le profit ou la perte actuel. Vous pouvez retrouver mes produits ici . Paramètres Calculation in money or in points — calculez le profit/la perte en points ou en argent. Add pending orders to calculate — prenez en compte les commandes en attente dans les calculs. Magic Number (0 - all orders on symbol) — nombre magique, s'il est nécessaire d'évaluer des comman
FREE
MACD Dashboard MT5
Taras Slobodyanik
5 (2)
Multi-currency and multi-timeframe indicator MACD. The dashboard can display both the Traditional (true) MACD and the MACD which is built into MetaTrader. On the panel you can see the current state of the indicator — the direction of movement of the MACD lines, their intersection and a pop-up window with the indicator chart. In the parameters you can specify any desired pairs-symbols and timeframes. The scanner can also send notifications about lines crossing each other and about lines crossing
Pro Sessions MT4
Taras Slobodyanik
4.75 (4)
This is an indicator of trading sessions  that can display all levels (Open-High-Low-Close) for four sessions. The indicator can also predict session levels. Sessions can be drawn with lines or rectangles (empty or filled), lines can be extended to the next session. You can easily hide/show each session by pressing hotkeys (by default '1', '2', '3', '4'). You can see ASR (Average Session Range) lines  (default hotkey 'A'). This is similar to the ADR calculation, only it is calculated based on t
Time Scale
Taras Slobodyanik
4.87 (15)
The indicator draws the time scale on the chart. You can specify the time offset, adjust the size and font to display on the chart (it is displaying your local time on your chart instead of MT time). You can also select the desired format for displaying the date and time. While holding down the middle mouse button, and moving the cursor, a slider will appear on the scale. You may be interested in my other product , which contains a more advanced version of the Time Scale. You can also find my o
FREE
Multicurrency and multi-timeframe indicator Inside Bar (IB). In the parameters, you can specify any desired currencies and timeframes. The panel displays the last found Inside Bar (and Mother Bar) pattern, the current price position and the breakout of the levels of the Mother and Inside Bars. You can set the size and color for bars and text in the cells. The indicator can also send notifications when levels are broken. The dashboard highlights Double Inside Bar in a special color. By clicking
Levels of Timeframes
Taras Slobodyanik
5 (2)
L'indicateur affiche les niveaux haut/bas/ouverture/fermeture à partir d'autres périodes (et non standard) : année, 6 mois, 4 mois, 3 mois, 2 mois, mois, semaine, jour, heures H3-H6-H8-H12. . Vous pouvez également définir le décalage d'ouverture des bougies et créer des bougies virtuelles. Des « séparateurs de périodes » pour l'une de ces périodes sont disponibles sous forme de lignes verticales. Des alertes peuvent être configurées pour les cassures des niveaux actuels ou précédents (rupture d
Modification multidevises et multitemporelles de l'oscillateur stochastique. Vous pouvez spécifier les devises et les délais souhaités dans les paramètres. Le panneau affiche les valeurs actuelles et les intersections des lignes — Signal et Principal (croisement stochastique). En outre, l'indicateur peut envoyer des notifications lors du franchissement des niveaux de surachat et de survente. En cliquant sur une cellule avec un point, ce symbole et ce point seront ouverts. Il s'agit du scanner M
The indicator has three main tools: Magnifier (Zoom chart), Ruler  ( Time and Price scales ),   and Crosshair. You can move it all around with your mouse and customize different formats for  displaying , customize   size and color of each element. The Magnifier (zoom chart) allows you to display candles from any time frame and at different scales. Hotkeys: 'Q' - higher timeframe, 'A' - lower timeframe, 'W' - decrease candle size, 'S' - increase candle size, 'Z' - show/hide zoom chart You can
L'indicateur affiche les niveaux haut/bas/ouverture/fermeture à partir d'autres périodes (et non standard) : année, 6 mois, 4 mois, 3 mois, 2 mois, mois, semaine, jour, heures H3-H6-H8-H12. . Vous pouvez également définir le décalage d'ouverture des bougies et créer des bougies virtuelles. Des « séparateurs de périodes » pour l'une de ces périodes sont disponibles sous forme de lignes verticales. Des alertes peuvent être configurées pour les cassures des niveaux actuels ou précédents (rupture d
Pro Sessions MT5
Taras Slobodyanik
5 (1)
This is an indicator of trading sessions  that can display all levels (Open-High-Low-Close) for four sessions . The indicator can also predict session levels. Sessions can be drawn with lines or rectangles (empty or filled), lines can be extended to the next session. You can easily hide/show each session by pressing hotkeys (by default '1', '2', '3', '4'). You can see ASR (Average Session Range) lines  (default hotkey 'A'). This is similar to the ADR calculation, only it is calculated based on
MTF RSI for MT5
Taras Slobodyanik
Multi-timeframe indicator Relative Strength Index displays information simultaneously from different periods in one subwindow of the chart. Parameters Period of averaging — averaging period for the RSI calculation. Type of price — price used. Timeframes for RSI — list of periods, separated by a space or comma or semicolon. Number of bars for each period — the number of bars displayed for each period. Sort periods — sort periods if they are listed in no particular order. Current period first — d
Stochastic Oscillator displays information simultaneously from different periods in one subwindow of the chart. Parameters %K Period — K-period (number of bars for calculations). %D Period — D-period (period of first smoothing). Slowing — final smoothing. Method — type of smoothing. Price field — stochastic calculation method . Timeframes for Stochastic — list of periods, separated by a space or comma or semicolon. Number of bars for each period — the number of bars displayed for each period. S
This is the famous FX Sniper's T3 CCI indicator. It is a fixed version additionally containing search for classical and reverse (hidden) divergence. The classical divergence is displayed as a solid line, the reverse divergence is shown as a dotted line. Divergences are drawn in the indicator and on the chart (if you select the appropriate options). Parameters CCI Period — Commodity Channel Index indicator period CCI Type of price — price used for indicator calculation T3 Period — Sniper period
The indicator calculates the inclination angle between the Highs, Lows and Closes of adjacent bars. The angle can be measured in degrees or radians. A linear graph or a histogram is drawn in a subwindow. You can set the scale for the calculation — floating or fixed. For use in Expert Advisors or indicators, you need to specify a fixed scale. Parameters Angular measure — degrees or radians. Scale mode for calculation — scaling mode. Free scale — free transformation, the indicator will calculate
FREE
Filtrer:
marcello 981
117
marcello 981 2023.11.26 17:36 
 

This is one of the main indicators for my reviews, excellent the attentiveness of the developer to implement suggestions for improvements, great job!

are1971
747
are1971 2022.08.20 16:33 
 

Very usefull indicator

Edgar Duttweiler
639
Edgar Duttweiler 2018.08.19 21:57 
 

L'utilisateur n'a laissé aucun commentaire sur la note

Répondre à l'avis