OrderBook Cumulative Indicator
- Indicadores
-
Stanislav Korotky
 Trading is just my hobby. I'm working in IT industry. So developement of experts, indicators, and script is not a problem at all to me. Wide range of technologies are used: MQL4, MQL5, system and applied programming, web-services, neural networks and more.
New: - Versión: 1.4
- Actualizado: 27 mayo 2020
- Activaciones: 5
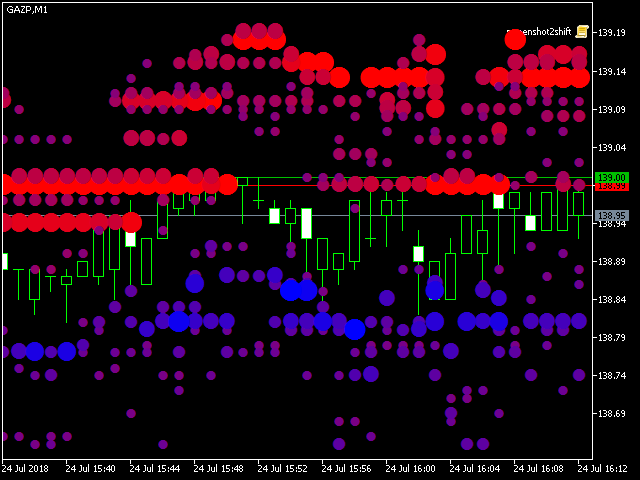
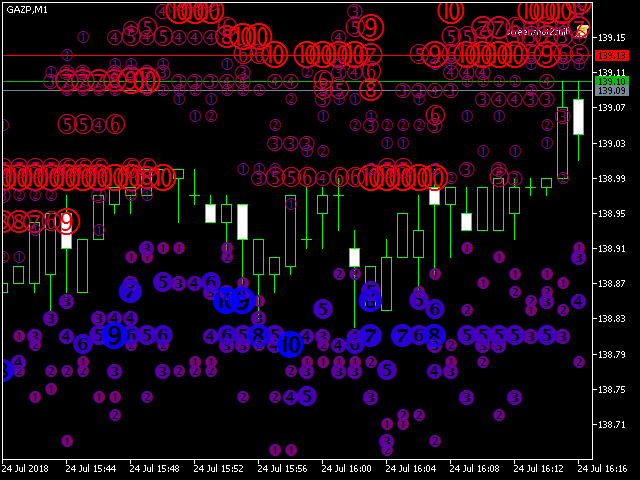
Libro de órdenes, también conocido como Libro de Mercado, profundidad de mercado, Nivel 2, - es una tabla actualizada dinámicamente con los volúmenes actuales de órdenes de compra y venta de un instrumento financiero específico a niveles de precios cercanos al Bid y Ask.
MetaTrader 5 proporciona los medios para recibir el libro de mercado de su corredor, pero sólo en tiempo real, sin acceso a su historia. El indicador OrderBook Cumulative Indicator acumula los datos del libro de mercado en línea y los visualiza en el gráfico. Además, el indicador puede mostrar el libro de mercado en la historia, mediante la lectura de datos de archivo, creado por OrderBook Recorder. El indicador se basa en la biblioteca OrderBook History Library, que se puede incrustar en su experto o indicador.
Los ficheros de archivo se pueden almacenar en la carpeta de datos del terminal (por lo general, se parece a C: Archivos de programa MetaQuotes MetaTrader 5), o en la carpeta de datos común para todos los terminales (por ejemplo, 'C: Usuarios'). En cualquier caso, dentro de la carpeta se utiliza otra subcarpeta como raíz para todos los libros de mercado, y el nombre de la subcarpeta se especifica en el parámetro de entrada OrderBook_FileFolder, por defecto - "Books". Dentro de la subcarpeta raíz se crea otro nivel de subcarpetas - cada subcarpeta corresponde a un símbolo de trabajo específico, y los datos de cada día se guardan en un archivo AAAAMMDD.hob, donde AAAA, MM, DD son año, mes, día correspondientemente. La extensión "hob" significa Historial del Libro de Órdenes. Por ejemplo, el ticker GAZP producirá los archivos MQL5/Archivos/Libros/GAZP/*.hob.
Parámetros
- ShowHistory - una opción para habilitar la vista del libro de mercado en el historial, basado en el archivo; por defecto, false - deshabilitado, es decir, el indicador recoge y muestra los datos en línea;
- ShowHistoryFrom - una fecha desde la que empezar a buscar en los archivos mientras se muestran los libros de mercado en el historial (cuando ShowHistory está habilitado);
- CharCode - un código de caracteres para mostrar las marcas del indicador; puede ser cualquier símbolo de la fuente Wingdings o -1; por defecto -1, lo que significa que se muestran viñetas numéricas con valores de 1 a 10, denotando el tamaño relativo del volumen;
- AveragingPeriod - periodo para promediar los valores del libro de mercado utilizando la media móvil exponencial, de forma continua; por defecto - 0, lo que significa que la acumulación y promediación de los datos se realiza por separado para cada barra; cuando se completa una barra, las estadísticas anteriores se descartan, y los volúmenes se promedian desde cero;
- OrderBook_FileFolder - nombre de la carpeta raíz, donde se almacenan las subcarpetas y archivos de los libros de mercado; por defecto - "Books"; cada subcarpeta se denomina según el símbolo de trabajo específico;
- OrderBook_UseCommonFiles - una opción para leer archivos de la carpeta de datos del terminal actual (falso, por defecto) o de la carpeta de datos común para todos los terminales (verdadero); utilice la carpeta común para las pruebas en el probador local;
- OrderBook_TimeZoneCorrection - corrección de fecha y hora, que se requiere en caso de que los archivos se lean en un terminal con una zona horaria diferente de la zona horaria del terminal donde se crearon los archivos; se especifica en segundos; por ejemplo, si el libro de mercado se guardó con la hora del servidor en GMT+3, y luego se aplica a las cotizaciones de un servidor, donde la hora está en GMT+2, la corrección debe ser de 1 hora (-3600 segundos), porque las horas en GMT+2 se retrasan 1 hora en comparación con (es decir, son 1 hora más pequeñas que la hora en GMT+2).es decir, son 1 hora más pequeñas que) GMT+3; 15:00 en GMT+3 son 14:00 en GMT+2;


Excellent tool.