Fibo Candle Previous for MT5

5
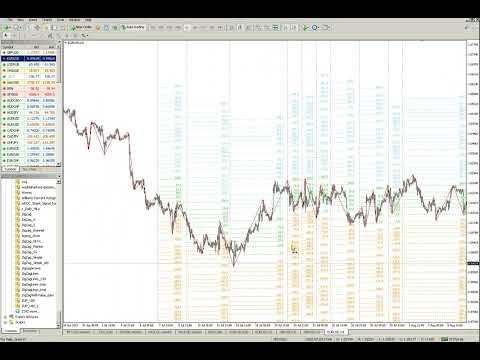
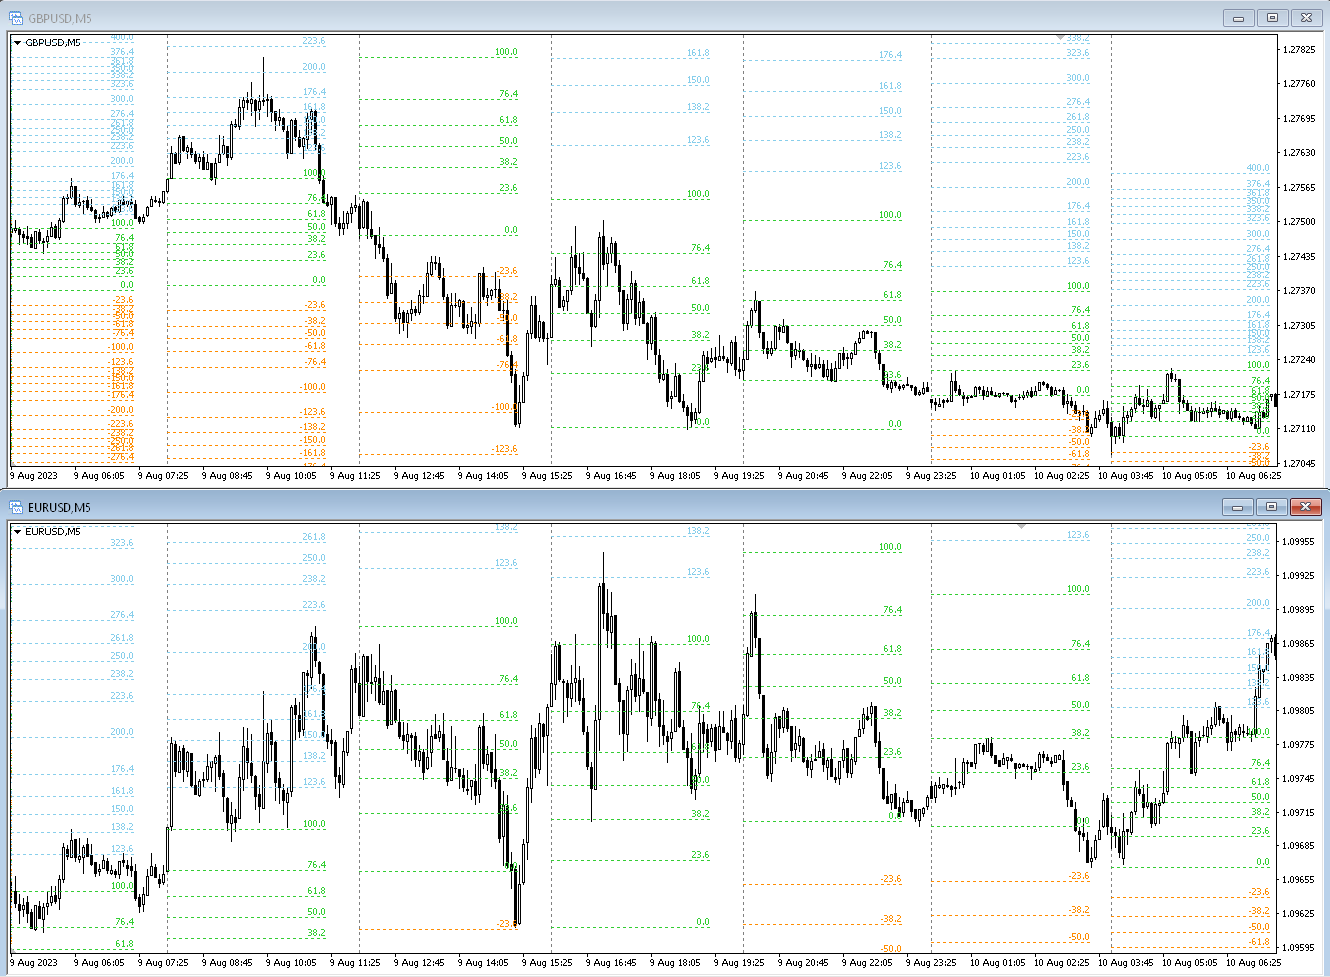
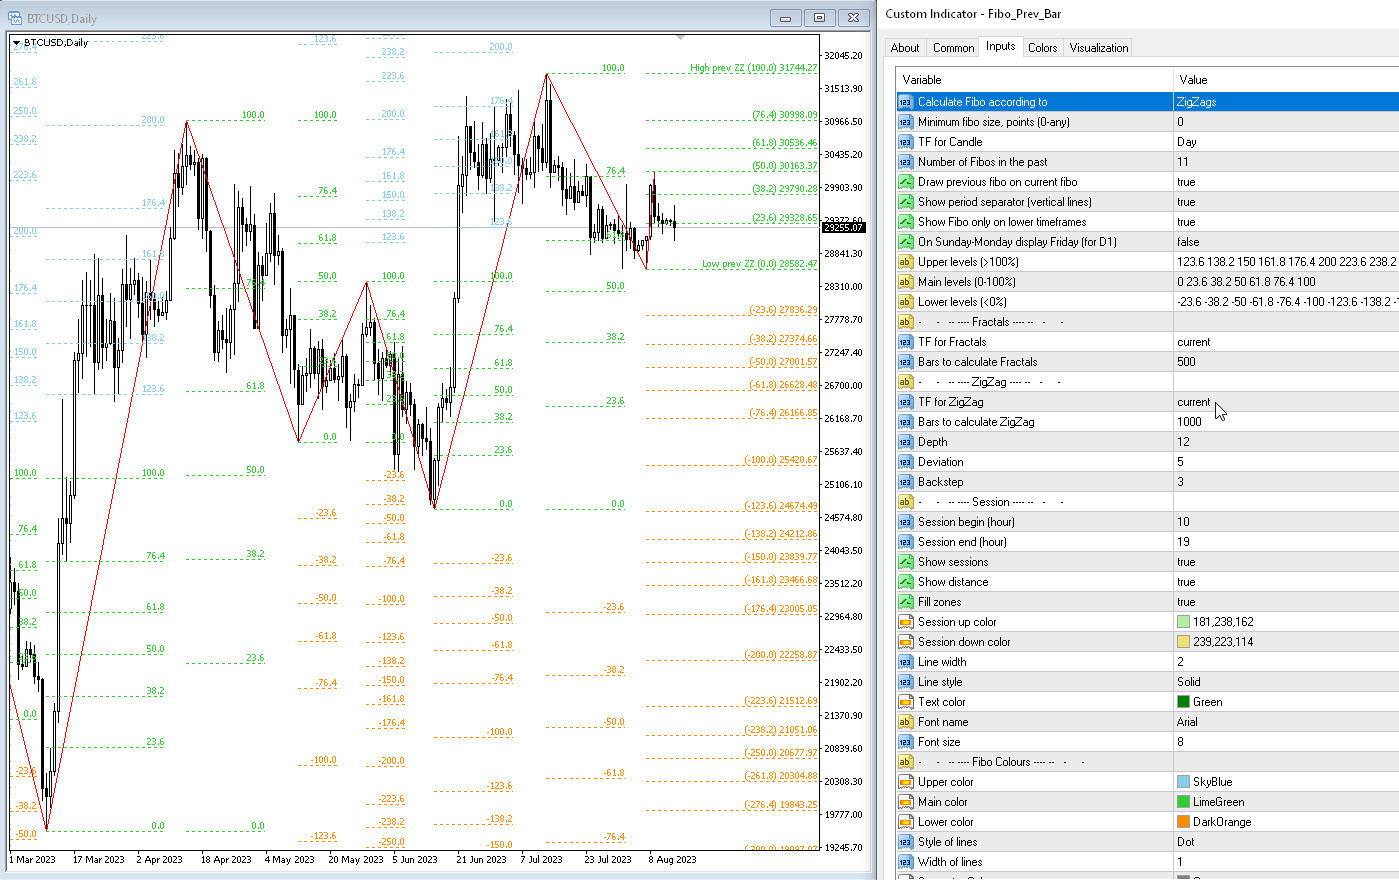
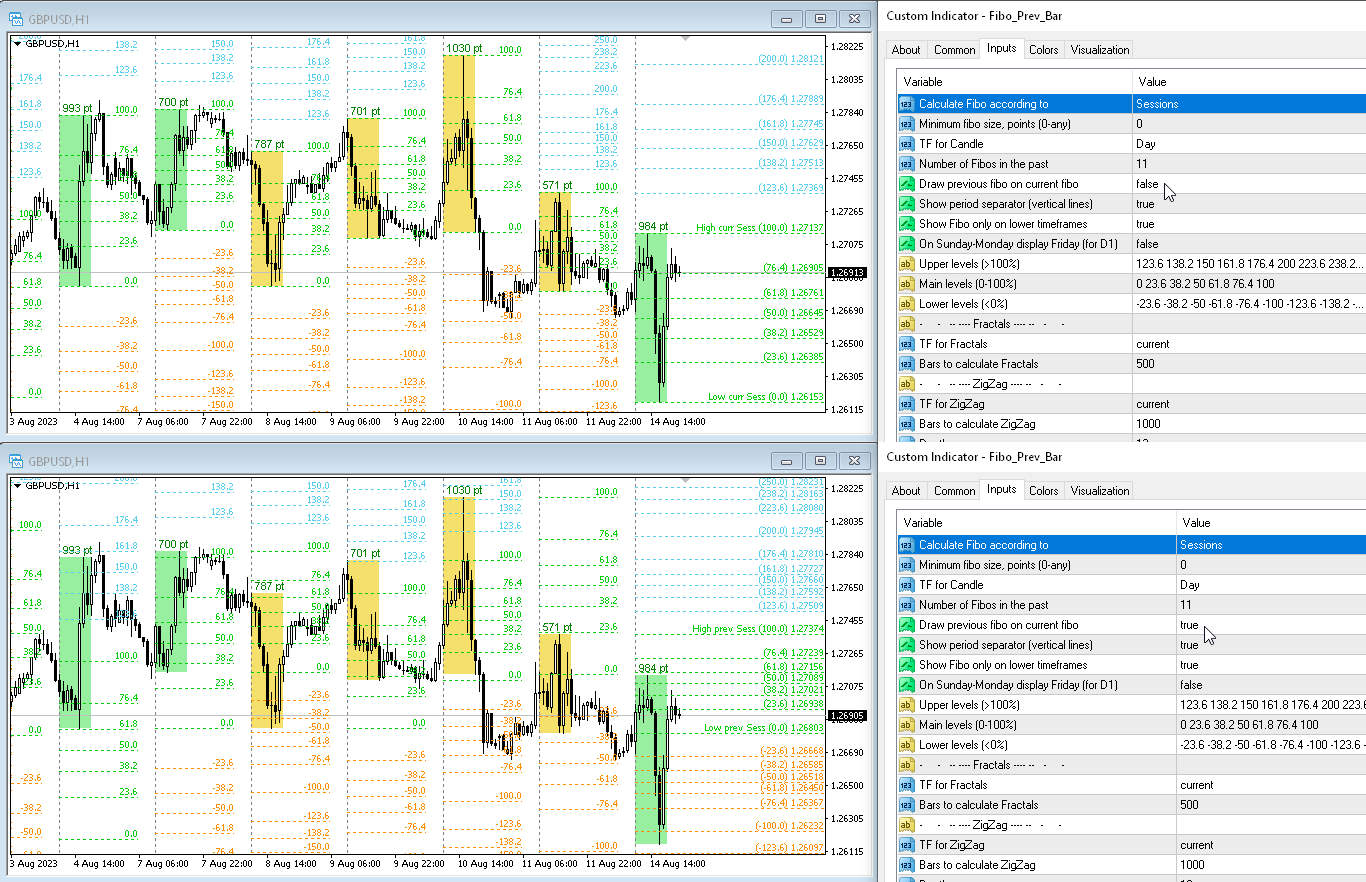
L'indicatore disegna automaticamente i livelli di Fibonacci in base all'indicatore ZigZag, alle sessioni di trading, ai frattali o alle candele (inclusi intervalli di tempo non standard: anno, 6 mesi, 4 mesi, 3 mesi, 2 mesi) (ritracciamento automatico di Fibonacci). Puoi scegliere qualsiasi intervallo di tempo più lungo per il calcolo di Fibonachi.
I livelli vengono ridisegnati ogni volta che la barra corrente si chiude. È possibile abilitare gli avvisi quando si superano i livelli specificati.

Puoi anche analizzare i livelli nella cronologia. Per fare ciò, è necessario specificare il numero di livelli di Fibo nel parametro "Numero di Fibo nel passato"


Parametri

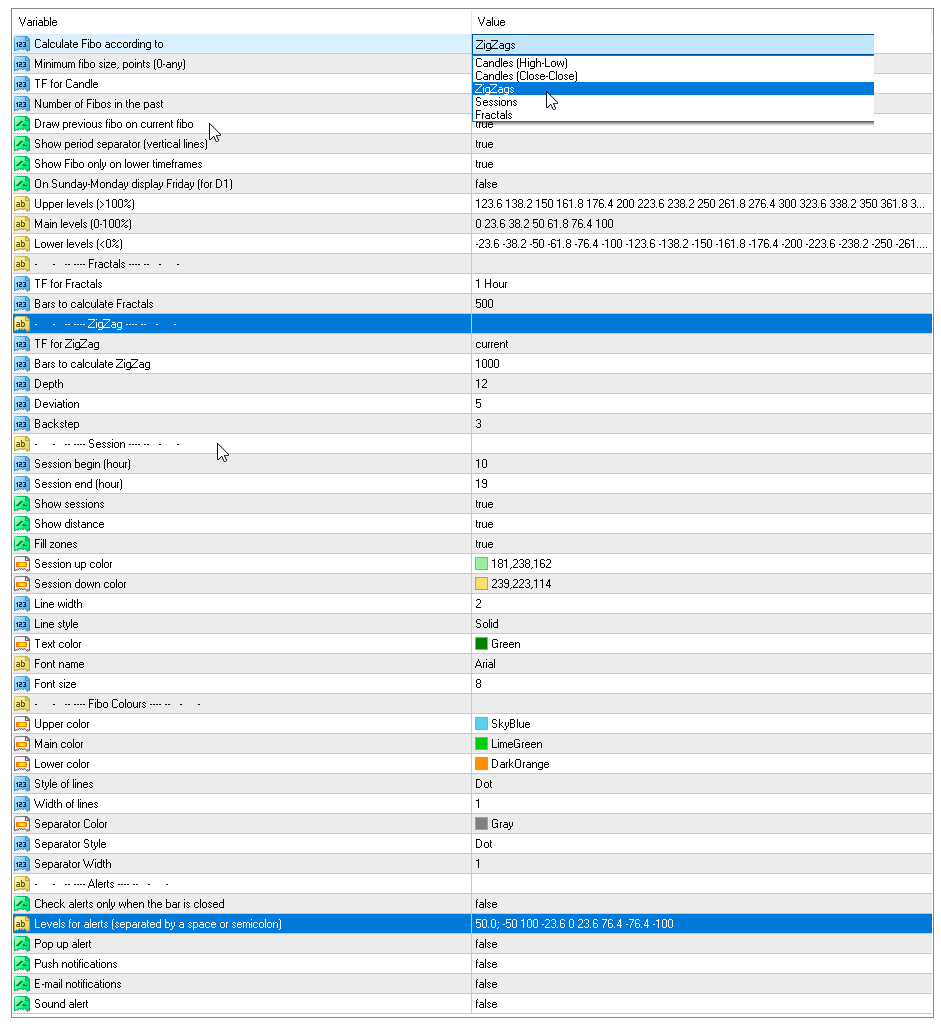
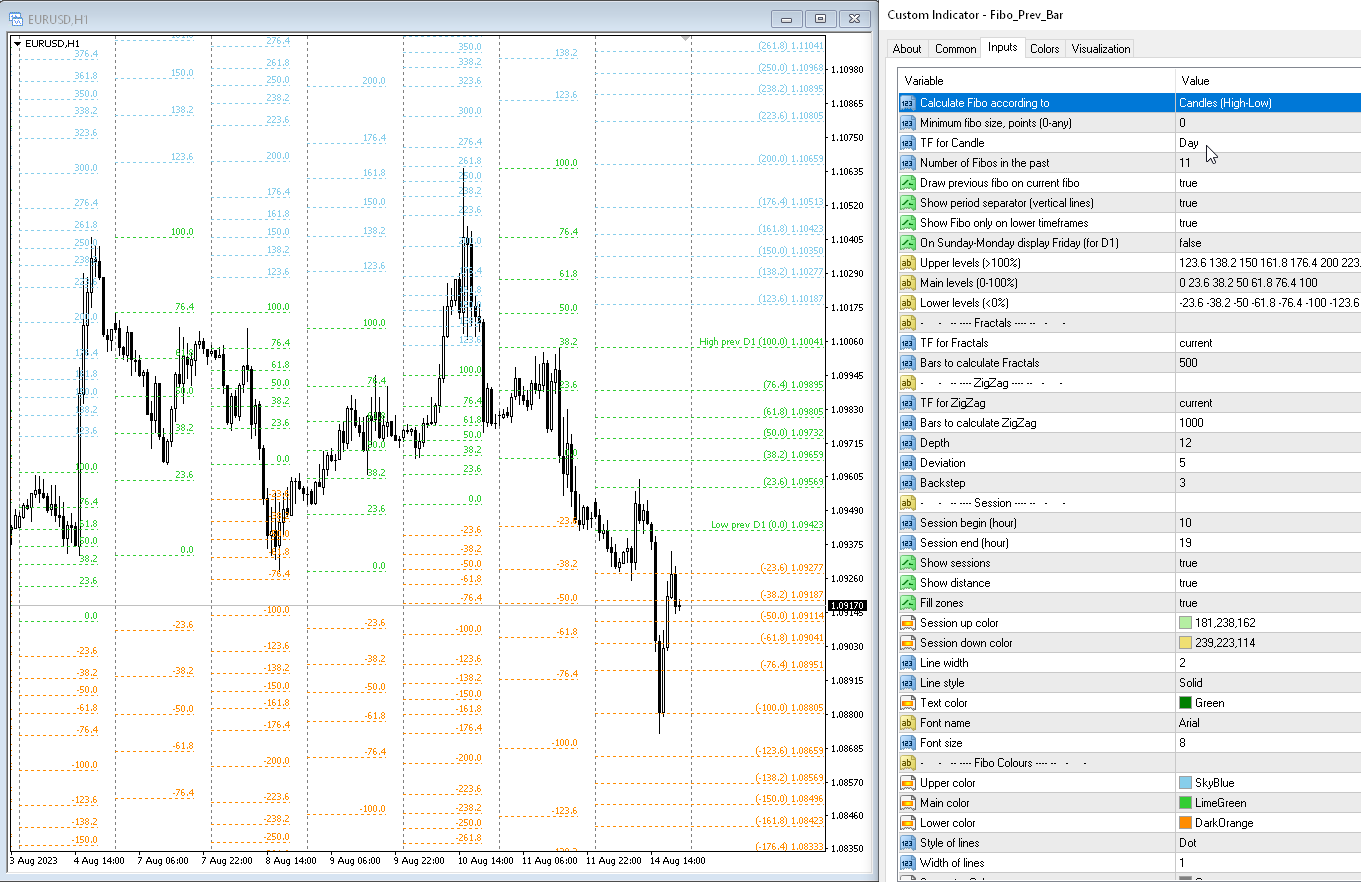
Calculate Fibo according to — Modalità di calcolo Fibo:
  • Candles (High-Low) — costruisci un fibo basato sul massimo-basso;
  • Candles (Close-Close) — costruisci un fibo basato sulla chiusura-chiusura;
  • ZigZags — costruisci fibo in base ai punti ZigZag;
  • Sessions — costruisci fibo tramite sessioni di trading;
  • Fractals — costruisci fibo in base ai punti frattali.
Minimum fibo size, points (0-any) — la dimensione minima del fibo in punti. Se il fibo è inferiore a questa dimensione, viene ignorato.
TF for Candle — arco temporale delle candele per la costruzione dei livelli Fibo;
Number of Fibo in the past — il numero di livelli di Fibo da tracciare nella cronologia;
Upper levels (>100%) — livelli superiori, i valori devono essere maggiori di 100 (separati da spazio o punto e virgola);
Main levels (0-100%) — livelli medi, i valori devono essere compresi tra 0 e 100 (separati da spazio o punto e virgola);
Lower levels (<0%) — livelli inferiori, i valori devono essere inferiori a 100 (separati da spazio o punto e virgola);
Draw previous fibo on current fibo — disegna il fibo precedente al posto del fibo attuale. Se disabiliti questo parametro, i Fibos verranno tracciati ai livelli ai quali sono stati calcolati.
On Sunday-Monday display Friday (for D1) — se ci sono virgolette sabato-domenica, disegna un fibo venerdì. Solo per il periodo D1;
Show period separator (vertical lines) — mostra il separatore punto. Verrà visualizzato come linee verticali sul grafico;
Show Fibo only on lower timeframes — disegna Fibo solo su periodi più piccoli;
Upper color — colore delle linee superiori;
Main color — colore delle linee centrali;
Lower color — colore delle linee inferiori;
Style of lines — stile della linea;
Width of lines — larghezza della linea;
Min pause between signals (sec) — pausa tra gli avvisi in secondi;
Levels for alerts (separated by a space or semicolon) — livelli per gli avvisi, separati da spazi o punto e virgola;
Alerts — attiva gli avvisi popup;
Push notification — attiva le notifiche push;
Send e-mail — invia e-mail.
Recensioni 3
marcello 981
117
marcello 981 2023.11.26 17:36 
 

This is one of the main indicators for my reviews, excellent the attentiveness of the developer to implement suggestions for improvements, great job!

are1971
747
are1971 2022.08.20 16:33 
 

Very usefull indicator

Prodotti consigliati
Was: $249  Now: $99   Market Profile defines a number of day types that can help the trader to determine market behaviour. A key feature is the Value Area, representing the range of price action where 70% of trading took place. Understanding the Value Area can give traders valuable insight into market direction and establish the higher odds trade. It is an excellent addition to any system you may be using. Inspired by Jim Dalton’s book “Mind Over Markets”, this indicator is designed to suit the
Delta Profile Volume
Teresinha Moraes Correia
Technical Description of the Indicator – Delta Profile for MetaTrader 5 The Delta Profile is an indicator developed for MetaTrader 5 focused on detailed analysis of volume flow within a defined range of candles. It organizes and displays information about the imbalance of positive volumes (associated with upward movements) and negative volumes (associated with downward movements) at different price levels. The result is a clear view of the chart points where the highest concentration of trades o
Strumento Avanzato di Analisi del Profilo dei Volumi per MetaTrader 5 Il Kecia Volume Profile Order Finder offre ai trader funzionalità di analisi del profilo dei volumi. Questo indicatore per MT5 combina la visualizzazione del profilo dei volumi con calcoli statistici per aiutare a identificare potenziali opportunità di trading e suggerisce livelli di entrata, stop loss e take profit basati sulla struttura del mercato. Visualizzazione del Profilo di Mercato Trasforma il tuo grafico con visualiz
L'indicateur SMC Venom Model BPR est un outil professionnel pour les traders travaillant dans le concept Smart Money (SMC). Il identifie automatiquement deux modèles clés sur le graphique des prix: FVG   (Fair Value Gap) est une combinaison de trois bougies, dans laquelle il y a un écart entre la première et la troisième bougie. Forme une zone entre les niveaux où il n'y a pas de support de volume, ce qui conduit souvent à une correction des prix. BPR   (Balanced Price Range) est une combinaiso
Mirror Chart MT5
Andrej Hermann
5 (1)
The Mirror Chart MT5 is a overlay indicator specifically designed to project a second financial instrument directly onto the main chart window. This tool is invaluable for traders who rely on correlation analysis, as it visualizes the price movements of two different instruments in real time. Unlike traditional overlays, this indicator utilizes intelligent, dynamic centering and scaling logic. It continuously analyzes the visible price range in the current window for both symbols and calculates
FREE
Time and Sales Tick
Pablo Filipe Soares De Almeida
Time & Sales Tick Indicator è un indicatore per MetaTrader 5 che mostra i dati dei tick in tempo reale. Visualizza prezzo, volume dei tick e orario direttamente sul grafico. Funzionalità Mostra i dati dei tick, inclusi prezzo, volume e tempo, in un pannello sul grafico. Raggruppa i tick in intervalli definiti dall’utente, con colori distinti (verde per rialzo, rosso per ribasso). Il pannello può essere posizionato in qualsiasi angolo del grafico.
L'indicatore costruisce le quotazioni attuali, che possono essere confrontate con quelle storiche e su questa base fanno una previsione del movimento dei prezzi. L'indicatore ha un campo di testo per una rapida navigazione fino alla data desiderata. Opzioni: Simbolo - selezione del simbolo che visualizzerà l'indicatore; SymbolPeriod - selezione del periodo da cui l'indicatore prenderà i dati; IndicatorColor - colore dell'indicatore; HorisontalShift - spostamento delle virgolette disegnate d
Price Magnet — Price Density and Attraction Levels Indicator Price Magnet is a professional analytical tool designed to identify key support and resistance levels based on statistical Price Density. The indicator analyzes a specified historical period and detects price levels where the market spent the most time. These zones act as “magnets,” attracting price action or forming a structural base for potential reversals. Unlike traditional Volume Profile tools, Price Magnet focuses on price-time d
Crash 1000 Scalping Indicator for the Crash 1000 Deriv Synthetic Index. Introduction The Crash 1000 Scalping Indicator is a specialized tool designed for the Crash 1000 index on the Deriv Synthetic market. This indicator is particularly useful for scalping on the M1 timeframe, helping traders to identify precise entry and exit points for buy positions. It is designed to be non-repainting, providing clear signals with audible alerts and push notifications, and is compatible with mobile devices th
Binary Rise Fall
Israr Hussain Shah
Here   our more valuable tools SMC Trend Trading   ,  Easy SMC Trading  ,  Institutional SMC Architect Volume Analysis Tools  ,  Volume flow Profile  ,  Market volume profile  , FVG with Volume  , Liquidity Heatmap Profile  ,  Volume Spread Analysis The Fractals_Price indicator is a technical analysis tool that identifies fractal patterns on price charts. Fractals are recurring patterns that signal potential trend reversals or continuation points. This indicator marks both upward and downward
Cumulative Volume Delta MA-X MTF (con Gradient Momentum) Questo indicatore esegue un'analisi multi-timeframe del Delta del Volume Cumulativo (CVD) per MetaTrader 5. Calcola la differenza netta tra la pressione di acquisto e di vendita analizzando i dati del volume reale o dei tick, fornendo una rappresentazione visiva del sentiment del flusso degli ordini. Logica e Caratteristiche dell'Indicatore L'indicatore utilizza un approccio matematico per l'analisi del volume: Origine dei Dati: Supporta
Smart Imbalance Edge: Decode Institutional Footprints and Market Momentum The market doesn't move randomly. Its direction and structural shifts are driven by major players—institutional capital, banks, and hedge funds. Smart Imbalance Edge is an advanced, analytical MetaTrader 5 tool designed to help you spot these institutional footprints and measure the true force behind their actions. This isn't just another standard "ZigZag" indicator that blindly connects highs and lows. This algorithm sc
Order Book, known also as Market Book, market depth, Level 2, - is a dynamically updated table with current volumes of orders to buy and to sell specific financial instument at price levels near Bid and Ask. MetaTrader 5 provides the means for receiving market book from your broker, but in real time only, without access to its history. The indicator OrderBook Cumulative Indicator accumulates market book data online and visualizes them on the chart. In addition, the indicator can show the market
Il livello Premium è un indicatore unico con una precisione superiore all'80% delle previsioni corrette! Questo indicatore è stato testato dai migliori Specialisti di Trading per più di due mesi! L'indicatore dell'autore che non troverai da nessun'altra parte! Dagli screenshot puoi vedere di persona la precisione di questo strumento! 1 è ottimo per il trading di opzioni binarie con un tempo di scadenza di 1 candela. 2 funziona su tutte le coppie di valute, azioni, materie prime, criptovalu
Visual CrossPulse Dynamics Indicator
AL MOOSAWI ABDULLAH JAFFER BAQER
Visual CrossPulse Dynamics: Trade with the Market's True Rhythm Unlock a new level of market insight with Visual CrossPulse Dynamics, a sophisticated trading indicator designed to adapt to ever-changing volatility and reveal the true direction of the trend. Are you tired of indicators that lag in fast-moving markets or give false signals during consolidation? The Visual CrossPulse Dynamics indicator solves this problem by using an advanced, adaptive algorithm that intelligently adjusts to the m
Donchian Breakout And Rsi
Mattia Impicciatore
4.5 (2)
Descrizione generale Questo indicatore è una versione avanzata del classico Donchian Channel , arricchita con funzioni operative per il trading reale. Oltre alle tre linee tipiche (massimo, minimo e linea centrale), il sistema rileva i breakout e li segnala graficamente con frecce sul grafico, mostrando solo la linea opposta alla direzione del trend per semplificare la lettura. L’indicatore include: Segnali visivi : frecce colorate al breakout Notifiche automatiche : popup, push e email Filtro R
FREE
Trend Master V2
Oratile Pitsoane
What Is Trend Master Pro? Trend Master Pro   is a professional-grade trend trading indicator built for MetaTrader 5. It was designed with one goal in mind — to keep you on the right side of the market at all times by combining three powerful technical tools into a single, clean, easy-to-read display directly on your price chart. Instead of cluttering your screen with multiple separate indicators, Trend Master Pro fuses an   EMA Ribbon trend filter , a   ZigZag swing point engine , and a   breako
RSI Currency Strength Meter is a powerful and elegant multi-currency indicator that measures the real-time relative strength of the 8 major currencies using RSI logic. By calculating the smoothed performance of each currency across its major pairs and applying the RSI formula, it delivers clean and responsive strength lines that make it easy to spot which currencies are truly strong or weak at any moment. This indicator is particularly useful for visualizing currency correlations and divergence
CosmiCLab SMC FIBO CosmiCLab SMC FIBO is a professional trading indicator designed for traders who use Smart Money Concepts (SMC), market structure analysis and Fibonacci retracement levels. The indicator automatically detects market swings and builds Fibonacci levels based on the latest impulse movement. It also identifies market structure changes such as BOS (Break of Structure) and CHOCH (Change of Character), helping traders understand the current market direction. CosmiCLab SMC FIBO also pr
ALIEN Dashboard
Youssef Esseghaiar
ALIEN DASHBOARD FULL EDITION – Professional ICT & Precision Trading Dashboard for MT5 ( HYBRID ENGINE ) Overview The   Alien Dashboard Full Edition   is a comprehensive, all‑in‑one technical indicator for MetaTrader 5 that merges the most powerful concepts from Inner Circle Trader (ICT) methodology with advanced precision‑entry logic, multi‑timeframe analysis, and an intuitive on‑chart dashboard. Designed for serious traders who want to visualise institutional order flow, identify high‑probabili
No Demand No Supply MT5
Trade The Volume Waves Single Member P.C.
No Demand No Supply   This indicator identifies   No Demand –No Supply candles to your chart and plots volume bars colored according to the signal. It can be applied to all timeframes or to a specific one only. It can also be used as regular volume indicator  with exceptional future of WEIGHTED VOLUME. Furthermore is has an alert notification, sound and email when a signals occurs. The indicator does not repaint but the alert will come on two candles back due to the definition of No Demand No Su
Visual Tiger Speed Indicator
AL MOOSAWI ABDULLAH JAFFER BAQER
Visual Tiger Speed Indicator: Unleash the Power of Market Velocity For just a one-time payment of $30, gain a lifetime edge in identifying explosive market moves before they happen. Are you tired of lagging indicators that only show you what has already occurred? The Visual Tiger Speed Indicator is a next-generation tool designed to measure the true, unfiltered velocity of price action, giving you a unique advantage in any market condition. It moves beyond simple price analysis to decode the mo
Noize Absorption Index - is the manual trading system that measures the difference of pressure between bears forces and bulls forces. Green line - is a noize free index that showing curent situation. Zero value of index shows totally choppy/flat market.Values above zero level shows how powerfull bullish wave is and values below zero measures bearish forces.Up arrow appears on bearish market when it's ready to reverse, dn arrow appears on weak bullish market, as a result of reverse expectation.
Value Chart Candlesticks
Flavio Javier Jarabeck
4.57 (14)
The idea of a Value Chart indicator was presented in the very good book I read back in 2020 , " Dynamic Trading Indicators: Winning with Value Charts and Price Action Profile ", from the authors Mark Helweg and David Stendahl. The idea is simple and the result is pure genius: Present candlestick Price analysis in a detrended way! HOW TO READ THIS INDICATOR Look for Overbought and Oversold levels. Of course, you will need to test the settings a lot to find the "correct" one for your approach. It
FREE
Phantom Edge SMC
Nattapon Chuekamhod
Phantom Edge SMC — The Ultimate Smart Money Indicator for MT5 Tired of manually drawing structures while trading SMC or ICT concepts? Let Phantom Edge SMC do the heavy lifting for you. Key Features Internal & Swing Structure: Automatically detects BOS and CHoCH across two structural levels. Order Blocks (OB): Identifies Internal and Swing OBs with automated mitigation tracking. Equal Highs / Lows: Highlights EQH / EQL to pinpoint Liquidity pools. Fair Value Gaps (FVG): Displays FVGs with
Here   our more valuable tools SMC Trend Trading   ,  Easy SMC Trading  ,  Institutional SMC Architect Volume Analysis Tools  ,  Volume flow Profile  ,  Market volume profile  , FVG with Volume  , Liquidity Heatmap Profile  ,  Volume Spread Analysis The    Liquidity Heatmap   is a sophisticated institutional trading tool designed to reveal where over-leveraged traders are trapped. By calculating estimated liquidation levels based on volume spikes and leverage, this indicator draws a dynamic "h
Volumes Direction MT5
William Oswaldo Mayorga Urduy
DIREZIONE VOLUMI MT5 Normalmente l'indicatore del volume ha un cambio di colore predefinito quando il volume corrente è più alto del precedente, è importante ma non molto utile. Per questo motivo è stato creato questo indicatore che oltre al volume normale, quando la candela è rialzista o ribassista, le dipinge di un colore diverso, di default è blu per rialzista e rosso per ribassista, ma questi colori possono essere personalizzati al Il gusto del commerciante. Non dimenticare di controll
This indicator presents an alternative approach to identify Market Structure. The logic used is derived from learning material created by   DaveTeaches (on X) Upgrade v1.10: + add option to put protected high/low value to buffer (figure 11, 12) + add  Retracements  value to buffer when Show Retracements When quantifying Market Structure, it is common to use fractal highs and lows to identify "significant" swing pivots. When price closes through these pivots, we may identify a Market Structure S
Supply and Demand Pro
Godbless C Nygu
4 (1)
Join Deriv link on profile>>> GET THIS FULL COPY AND GET ANOTHER FREE INDICATOR ONE OF THE BEST AND USEFULL INDICATORS IN THE WORLD ..This is the one of the best usefull indicators which has chosen to be used by top traders in the world. AUTOMATIC SUPPORT AND RESISTANCE This way of trading is also called Supply and demand, On this way of trading you can see auto colours appear where the market changes direction buying or selling Direction. ALL KIND OF PAIRS METALS AND INDICIES ARE INCLUDED A
Gli utenti di questo prodotto hanno anche acquistato
Neuro Poseidon MT5
Daria Rezueva
4.95 (22)
Neuro Poseidon is a new indicator by Daria Rezueva. It combines precise trading signals with adaptive TP/SL levels - creating best possible trades as a result! Message me and get  Neuro Poseidon Assistant  as a gift to automize your trading process! What makes it stand out? 1. Proven profitability on all assets and timeframes 2. Only confirmed BUY and SELL signals present on the chart 3. Adaptive TP & SL levels generated by the software for each trade 4. Easy to understand - suitable for al
PrimeScalping
Temirlan Kdyrkhan
PrimeScalping is a powerful trading companion designed to generate high-probability entry signals with dynamic TP/SL/DP levels based on volatility. Built-in performance tracking shows win/loss stats, PP1/PP2 hits, and success rates — all updated live. Key Features: Buy/Sell signals with adaptive volatility bands Real-time TP/SL/DP levels based on ATR Built-in MA Filter with optional ATR/StdDev volatility Performance stats panel (Success, Profit/Loss, PP1/PP2) Alerts via popup, sound, push, or e
SuperScalp Pro
Van Minh Nguyen
4.65 (26)
SuperScalp Pro – Sistema avanzato di indicatore scalping multi-filtro SuperScalp Pro è un indicatore di scalping avanzato che combina il classico Supertrend con molteplici filtri intelligenti di conferma per aiutare a identificare opportunità di trading. Funziona in modo efficiente su diversi timeframe da M1 a H4, con prestazioni ottimizzate su XAUUSD, BTCUSD e principali coppie Forex. L’indicatore fornisce chiari segnali Buy e Sell, insieme a livelli di ingresso, stop loss e take profit calcola
Divergence Bomber
Ihor Otkydach
4.9 (90)
Ogni acquirente dell’indicatore riceverà inoltre gratuitamente: L’utilità esclusiva “Bomber Utility”, che gestisce automaticamente ogni operazione, imposta i livelli di Stop Loss e Take Profit e chiude le posizioni secondo le regole della strategia I file di configurazione (set file) per adattare l’indicatore a diversi asset I set file per configurare il Bomber Utility in tre modalità: “Rischio Minimo”, “Rischio Bilanciato” e “Strategia di Attesa” Una guida video passo-passo per installare, conf
Entry In The Zone and SMC Multi Timeframe is a real-time 2-in-1 market analysis tool that combines market structure analysis and a No Repaint BUY / SELL signal system into a single indicator, built on Smart Money Concepts (SMC) — a widely adopted framework used by professional traders to understand market structure. This indicator helps you see the market more clearly, make decisions based on structure rather than guesswork, and focus on high-probability zones where price is more likely to react
Cominciamo con la verità. Nessun indicatore da solo ti renderà profittevole. Se qualcuno ti dice il contrario, ti sta vendendo un sogno. Qualsiasi indicatore che mostra frecce perfette di acquisto/vendita può essere reso impeccabile — basta ingrandire la giusta sezione della storia e catturare solo i trade vincenti. Noi non lo facciamo.  SMC Intraday Formula è uno strumento. Legge la struttura del mercato per te, identifica le zone a più alta probabilità e ti mostra esattamente come appare la t
ScalpPoint
Temirlan Kdyrkhan
ScalpPoint is a powerful trading companion designed to generate high-probability entry signals with dynamic TP/SL/DP levels based on volatility. Built-in performance tracking shows win/loss stats, PP1/PP2 hits, and success rates — all updated live. Key Features: Buy/Sell signals with adaptive volatility bands Real-time TP/SL/DP levels based on ATR Built-in MA Filter with optional ATR/StdDev volatility Performance stats panel (Success, Profit/Loss, PP1/PP2) Alerts via popup, sound, push, or emai
Questo prodotto è stato aggiornato per il mercato 2026 e ottimizzato per le ultime build di MT5. AVVISO DI AGGIORNAMENTO PREZZO: Smart Trend Trading System è attualmente disponibile a $99 . Il prezzo aumenterà a $199 dopo i prossimi 30 acquisti . OFFERTA SPECIALE: Dopo aver acquistato Smart Trend Trading System, inviami un messaggio privato per ricevere Smart Universal EA GRATIS e trasformare i tuoi segnali Smart Trend in operazioni automatiche. Smart Trend Trading System è un sistema di tradin
SignalTech is an unique fully rule based trading system delivers an Institutional approach for both Independent Traders and Prop Firm Challengers. Never Repaint. Push Notification available. No over-optimization. All the winning trades with chart setups are published on the comments page. 2026-05 4107 Pips (Until 05-29 NY Closed) 2026-04 2243 Pips 2026-03 2165 Pips 2026-02 2937 Pips 2026-01 2624 Pips 2025-12 1174 Pips It can generate signals with Buy/Sell Arrows, Push Notification (To Mobile) an
MasterTrend
Temirlan Kdyrkhan
MasterTrend Indicator for MT5 A powerful trend-following and signal-evaluation tool MasterTrend   is a custom MT5 indicator that combines Moving Averages and ATR-based risk/reward logic to generate clear buy/sell signals. It visualizes dynamic SL/TP levels, evaluates past trade outcomes, and displays win/loss statistics in a clean on-chart panel. Key features include: Buy/Sell signals based on MA crossovers ATR-based SL/TP1/TP2/TP3 levels with visual lines and labels Signal outcome tracking wit
Quantum TrendPulse
Bogdan Ion Puscasu
5 (25)
Ecco   Quantum TrendPulse   , lo strumento di trading definitivo che combina la potenza di   SuperTrend   ,   RSI   e   Stocastico   in un unico indicatore completo per massimizzare il tuo potenziale di trading. Progettato per i trader che cercano precisione ed efficienza, questo indicatore ti aiuta a identificare con sicurezza le tendenze di mercato, i cambiamenti di momentum e i punti di entrata e uscita ottimali. Caratteristiche principali: Integrazione SuperTrend:   segui facilmente l'andame
Power Candles MT5
Daniel Stein
5 (8)
Power Candles V3 - Indicatore di forza ad ottimizzazione automatica Power Candles V3 trasforma la forza delle valute e degli strumenti in un piano di trading attuabile su ogni grafico a cui è collegato. Invece di limitarsi a colorare le candele, esegue un'auto-ottimizzazione in tempo reale in background e ti fornisce i migliori valori di Stop Loss, Take Profit e soglia di segnale per il simbolo che hai davanti. Basta un clic per adottarlo nel trading live: i raggi di ingresso, Stop Loss e Take P
Trend Catcher ind mt5
Ramil Minniakhmetov
5 (4)
INDICATORE TREND CATCHER L'indicatore Trend Catcher analizza i movimenti dei prezzi di mercato, utilizzando una combinazione di indicatori di analisi del trend proprietari dell'autore e personalizzati. Identifica la vera direzione del mercato filtrando il rumore a breve termine e concentrandosi sulla forza del momentum sottostante, sull'espansione della volatilità e sul comportamento della struttura dei prezzi. Utilizza inoltre una combinazione di indicatori personalizzati di smoothing e filtr
Presentazione       Quantum Breakout PRO   , l'innovativo indicatore MQL5 che sta trasformando il modo in cui scambi le zone di breakout! Sviluppato da un team di trader esperti con un'esperienza di trading di oltre 13 anni,       Quantum Breakout PRO       è progettato per spingere il tuo viaggio di trading a nuovi livelli con la sua strategia innovativa e dinamica della zona di breakout. Quantum Breakout Indicator ti fornirà frecce di segnalazione sulle zone di breakout con 5 zone target di
Gann Made Easy è un sistema di trading Forex professionale e facile da usare che si basa sui migliori principi del trading utilizzando la teoria di mr. WD Gann. L'indicatore fornisce segnali ACQUISTA e VENDI accurati, inclusi i livelli di Stop Loss e Take Profit. Puoi fare trading anche in movimento utilizzando le notifiche PUSH. CONTATTAMI DOPO L'ACQUISTO PER RICEVERE GRATUITAMENTE LE ISTRUZIONI DI TRADING E OTTIMI INDICATORI EXTRA! Probabilmente hai già sentito parlare molte volte dei metodi d
Azimuth Pro
Ottaviano De Cicco
5 (7)
Azimuth Pro V2: Synthetic Fractal Structure and Confirmed Entries for MT5 Overview Azimuth Pro is a multi-level swing structure indicator by Merkava Labs . Four nested swing layers, swing-anchored VWAP, ABC pattern detection, three-timeframe structural filtering, and closed-bar confirmed entries — one chart, one workflow from micro-swings to macro-cycles. This is not a blind signal product. It is a structure-first workflow for traders who care about location, context, and timing. V2 Launch Offe
GoldenX Entry MT5
Kareem Abbas
5 (9)
GoldenX Entry è un indicatore per MT5 con un algoritmo adattivo Smart Entry Trend, un sistema di scoring dei segnali, un rilevatore del regime di mercato e un filtro di volatilità. Ogni segnale include un livello di ingresso calcolato, tre livelli di Take-Profit (TP1, TP2, TP3) e un livello di Stop-Loss. È costruito su più livelli analitici progettati per adattarsi a diverse condizioni di mercato, combinando un sistema analitico multilivello con un ottimizzatore integrato e un sistema di traccia
FX Trend MT5 NG
Daniel Stein
5 (6)
FX Trend NG: La Nuova Generazione di Intelligenza di Trend Multi-Mercato Panoramica FX Trend NG è uno strumento professionale di analisi del trend multi-timeframe e monitoraggio dei mercati. Ti consente di comprendere la struttura completa del mercato in pochi secondi. Invece di passare tra numerosi grafici, puoi identificare immediatamente quali strumenti sono in trend, dove il momentum sta diminuendo e dove esiste un forte allineamento tra i timeframe. Offerta di Lancio – Ottieni FX Trend NG
M1 Quantum MT5
Hamed Dehgani
5 (1)
M1 Quantum è un sistema di trading professionale per M1 che fornisce segnali di trading rapidi e precisi con Stop Loss, Take Profit e gestione intelligente del capitale integrati. M1 Quantum include un sistema professionale di gestione del capitale progettato per far crescere rapidamente il conto concentrandosi su vittorie consecutive . Caratteristiche principali dell' Indicatore M1 Quantum Progettato per il time frame M1 e tutte le principali coppie di valute Tutti i trade hanno Stop Loss e Tak
Reversion King Indicator
Eugen-alexandru Zibileanu
5 (4)
Un nuovo Re in città - Indicatore + Gestione ordini (TP1 + TP2 + TP3) + Invio opzionale di segnali Telegram INCLUSO (GRATIS) (SISTEMA COMPLETO DI TRADING e SEGNALI) Il nostro miglior EA per l’Oro: Gold Slayer Questo indicatore include una strategia avanzata, un sistema di trading con gestione ordini personalizzabile e un sistema mean reversion che combina estensioni di envelope, supportato da molteplici filtri intelligenti di conferma come RSI per individuare ingressi di inversione ad alta proba
Atomic Analyst MT5
Issam Kassas
4.26 (35)
Questo prodotto è stato aggiornato per il mercato 2026 e ottimizzato per le ultime build di MT5. AVVISO DI AGGIORNAMENTO PREZZO: Atomic Analyst è attualmente disponibile a $99 . Il prezzo aumenterà a $199 dopo i prossimi 30 acquisti . OFFERTA SPECIALE: Dopo aver acquistato Atomic Analyst, inviami un messaggio privato per ricevere Smart Universal EA GRATIS e trasformare i tuoi segnali Atomic Analyst in operazioni automatiche. Atomic Analyst è un indicatore di trading Price Action non-repainting
Meridian Pro
Ottaviano De Cicco
5 (2)
Meridian Pro 2.00: Professional Multi-Timeframe Trend Matrix for MT5 Meridian Pro 2.00 is a professional adaptive trend matrix for MetaTrader 5. It combines the original Meridian trend engine, a clean chart ribbon, closed-bar signal arrows, an 8-timeframe dashboard, Fuel momentum, weighted consensus, synthetic HTF processing and chart-native higher-timeframe context lines. The goal is simple: read current trend, multi-timeframe structure, strength, momentum and EA-ready state from one discipline
SmartScalping
Temirlan Kdyrkhan
SmartScalping is a powerful trading companion designed to generate high-probability entry signals with dynamic TP/SL/DP levels based on volatility. Built-in performance tracking shows win/loss stats, PP1/PP2 hits, and success rates — all updated live. Key Features: Buy/Sell signals with adaptive volatility bands Real-time TP/SL/DP levels based on ATR Built-in MA Filter with optional ATR/StdDev volatility Performance stats panel (Success, Profit/Loss, PP1/PP2) Alerts via popup, sound, push, or e
ARIPoint
Temirlan Kdyrkhan
1 (1)
ARIPoint is a powerful trading companion designed to generate high-probability entry signals with dynamic TP/SL/DP levels based on volatility. Built-in performance tracking shows win/loss stats, PP1/PP2 hits, and success rates all updated live. Key Features: Buy/Sell signals with adaptive volatility bands Real-time TP/SL/DP levels based on ATR Built-in MA Filter with optional ATR/StdDev volatility Performance stats panel (Success, Profit/Loss, PP1/PP2) Alerts via popup, sound, push, or email Cu
Questo prodotto è stato aggiornato per il mercato 2026 e ottimizzato per le ultime build di MT5. AVVISO DI AGGIORNAMENTO PREZZO: Smart Price Action Concepts è attualmente disponibile a $200 . Il prezzo aumenterà a $299 dopo i prossimi 30 acquisti . OFFERTA SPECIALE: Dopo l’acquisto, inviami un messaggio privato per ricevere un bonus gratuito + regalo . Prima di tutto, vale la pena sottolineare che questo strumento di trading è un indicatore non-repainting, non-redrawing e non-lagging, il che lo
TrendProMaster
Temirlan Kdyrkhan
MasterTrend Indicator for MT5 A powerful trend-following and signal-evaluation tool MasterTrend   is a custom MT5 indicator that combines Moving Averages and ATR-based risk/reward logic to generate clear buy/sell signals. It visualizes dynamic SL/TP levels, evaluates past trade outcomes, and displays win/loss statistics in a clean on-chart panel. Key features include: Buy/Sell signals based on MA crossovers ATR-based SL/TP1/TP2/TP3 levels with visual lines and labels Signal outcome tracking wit
Versione Swing M30/H1/H4 disponibile Vuoi catturare i grandi movimenti? Gold Signal Swing Pro (M30/H1/H4). Obiettivo: $20-$80+ per trade. https://www.mql5.com/en/market/product/177643 KURAMA GOLD SIGNAL PRO (MT5) — Sistema di Trading XAUUSD Completo a 7 Strati di Filtri Nessun repaint. Nessun ridisegno. Nessun ritardo. Ogni segnale rimane fissato una volta confermato. Bonus acquirente: Chiunque acquisti la licenza di acquisto riceve AI Zone Radar (v
FX Power MT5 NG
Daniel Stein
5 (32)
FX Power: Analizza la Forza delle Valute per Decisioni di Trading Più Intelligenti Panoramica FX Power è lo strumento essenziale per comprendere la reale forza delle principali valute e dell'oro in qualsiasi condizione di mercato. Identificando le valute forti da comprare e quelle deboli da vendere, FX Power semplifica le decisioni di trading e rivela opportunità ad alta probabilità. Che tu segua le tendenze o anticipi inversioni utilizzando valori estremi di Delta, questo strumento si adatta
RelicusRoad Pro MT5
Relicus LLC
4.96 (24)
RelicusRoad Pro: Sistema Operativo Quantitativo di Mercato 70% DI SCONTO ACCESSO A VITA (TEMPO LIMITATO) - UNISCITI A 2.000+ TRADER Perché la maggior parte dei trader fallisce anche con indicatori "perfetti"? Perché operano su Singoli Concetti isolati. Un segnale senza contesto è una scommessa. Per vincere serve CONFLUENZA . RelicusRoad Pro non è un semplice indicatore. È un Ecosistema Quantitativo completo . Mappa la "Fair Value Road", distinguendo tra rumore e rotture strutturali. Smetti di in
FX Levels MT5
Daniel Stein
5 (14)
FX Levels: Supporti e Resistenze di Precisione Eccezionale per Tutti i Mercati Panoramica Rapida Cercate un modo affidabile per individuare livelli di supporto e resistenza in ogni mercato—coppie di valute, indici, azioni o materie prime? FX Levels fonde il metodo tradizionale “Lighthouse” con un approccio dinamico all’avanguardia, offrendo una precisione quasi universale. Basato sulla nostra esperienza reale con i broker e su aggiornamenti automatici giornalieri più quelli in tempo reale, FX
Altri dall’autore
Time Scale for MT5
Taras Slobodyanik
4.77 (30)
The indicator draws the time scale on the chart. You can specify the time offset, adjust the size and font to display on the chart ( it is displaying your local time on your chart instead of MT time ). You can also select the desired format for displaying the date and time. You may be interested in my other product , which contains a more advanced version of the Time Scale . You can also find my other products here Parameters Hours (time shift) — time shift (hours); Minutes (time shift) — time
FREE
ZigZag Lines MTF
Taras Slobodyanik
4.38 (13)
Multi timeframe ZigZag indicator. It displays the support/resistance horizontal lines and their breakouts, as well as draws the current targets of the market. It can also display lines of the Fractals indicator and candles from other periods (up to Quarterly). So, you can actually see the supply and demand levels. Indicator – connects key lows and highs to show trend lines. You can also use it as indicator for the Break of Structure(BOS) & Market Structure Shift(MSS). The indicator redraws the
Heikin Ashi Dashboard MT5
Taras Slobodyanik
5 (4)
Multi-currency and multitimeframe Heikin Ashi indicator. Shows the current state of the market. On the scanner panel you can see the direction, strength and number of bars of the current trend. The Consolidation/Reversal candles are also shown using color. You can specify any desired currencies and periods in the parameters. Also, the indicator can send notifications when the trend changes or when reversal and consolidation candles (dojis) appear. By clicking on a cell, this symbol and period wi
ZigZag Lines MTF for MT5
Taras Slobodyanik
5 (11)
Multi timeframe ZigZag indicator. It displays the support/resistance horizontal lines and their breakouts, as well as draws the current targets of the market. It can also display lines of the Fractals indicator and candles from other periods (up to Quarterly). So, you can actually see the supply and demand levels. Indicator – connects key lows and highs to show trend lines. You can also use it as indicator for the Break of Structure(BOS) & Market Structure Shift(MSS). The indicator redraws the
Lines Profit Loss MT5
Taras Slobodyanik
4.62 (13)
L'indicatore mostra il profitto (perdita) sul simbolo corrente. Puoi trascinare e rilasciare liberamente la linea per visualizzare il profitto o la perdita corrente. Puoi trovare i miei prodotti   qui Parametri Calculation in money or in points — calcola il profitto/perdita in punti o denaro. Add pending orders to calculate — prendi in considerazione gli ordini in sospeso nei calcoli. Magic Number (0 - all orders on symbol) — numero magico, se è necessario valutare ordini specifici. Offset f
FREE
ZigZag Dashboard for MT5
Taras Slobodyanik
5 (4)
Multicurrency and multitimeframe modification of the ZigZag indicator. Displays the current direction of the market, the height of the last movement, the number of bars in this movement and the breaking of the previous point of the ZigZag (horizontal line). This is MTF Scanner, you can actually see the supply and demand levels. You can specify any desired currencies and timeframes in the parameters. Also, the panel can send notifications when the ZigZag changes direction or when there was a br
The indicator has three main tools: Magnifier (Zoom chart), Ruler  ( Time and Price scales ),   and Crosshair. You can move it all around with your mouse and customize different formats for  displaying , customize   size and color of each element. The Magnifier (zoom chart) allows you to display candles from any time frame and at different scales. Hotkeys: 'Q' - higher timeframe, 'A' - lower timeframe, 'W' - decrease candle size, 'S' - increase candle size, 'Z' - show/hide zoom chart. You can
MACD Dashboard
Taras Slobodyanik
5 (2)
Multi-currency and multi-timeframe indicator MACD. The dashboard can display both the Traditional (true) MACD and the MACD which is built into MetaTrader. On the panel you can see the current state of the indicator — the direction of movement of the MACD lines, their intersection and a pop-up window with the indicator chart. In the parameters you can specify any desired pairs-symbols and timeframes. The scanner can also send notifications about lines crossing each other and about lines crossing
MA Dashboard MT5
Taras Slobodyanik
5 (4)
Modifica multivaluta e multitimeframe dell'indicatore Moving Average (MA). Sulla dashboard puoi vedere lo stato attuale dell'indicatore: breakout e tocchi (per prezzo) della MA veloce e della MA lenta, nonché l'intersezione delle linee MA tra loro (crossover della media mobile). Nei parametri è possibile specificare le valute e i tempi desiderati. Inoltre, l'indicatore può inviare notifiche sul prezzo che tocca le linee e sul loro attraversamento. Cliccando su una cella con un punto, questo sim
ADX Dashboard MT5
Taras Slobodyanik
5 (4)
L'indicatore ADX viene utilizzato per determinare la tendenza e la sua forza. La direzione del prezzo è mostrata dai valori +DI e -DI e il valore ADX mostra la forza del trend. Se +DI è superiore a -DI, ​​il mercato è in un trend rialzista, se al contrario è in un trend al ribasso. Se l'ADX è inferiore a 20, non esiste una direzione definita. Non appena l'indicatore supera questo livello, inizia un trend di media forza. Valori superiori a 40 indicano un trend forte (un trend al ribasso o al ria
Modifica multivaluta e multitimeframe dell'oscillatore stocastico. È possibile specificare qualsiasi valuta e intervallo di tempo desiderati nei parametri. Il pannello visualizza i valori correnti e le intersezioni delle linee: Segnale e Principale (crossover stocastico). Inoltre, l'indicatore può inviare notifiche quando si attraversano i livelli di ipercomprato e ipervenduto. Cliccando su una cella con un punto, questo simbolo e punto verranno aperti. Questo è lo scanner MTF. Similmente al V
MACD Dashboard MT5
Taras Slobodyanik
5 (2)
Multi-currency and multi-timeframe indicator MACD. The dashboard can display both the Traditional (true) MACD and the MACD which is built into MetaTrader. On the panel you can see the current state of the indicator — the direction of movement of the MACD lines, their intersection and a pop-up window with the indicator chart. In the parameters you can specify any desired pairs-symbols and timeframes. The scanner can also send notifications about lines crossing each other and about lines crossing
Modifica multivaluta e multitimeframe dell'indicatore Relative Strength Index (RSI). È possibile specificare qualsiasi valuta e intervallo di tempo desiderati nei parametri. Inoltre, il pannello può inviare notifiche quando si attraversano i livelli di ipercomprato e ipervenduto. Cliccando su una cella con un punto, questo simbolo e punto verranno aperti. Questo è lo scanner MTF. La chiave per nascondere la dashboard dal grafico è "D" per impostazione predefinita Similmente al Valuta Strength
Pro Sessions MT4
Taras Slobodyanik
4.75 (4)
This is an indicator of trading sessions  that can display all levels (Open-High-Low-Close) for four sessions. The indicator can also predict session levels. Sessions can be drawn with lines or rectangles (empty or filled), lines can be extended to the next session. You can easily hide/show each session by pressing hotkeys (by default '1', '2', '3', '4') You can see ASR (Average Session Range) lines  (default hotkey 'A'). This is similar to the ADR calculation, only it is calculated based on th
Lines Profit Loss
Taras Slobodyanik
4.65 (17)
L'indicatore mostra il profitto (perdita) sul simbolo corrente. Puoi trascinare e rilasciare liberamente la linea per visualizzare il profitto o la perdita corrente. Puoi trovare i miei prodotti qui Parametri Calculation in money or in points — calcola il profitto/perdita in punti o denaro. Add pending orders to calculate — prendi in considerazione gli ordini in sospeso nei calcoli. Magic Number (0 - all orders on symbol) — numero magico, se è necessario valutare ordini specifici. Offset for
FREE
Time Scale
Taras Slobodyanik
4.87 (15)
The indicator draws the time scale on the chart. You can specify the time offset, adjust the size and font to display on the chart (it is displaying your local time on your chart instead of MT time). You can also select the desired format for displaying the date and time. While holding down the middle mouse button, and moving the cursor, a slider will appear on the scale. You may be interested in my other product , which contains a more advanced version of the Time Scale. You can also find my o
FREE
Multicurrency and multi-timeframe indicator Inside Bar (IB). In the parameters, you can specify any desired currencies and timeframes. The panel displays the last found Inside Bar (and Mother Bar) pattern, the current price position and the breakout of the levels of the Mother and Inside Bars. You can set the size and color for bars and text in the cells. The indicator can also send notifications when levels are broken. The dashboard highlights Double Inside Bar in a special color. By clicking
Levels of Timeframes
Taras Slobodyanik
5 (2)
L'indicatore mostra i livelli Alto/Basso/Apertura/Chiusura da altri intervalli di tempo (e non standard): Anno, 6 Mesi, 4 Mesi, 3 Mesi, 2 Mesi, Mese, Settimana, Giorno, H3-H6-H8-H12 Ore . Puoi anche impostare lo spostamento per l'apertura delle candele e costruire candele virtuali. I "separatori di periodo" per uno di questi intervalli di tempo sono disponibili sotto forma di linee verticali. Gli avvisi possono essere configurati per i breakout dei livelli attuali o precedenti (breakout della l
Symbol Manager for MT5
Taras Slobodyanik
5 (3)
Symbol Manager or Grid Manager, designed to group orders into one position (by Symbol or by Magic Number). This utility will be useful to multi-currency traders (many EAs), who can have multiple orders on several pairs. You will be able to see the total number of lots, the total profit, and set virtual stop loss and virtual take profit. To set a real TP (or SL), you must first set the virtual value, and then enter the command in this cell: "set". If you want to set real TP/SL for all orders at
Modifica multivaluta e multitimeframe dell'oscillatore stocastico. È possibile specificare qualsiasi valuta e intervallo di tempo desiderati nei parametri. Il pannello visualizza i valori correnti e le intersezioni delle linee: Segnale e Principale (crossover stocastico). Inoltre, l'indicatore può inviare notifiche quando si attraversano i livelli di ipercomprato e ipervenduto. Cliccando su una cella con un punto, questo simbolo e punto verranno aperti. Questo è lo scanner MTF. Similmente al V
L'indicatore mostra i livelli Alto/Basso/Apertura/Chiusura da altri intervalli di tempo (e non standard): Anno, 6 Mesi, 4 Mesi, 3 Mesi, 2 Mesi, Mese, Settimana, Giorno, H3-H6-H8-H12 Ore . Puoi anche impostare lo spostamento per l'apertura delle candele e costruire candele virtuali. I "separatori di periodo" per uno di questi intervalli di tempo sono disponibili sotto forma di linee verticali. Gli avvisi possono essere configurati per i breakout dei livelli attuali o precedenti (breakout della l
CCI Dashboard for MT5
Taras Slobodyanik
5 (1)
Multicurrency and multitimeframe modification of the Commodity Channel Index (CCI) indicator. You can specify any desired currencies and timeframes in the parameters. Also, the panel can send notifications when crossing overbought and oversold levels. By clicking on a cell with a period, this symbol and period will be opened. This is MTF Scanner. The key to hide the dashboard from the chart is "D" by default Parameters CCI Period  — averaging period. CCI Applied price  — price type. Clear the
Pro Sessions MT5
Taras Slobodyanik
5 (1)
This is an indicator of trading sessions  that can display all levels (Open-High-Low-Close) for four sessions . The indicator can also predict session levels. Sessions can be drawn with lines or rectangles (empty or filled), lines can be extended to the next session. You can easily hide/show each session by pressing hotkeys (by default '1', '2', '3', '4') You can see ASR (Average Session Range) lines  (default hotkey 'A'). This is similar to the ADR calculation, only it is calculated based on t
Symbol Manager
Taras Slobodyanik
5 (4)
Symbol Manager or Grid Manager, designed to group orders into one position (by Symbol or by Magic Number). This utility will be useful to multi-currency traders (many EAs), who can have multiple orders on several pairs. You will be able to see the total number of lots, the total profit, and set virtual stop loss and virtual take profit. To set a real TP (or SL), you must first set the virtual value, and then enter the command in this cell: "set". If you want to set real TP/SL for all orders at
MTF RSI for MT5
Taras Slobodyanik
Multi-timeframe indicator Relative Strength Index displays information simultaneously from different periods in one subwindow of the chart. Parameters Period of averaging — averaging period for the RSI calculation. Type of price — price used. Timeframes for RSI — list of periods, separated by a space or comma or semicolon. Number of bars for each period — the number of bars displayed for each period. Sort periods — sort periods if they are listed in no particular order. Current period first — d
Stochastic Oscillator displays information simultaneously from different periods in one subwindow of the chart. Parameters %K Period — K-period (number of bars for calculations). %D Period — D-period (period of first smoothing). Slowing — final smoothing. Method — type of smoothing. Price field — stochastic calculation method . Timeframes for Stochastic — list of periods, separated by a space or comma or semicolon. Number of bars for each period — the number of bars displayed for each period. S
This is the famous FX Sniper's T3 CCI indicator. It is a fixed version additionally containing search for classical and reverse (hidden) divergence. The classical divergence is displayed as a solid line, the reverse divergence is shown as a dotted line. Divergences are drawn in the indicator and on the chart (if you select the appropriate options). Parameters CCI Period — Commodity Channel Index indicator period CCI Type of price — price used for indicator calculation T3 Period — Sniper period
The indicator calculates the inclination angle between the Highs, Lows and Closes of adjacent bars. The angle can be measured in degrees or radians. A linear graph or a histogram is drawn in a subwindow. You can set the scale for the calculation — floating or fixed. For use in Expert Advisors or indicators, you need to specify a fixed scale. Parameters Angular measure — degrees or radians. Scale mode for calculation — scaling mode. Free scale — free transformation, the indicator will calculate
FREE
Angle High Low
Taras Slobodyanik
The indicator calculates the angle between the Highs, Lows and Closes of neighboring bars. The angle can be measured in degrees or radians. A linear chart or a histogram is drawn in a subwindow. You can set the scale for the calculation — floating or fixed. For use in the EA, you need to specify a fixed scale. Parameters Angular measure — degrees or radians. Scale mode for calculation — scaling mode. Free scale — free transformation, the indicator will calculate values each time the chart scale
FREE
Filtro:
marcello 981
117
marcello 981 2023.11.26 17:36 
 

This is one of the main indicators for my reviews, excellent the attentiveness of the developer to implement suggestions for improvements, great job!

are1971
747
are1971 2022.08.20 16:33 
 

Very usefull indicator

Edgar Duttweiler
639
Edgar Duttweiler 2018.08.19 21:57 
 

L'utente non ha lasciato alcun commento sulla valutazione.

Rispondi alla recensione