Levels of Timeframes for MT5
- Indicadores
- Versión: 4.80
- Actualizado: 10 noviembre 2025
- Activaciones: 10

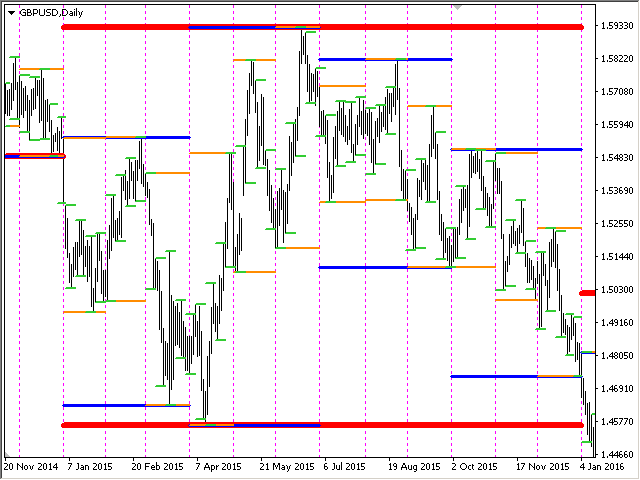
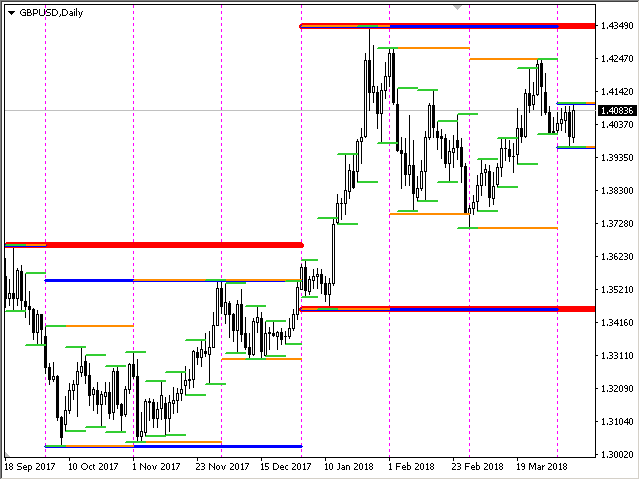
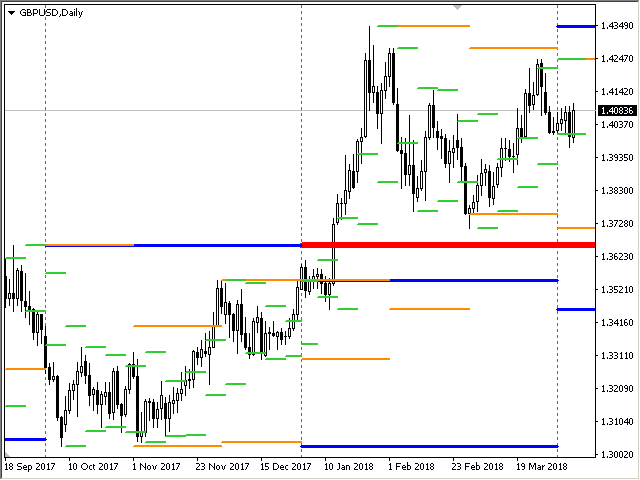
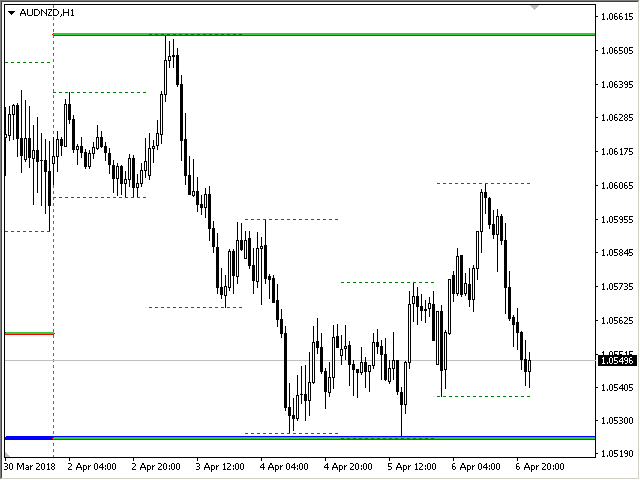
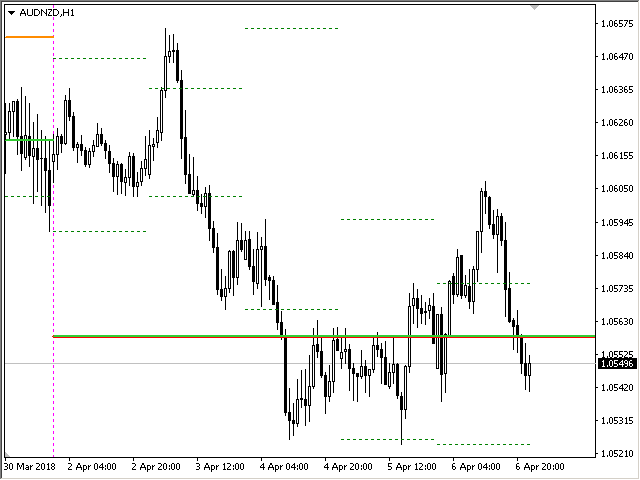
El indicador muestra los niveles alto/bajo/apertura/cierre de otros períodos de tiempo (y no estándar): año, 6 meses, 4 meses, 3 meses, 2 meses, mes, semana, día, horas H3-H6-H8-H12 M45 M90. También puede configurar el turno para abrir velas y construir velas virtuales.
Los "separadores de períodos" para uno de estos períodos de tiempo están disponibles en forma de líneas verticales. Las alertas se pueden configurar para rupturas de los niveles actuales o anteriores (ruptura de la línea Máxima/Mínima de ayer/la semana pasada, etc.).
También puede desplazar todos los niveles un punto hacia la derecha. Es decir, el máximo/mínimo del período anterior se mostrará en el período actual
Parámetros
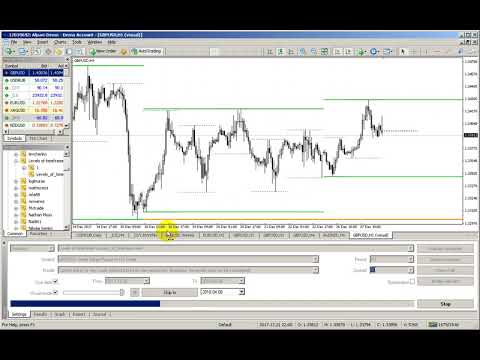
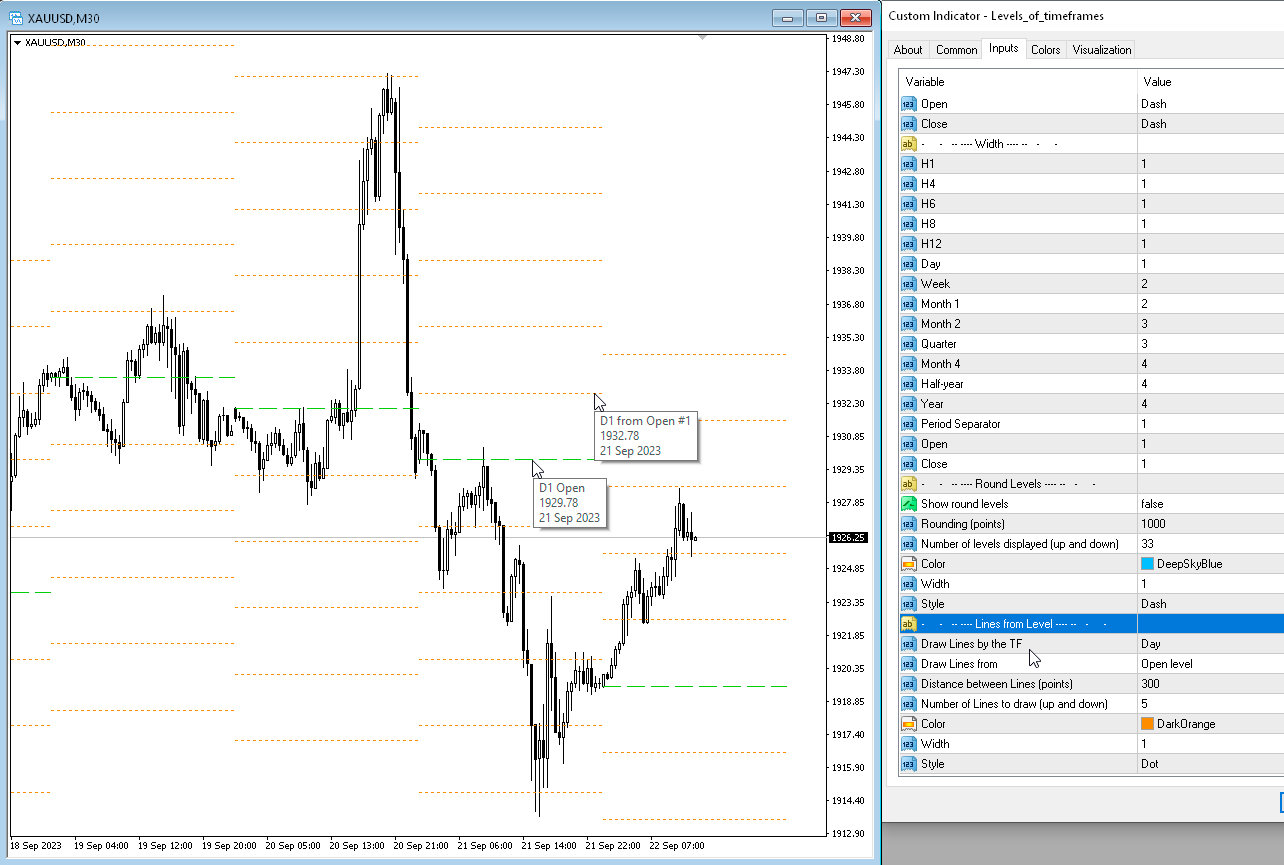
Number of levels to calculate (0-all) — cuántas barras se mostrarán en la pantalla.
Change the opening of bars (hours) — cambiar la apertura de las velas en n horas. El indicador dibujará barras virtuales teniendo en cuenta el nuevo horario de apertura. Los períodos superiores a MN1 no cambian.
Move the levels to the right — mueve todos los niveles una barra hacia la derecha. Verá niveles anteriores en la vela actual.
Period Separator (vertical lines) — muestra una línea vertical, separador de períodos.
Show High Lines (trigger for all highs) — desactiva o habilita el dibujo de niveles altos.
Show Low Lines (trigger for all lows) — desactiva o habilita el dibujo de niveles bajos.
Show Open Line — período de tiempo durante el cual se trazará la línea de precio de apertura. Puede seleccionar "Todos los TF para máximos y mínimos" y los niveles se dibujarán de acuerdo con los períodos especificados para los máximos y mínimos.
Draw Open Line immediately when a new bar appears.
Draw Open Line immediately when a new bar appears.
Show Close Line — período de tiempo para el cual se dibujará la línea de precio de cierre. Puede seleccionar "Todos los TF para máximos y mínimos" y los niveles se dibujarán de acuerdo con los períodos especificados para los máximos y mínimos.
Week starts on Sunday — en la terminal, de forma predeterminada, las velas W1 comienzan el domingo. Si se establece en "falso", la semana comenzará el lunes.
Show levels (Mostrar niveles)
from M45/M90 to Year — muestra altos y bajos de períodos seleccionados. Año, 6 Meses, 4 Meses, 3 Meses, 2 Meses, Mes, Semana, Día, 4-6-8-12 Horas
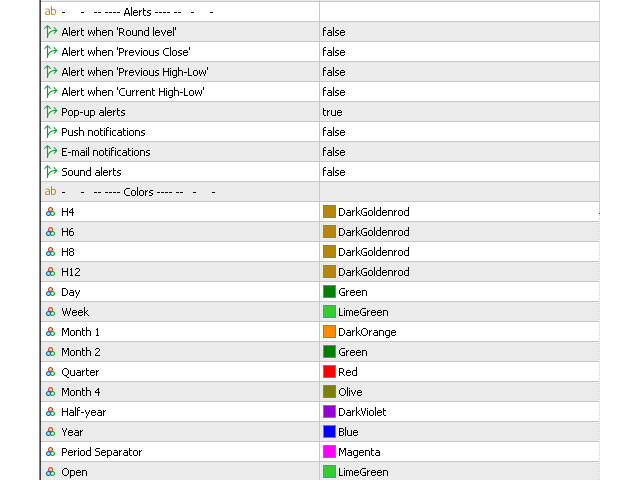
Alerts (Alertas)
Alert when 'Round level' — envía una alerta cuando el precio alcanza un nivel de ronda.
Alert when 'Current Highs-Lows' envíe una alerta cuando el precio toque los niveles actuales.
Alert when 'Previous High-Low' — envíe una alerta cuando el precio toque los niveles anteriores.
Pop-up alerts — Alertas emergentes.
Push notifications — Notificaciones push.
E-mail notifications — Notificaciónes de Correo Electrónico.
Sound alerts — Alertas sonoras.
Colors (Colores)
from M45 to Year — ajuste de color para líneas de período.
Period Separator — color de las líneas separadoras de período.
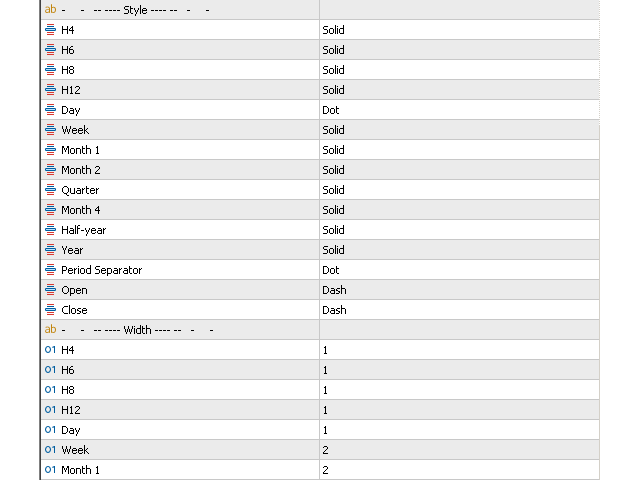
Line style (Estilo de línea)
from M45 to Year — estilo de línea de período.
Period Separator — estilo de las líneas separadoras de período.
Line width (Ancho de línea)
from M45 to Year — ancho de línea del período.
Period Separator — ancho de las líneas separadoras de período.
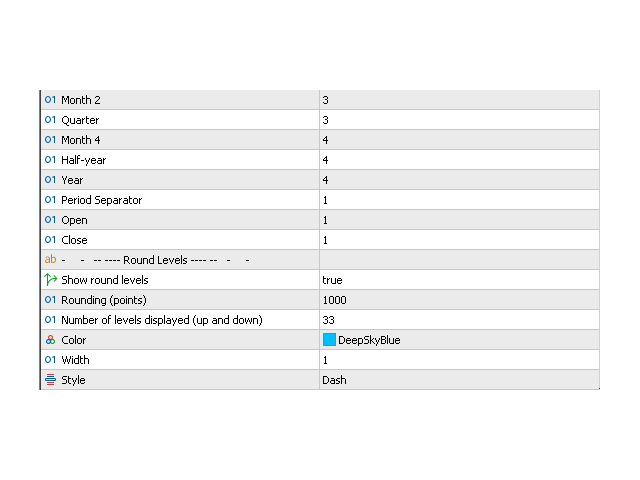
Round Levels (Niveles redondos)
Show round levels — Mostrar niveles redondos.
Rounding (points) — Redondeo (puntos).
Number of levels displayed (up and down) — el número de niveles que se mostrarán, arriba y abajo desde el nivel actual.
Color — Color.
Width — Ancho.
Style — Estilo.
El indicador muestra OHLC (HLOC) de los períodos de tiempo especificados (barras personalizadas o velas personalizadas).


Great tool for price action trading. Developer does great work and listens to user feedback.