Harmonic 50
- Indicadores
-
Sergey Deev
 I'm implementing your ideas in MQL4: https://www.mql5.com/ru/job/new?prefered=work2it
 - Versión: 1.2
- Actualizado: 14 junio 2019
- Activaciones: 5
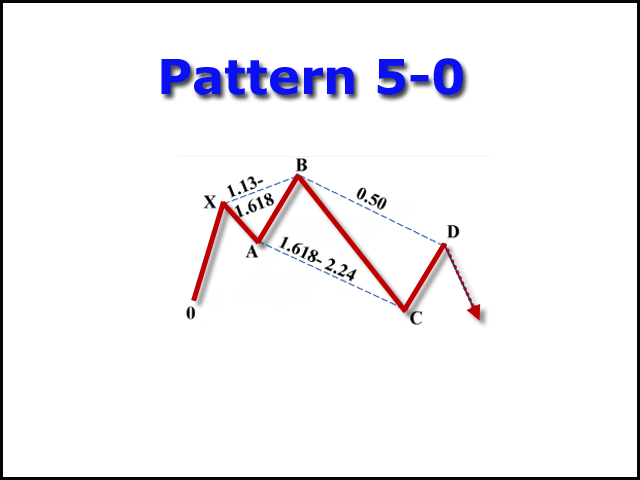
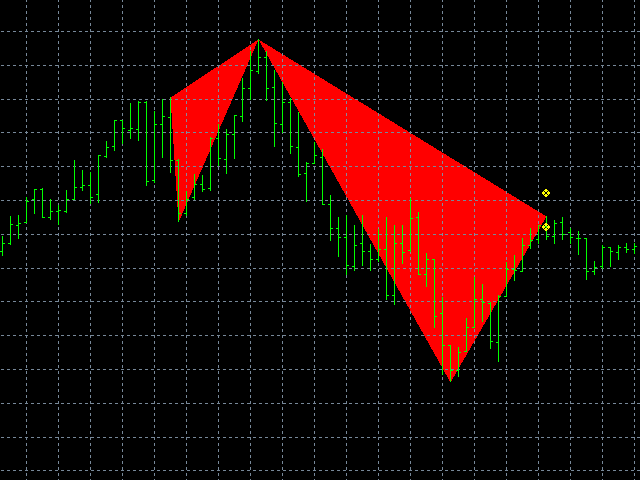
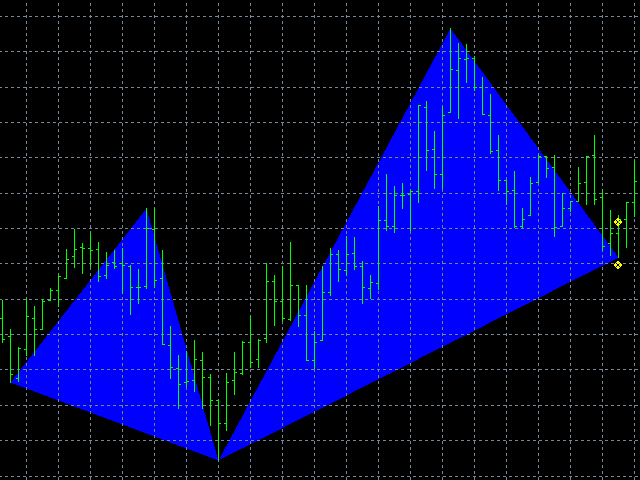
El indicador detecta y muestra el patrón armónico 5-0 en el gráfico según el esquema proporcionado en la captura de pantalla. El patrón es trazado por los valores extremos del indicador ZigZag (incluido en los recursos, no requiere instalación adicional). Después de detectar el patrón, el indicador notifica de que por la ventana emergente, una notificación móvil y un correo electrónico. El indicador destaca no sólo la figura completa, sino también el momento de su formación. Durante la formación, la figura se muestra mediante contornos triangulares. Una vez que la figura está finalmente formada, se muestra en el gráfico una zona de inversión potencial.
Parámetros
- zzDepth, zzDev, zzBack - Parámetros del zigzag
- AB_min (ab/ax), AB_max (ab/ax) - relación mínima y máxima de los niveles AB y AX
- BC_min (bc/ab), BC_max (bc/ab) - relaciónmínima y máxima de los niveles BC y AB
- CD_min(cd/bc), CD_max ( cd/bc) - relación mínima y máxima de los niveles CD y BC.
- bearColor - color del patrón bajista
- bullColor - color del patrón alcista
- CountBars - limitar la cantidad de barras a procesar por el indicador (reduce el tiempo de descarga inicial)
- UseAlert - habilitar mensajes emergentes
- UseNotification - habilita las notificaciones push
- UseMail - habilita las notificaciones por correo electrónico
- prefix - etiqueta de texto para garantizar la unicidad de los objetos indicadores en el gráfico (si se adjuntan varios indicadores al gráfico, deben introducirse valores diferentes en estos parámetros)
- MessageAdd - la cadena de texto añadida a las notificaciones enviadas por el indicador.


El usuario no ha dejado ningún comentario para su valoración