RenkoZigZag
- Indicadores
-
Sergey Deev
 I'm implementing your ideas in MQL4: https://www.mql5.com/ru/job/new?prefered=work2it
 - Versión: 1.4
- Actualizado: 6 abril 2018
- Activaciones: 5
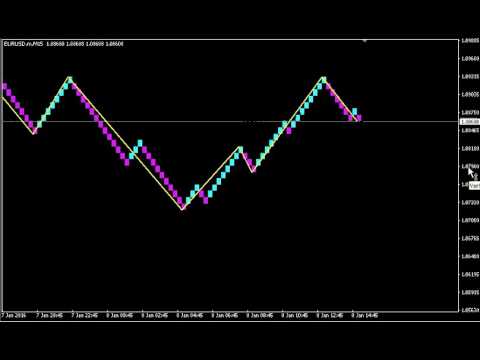
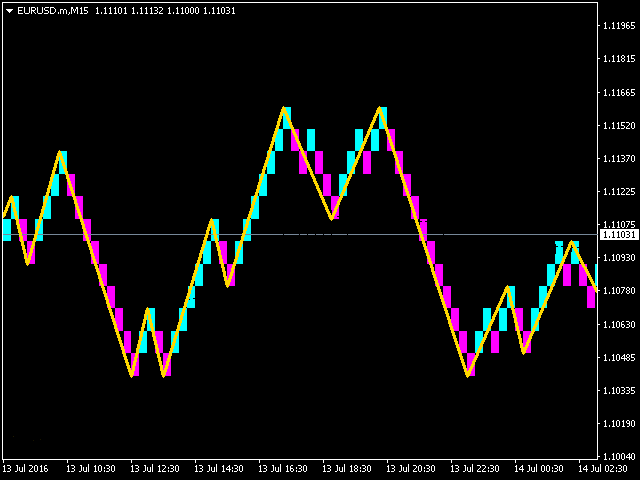
El indicador muestra barras Renko en el gráfico y las utiliza para trazar el ZigZag - líneas de tendencia que conectan los mínimos y máximos locales del movimiento del precio.
Renko - visualización especializada de la acción del precio, en la que el gráfico se muestra no cada barra del marco de tiempo, pero sólo bajo la condición de que el precio había pasado más del número especificado de puntos. Las barras Renko no están ligadas a un marco de tiempo, por lo que el indicador puede trabajar en cualquier marco de tiempo con la misma eficiencia.
Esta implementación del ZigZag se traza en base a dos parámetros - zzDev (desviación mínima como porcentaje del movimiento anterior) y zzBack (el número mínimo de barras Renko formadas en la dirección opuesta al movimiento anterior).
Descripción de los parámetros del indicador:
- RenkoBar - tamaño de una barra Renko en puntos (recalculado automáticamente para cotizaciones de 5 dígitos);
- CountBars - número de barras Renko mostradas en el gráfico;
- bearColor - color de una barra Renko bajista;
- bullColor - color de una barra Renko alcista;
- hideBars - bandera para ocultar las barras habituales en el gráfico;
- zzDev - desviación del movimiento anterior en porcentaje;
- zzBack - desviación del movimiento anterior como número de barras Renko;
- zzColor - color de las líneas ZigZag;
- zzWidth - anchura de las líneas ZigZag.