RenkoSarMA
- Indicadores
-
Sergey Deev
 I'm implementing your ideas in MQL4: https://www.mql5.com/ru/job/new?prefered=work2it
 - Versión: 1.5
- Actualizado: 18 noviembre 2021
- Activaciones: 5
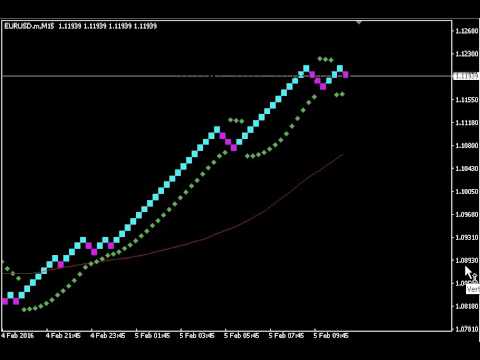
El indicador calcula y muestra barras renko utilizando datos MA y PSAR, así como proporciona señales de compra/venta.
Renko es un método de visualización de precios no trivial. En lugar de mostrar cada barra dentro de un intervalo de tiempo, sólo se muestran las barras en las que el precio se movió un cierto número de puntos. Las barras de Renko no dependen de un intervalo de tiempo, por lo que el indicador funciona en cualquier marco temporal sin perder su eficacia.
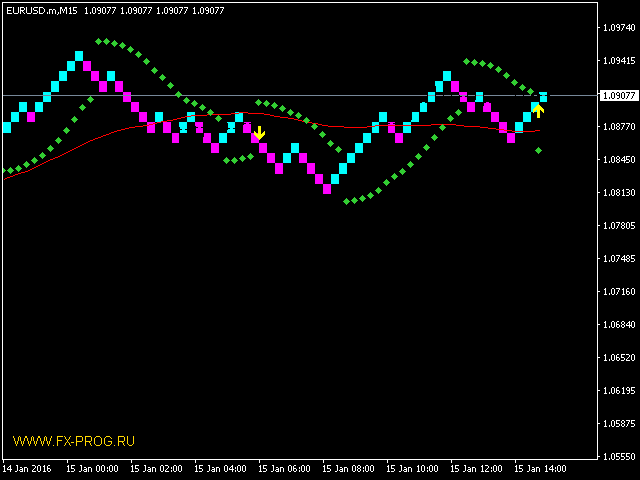
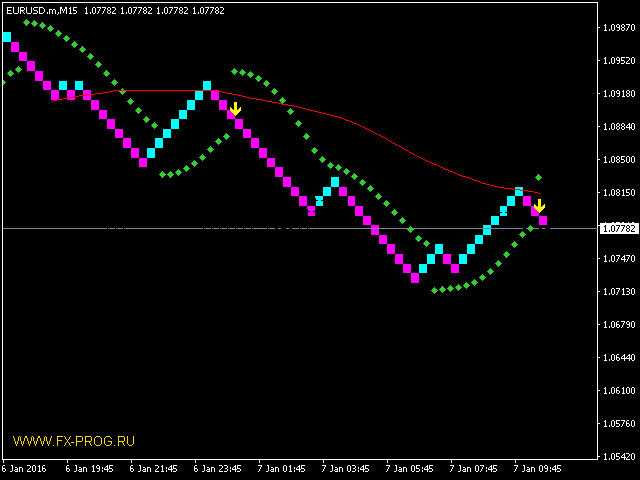
- La señal de compra se forma cuando las lecturas PSAR se están moviendo hacia abajo, MA se está moviendo hacia arriba, el precio está cerrando por encima de MA, mientras que PSAR está cerrando por debajo de ella;
- señal de venta se forma cuando las lecturas PSAR se mueven hacia arriba, MA se mueve hacia abajo, el precio está cerrando por debajo de MA, mientras que PSAR está cerrando por encima de ella.
Las señales se muestran como flechas, mensajes en una ventana emergente, correos electrónicos y notificaciones push. El indicador también genera eventos personalizados EventChartCustom para utilizar la señal para la automatización de operaciones. El evento generado por el indicador puede ser procesado por el EA en la función OnChartEvent. El indicador pasa los siguientes parámetros al manejador del evento: id - identificador; dparam - valor PSAR para colocar un stop loss; sparam - mensaje de texto. Sólo se muestran los últimos patrones alcistas y bajistas formados.
Parámetros
- RenkoBar - tamaño de la barra renko en puntos (recalculado automáticamente para cotizaciones de cinco dígitos);
- CountBars - número de barras renko mostradas en un gráfico;
- bearColor - color de la barra renko bajista;
- bullColor - color de la barra renko alcista;
- hideBars - bandera de ocultar barras estándar en un gráfico;
- MA_Period - Período de la MA;
- MA_Color - Color de la MA;
- SAR_Step, SAR_Max - parámetros del indicador PSAR;
- SAR_Color - color del punto PSAR;
- SignalColor - color de la flecha de señal;
- useAlert - alertas emergentes;
- useMail - alertas por correo electrónico;
- useNotification - notificaciones push;
- CustomEventBuy - indicador de evento de compra personalizado (0 - desactivado);
- CustomEventSell - indicador de evento de venta personalizado (0 - desactivado).