RenkoMaPriceChannel
- Indicadores
-
Sergey Deev
 I'm implementing your ideas in MQL4: https://www.mql5.com/ru/job/new?prefered=work2it
 - Versión: 1.6
- Actualizado: 18 noviembre 2021
- Activaciones: 5
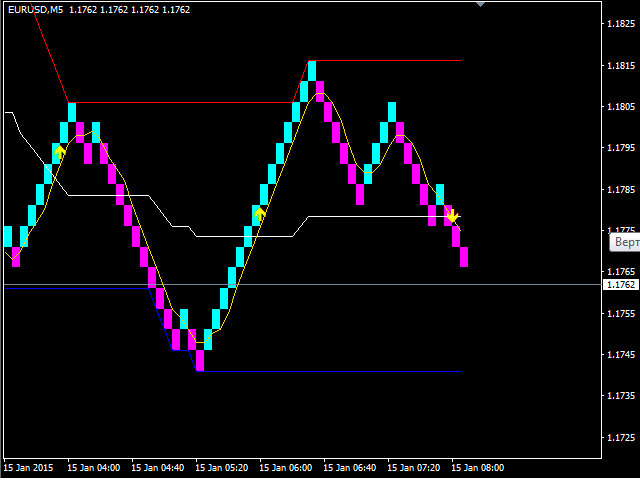
El indicador muestra barras Renko en el gráfico, utiliza sus datos para calcular y mostrar la media móvil, PriceChannel y genera señales de compra/venta.
Renko es un método de visualización de precios no trivial. En lugar de mostrar cada barra dentro de un intervalo de tiempo, sólo se muestran las barras en las que el precio se movió un determinado número de puntos. Las barras Renko no dependen de un intervalo de tiempo, por lo que el indicador funciona en cualquier marco temporal sin perder su eficacia.
El indicador PriceChannel muestra las fronteras superior e inferior del precio durante el periodo especificado y la línea media en el gráfico.
Una señal de compra se genera cuando la media móvil cruza la línea media de PriceChannel desde abajo, señal de venta - desde arriba.
Las señales se muestran como flechas, mensajes en una ventana emergente, correos electrónicos y notificaciones push. El indicador también genera EventChartCustom evento personalizado para el uso de señales para automatizar el proceso de negociación. El evento generado por el indicador puede ser procesado por el EA en la función OnChartEvent. El indicador pasa los siguientes parámetros al manejador del evento: id - identificador; dparam - valor de la línea PriceChannel correspondiente para colocar un stop loss; sparam - mensaje de texto.
El indicador puede adjuntarse al gráfico de cualquier símbolo con cualquier marco temporal.
Parámetros
- RenkoBar - tamaño de la barra renko en puntos (recalculado automáticamente para cotizaciones de cinco dígitos);
- CountBars - número de barras renko mostradas en el gráfico;
- bearColor - color de la barra renko bajista;
- bullColor - color de la barra renko alcista;
- hideBars - bandera para ocultar las barras estándar del gráfico;
- useM1 - utilizar cotizaciones M1 para el dibujo inicial del indicador;
- chPeriod - Período del canal de precios;
- chWidth - ancho mínimo de PriceChannel (recalculado automáticamente para cotizaciones de 5 dígitos);
- UpColor - el color de la línea superior del PriceChannel;
- DownColor - el color de la línea inferior del PriceChannel;
- MiddleColor - el color de la línea media de PriceChannel;
- MA_Period - Período de la MA;
- MA_Color - color de la MA;
- useSlowMa - uso de la media móvil lenta;
- Slow_MA_Period - el período de la media móvil lenta;
- Slow_MA_Color - color de la media móvil lenta;
- SignalColor - color de la flecha de señal;
- useAlert - alertas emergentes;
- useMail - alertas por correo electrónico;
- useNotification - notificaciones push;
- CustomEventBuy - indicador de evento personalizado de compra (0 - desactivado);
- CustomEventSell - indicador de evento de venta personalizado (0 - desactivado).
Перерисовывется так чтобы на истории все было красиво. Выкинул 12 баксов.
Upd:
Индикатор не верно рисует кирпичи ренко, автор отказался исправлять.