Harmonic Cypher
- Indicadores
-
Sergey Deev
 I'm implementing your ideas in MQL4: https://www.mql5.com/ru/job/new?prefered=work2it
 - Versión: 1.2
- Actualizado: 23 agosto 2019
- Activaciones: 5
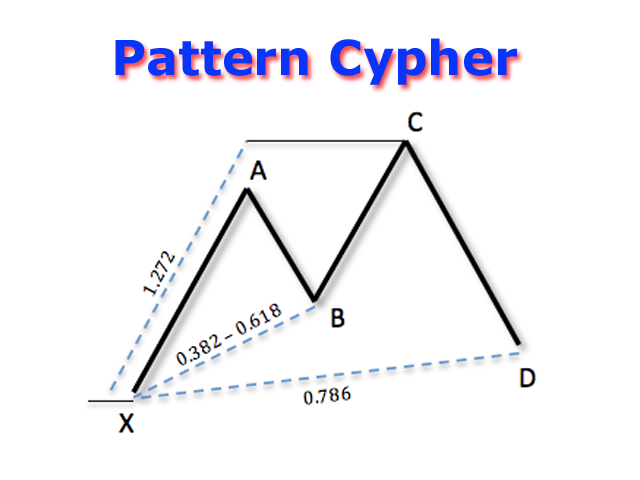
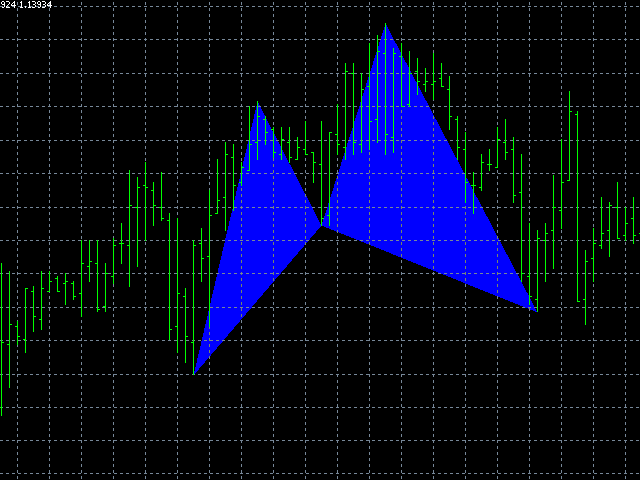
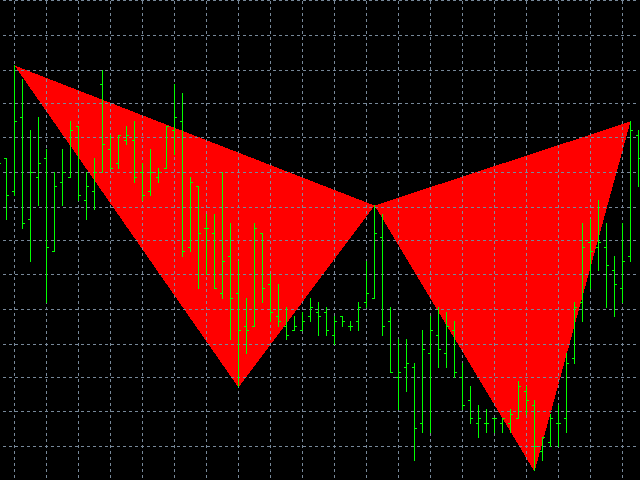
El indicador detecta y muestra Cypher patrón armónico también conocido como Anti-Butterfly (ver la captura de pantalla). El patrón es trazado por los valores extremos del indicador ZigZag (incluido en los recursos, no es necesario instalar). Después de detectar el patrón, el indicador notifica de ello mediante una ventana emergente, una notificación móvil y un correo electrónico. El indicador destaca el proceso de formación del patrón y no sólo el patrón completo. En el primer caso, se muestra en los triángulos de contorno. Una vez completado el patrón, aparece en el gráfico una zona de inversión potencial. La configuración por defecto es algo más amplia para una mayor cantidad de patrones.
Parámetros
- zzDepth, zzDev, zzBack - Parámetros del zigzag
- AB_min, AB_max - relación mínima y máxima de los niveles AB y AX
- CX_min, CX_max - relación mínima y máxima de los niveles CX y AX
- CD_min, CD_max - relación mínima y máxima de CD y CX
- bearColor - color del patrón bajista
- bullColor - color del patrón alcista
- CountBars - limitar la cantidad de barras a procesar por el indicador (reduce el tiempo de descarga inicial)
- UseAlert - habilitar mensajes emergentes
- UseNotification - habilita las notificaciones push
- UseMail - habilita las notificaciones por correo electrónico
- prefix - etiqueta de texto para los objetos indicadores en un gráfico (introduzca varios valores para estos parámetros cuando aplique varios indicadores al gráfico)
- MessageAdd - línea de texto añadida a las notificaciones enviadas a los indicadores
- ShowPreset - permitir la visualización del patrón durante su formación
- CustomEventBuy,CustomEventSell - eventos del gráfico
Ejemplo de uso de señales en EA:
void OnTick() {
 double x;
 x = iCustom(Symbol(),PERIOD_CURRENT,"Harmonic-Cypher",0,1); if (x != 0 && x != EMPTY_VALUE) goBuy();
 x = iCustom(Symbol(),PERIOD_CURRENT,"Harmonic-Cypher",2,1); if (x != 0 && x != EMPTY_VALUE) goSell();
}

void goBuy() { // función para abrir BUY
}

void goSell() { // función para abrir VENDER
}
void OnChartEvent(const int id, const long &lparam, const double &dparam, const string &sparam) {
 switch (id) {
  case CHARTEVENT_CUSTOM+100:
   goBuy(); break;
  case CHARTEVENT_CUSTOM+101:
   goSell(); break;
 }
}

void goBuy() { // función para abrir BUY
}

void goSell() { // función para abrir VENDER
}


El usuario no ha dejado ningún comentario para su valoración