Blahtech Daily Range
- Indicadores
-
Blahtech Limited
 Professional IT developer with over 20 years of experience working with top tier investment banks (Barclays Capital, Credit Suisse, Merrill Lynch, ABN Amro, Mizuho Bank) - LinkedIn profile available on request
 - Versión: 4.0
- Actualizado: 18 noviembre 2024
- Activaciones: 10
Antes: 99 $Ahora: 49
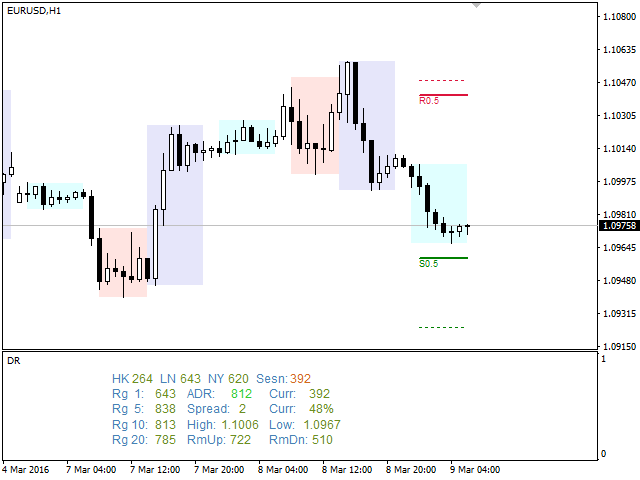
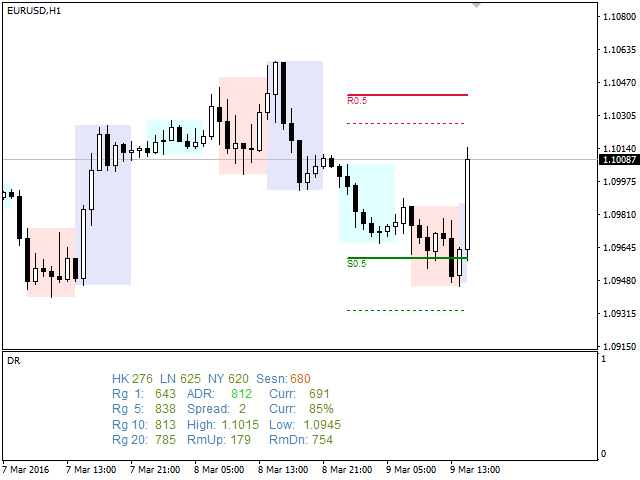
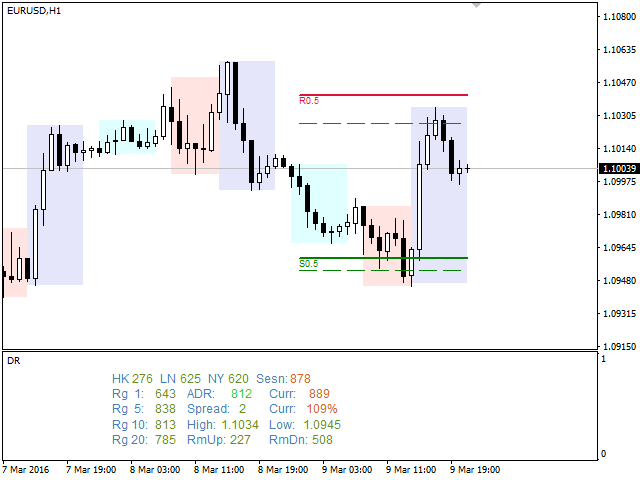
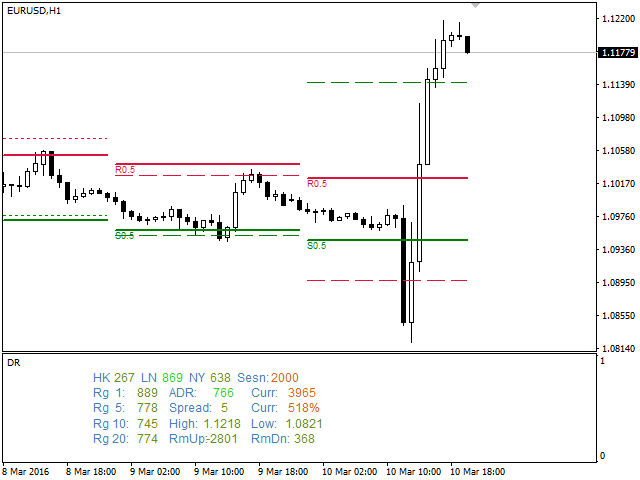
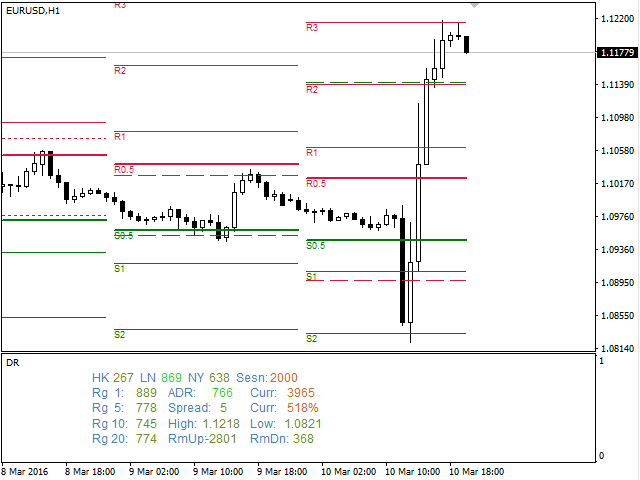
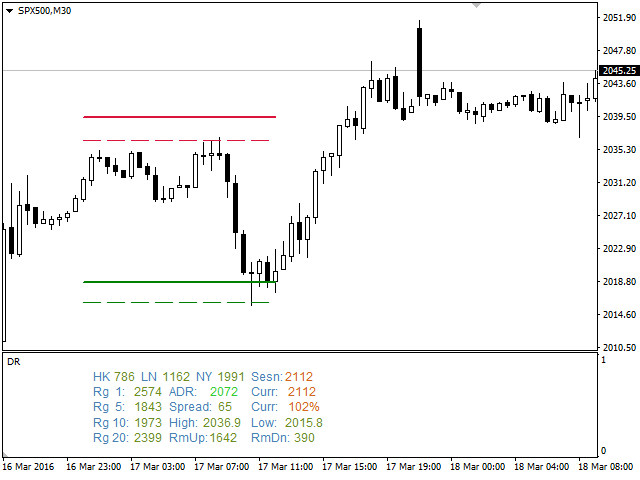
El indicador de Rango Diario de Blahtech muestra el rango medio diario junto con los rangos individuales de la sesión. Utilizando el precio de apertura diario como referencia, el indicador muestra los objetivos de rango fijo y dinámico como líneas en los gráficos. Estas líneas muestran claramente cuándo se ha agotado el rango medio. Los rangos diarios y de sesión pueden ser útiles para confirmar entradas o establecer objetivos y es un excelente potenciador de probabilidades para muchos sistemas de trading.
Enlaces [ Documentación |Instalar | Actualizar | Formación | Todos los Productos ]
Características destacadas
- Rangos diarios
- Rangos de sesión
- Rangos simples o múltiples
- Líneas gráficas de agotamiento fijas y dinámicas
- Resaltado de rangos mayores
- Objetivos y valores destacados configurables
- Backtest directamente en el gráfico
- Alertas y mensajes personalizables
- Periodo seleccionable para plazos superiores
- Teclas de acceso rápido
Desarrolladores - iCustom Buffers
- Vacío
- ADR
- Abrir
- Cerrar
- Alto
- Bajo
- Habitación Arriba
- RoomDown
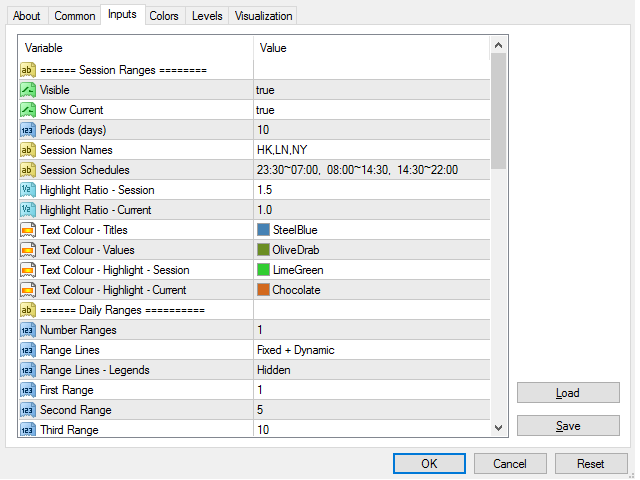
Entradas
Rangos de sesión
- Visible - Mostrar el texto de los rangos de sesión
- Mostrar actual - Mostrar el rango de sesión actual
- Periodos (días) - Número de días para el tamaño medio de la sesión
- Nombres de sesión- Lista de nombres de sesión separados por comas
- Horarios de sesión- Lista de horarios de sesión separados por comas
- Ratio de resaltado- Sesiones - Porcentaje relativo en el que se debe resaltar una sesión
- Ratio de resaltado-Actual - Porcentaje en el que debe resaltarse la sesión actual
- Color del texto - Títulos
- Color del texto - Valores
- Color del texto - Resaltar - Sesión
- Color del texto - Resaltar - Actual
- Zona Color 1 - Color de la sesión 1
- Zona Color 2 - Color de la sesión 2
- Zona Color 3 - Color de la sesión 3
- Zona Color 4 - Color de la sesión 4
- Número de Rangos- Número de rangos a mostrar en el gráfico
- Líneas deRango - Mostrar / ocultar las líneas fijas, de agotamiento y de proyección en el gráfico. Tecla de acceso rápido "A
- Líneas deRango - Leyendas - Texto a mostrar debajo de las líneas - Proyecciones/Tiempos. Tecla de acceso rápido "\"
- Primer Rango - Número de periodos a utilizar para el primer rango
- Segundo Rango
- Tercer intervalo
- Cuarto Rango
- Tipo de cálculo de rango medio - Rango medio / Rango medio real
- Composición del rango promedio - Elija los rangos que componen el cálculo del rango promedio
- Periodo - Periodo a utilizar para los rangos (por defecto Diario)
- Proyecciones- Fijas - Tamaño de la primera proyección fija
- Proyecciones- Niveles - Lista separada por comas de las otras proyecciones
- Ratio de resaltado -Actual - Porcentaje en el que debe resaltarse el rango actual
- Texto Título ADR- Texto a utilizar para el título ADR
- Color del texto -Títulos
- Color del texto - Valores
- Color del texto - Valor ADR
- Color del texto - Resaltar - Actual
- Color líneas- Alta- Color para líneas altas
- Color de líneas- Bajo- Color para líneas bajas
- Líneas Precios - Mostrar Precios a la derecha de las líneas en el gráfico. Tecla de acceso rápido "P
- Estilo de línea- Objetivo - Estilo de línea para la línea objetivo antes del agotamiento
- Estilo de línea- Agotado - Estilo de línea para la línea objetivo después del agotamiento
- Estilo de línea - Proyecciones - Fijas
- Estilo de línea - Proyecciones - Niveles
- Líneas Proyecciones - Espesor Fijo
- Hora de inicio del rango diario (GMT) - Opción para cambiar la hora de inicio del día
- Desplazar Rango del Domingo- Opción para desplazar el rango del domingo al lunes o al viernes
- Id de instancia
- Fuente del texto
- Tamaño del texto - Títulos / Valores
- Tamaño del texto - Leyendas de línea
- Espacios de texto
- Columna de inicio de texto
- Texto Inicio Fila
- Alertas - Popup
- Alertas - Correo electrónico
- Alertas - Notificación
- Alertas - Sonido Wav
- Alertas - Segundos de retardo de inicio
- Alertas - Texto del mensaje
- Alerta Email - Asunto
- Alerta de correo electrónico - Cuerpo del texto
- Mapa de teclas de accesorápido - Permite al usuario reasignar las teclas de acceso rápido
- "A" Muestra/oculta las líneas del gráfico
- "B" Activa/desactiva el modo Backtest
- "C" Borra todos los gráficos de los indicadores Blahtech del gráfico. Si se vuelve a pulsar "C", se recuperan.
- "R" Reinicia el indicador. (El modo Backtest y los valores de las teclas de acceso rápido se restablecen)
- "P" Muestra los precios a la derecha de las líneas del gráfico.
- "\" Muestra/oculta el texto de la leyenda bajo las líneas
- Tiempo de Expiración del Modo Backtest (mins) - Establece el número de minutos a esperar antes de cancelar el modo backtest (0 = sin límite)
- Desplazamiento GMT - Usar horario de verano - Ajuste la hora en 1 hora si su ordenador local ha cambiado al modo de horario de verano
- Desplazamiento GMT - Desplazamiento GMT manual en segundos. Ajústelo si el reloj de su corredor no coincide con las horas previstas de la sesión


The best ADR indicator. Custom ADR time range. I use 8: 00- 22:00 CET. Blahtech suply demand + volume profile + ADR is the best combination. I still use pivot points. no delayed oscillators, no candle, only limit orders.