Blahtech Daily Range
- Indikatoren
-
Blahtech Limited
 Professional IT developer with over 20 years of experience working with top tier investment banks (Barclays Capital, Credit Suisse, Merrill Lynch, ABN Amro, Mizuho Bank) - LinkedIn profile available on request
 - Version: 4.0
- Aktualisiert: 18 November 2024
- Aktivierungen: 10
War: $99Jetzt: $49
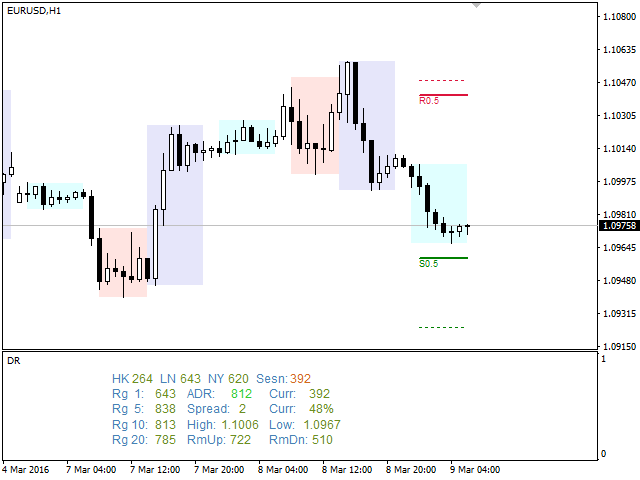
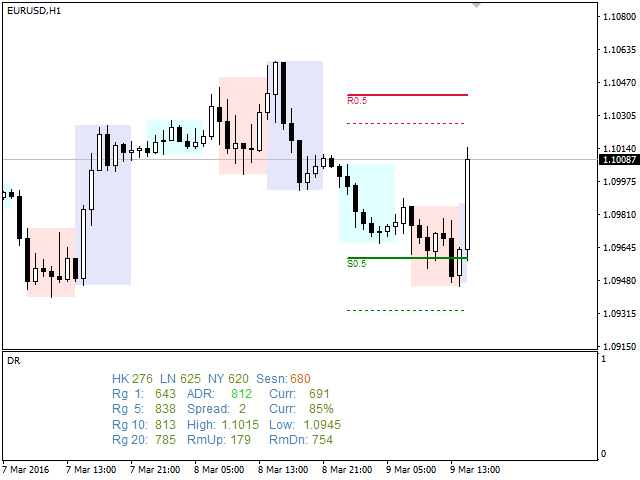
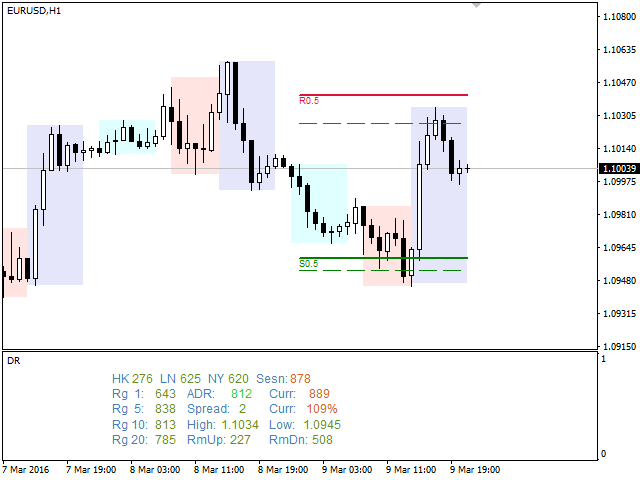
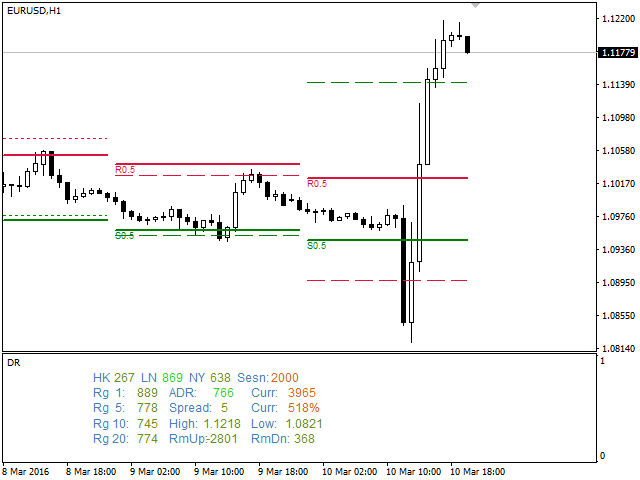
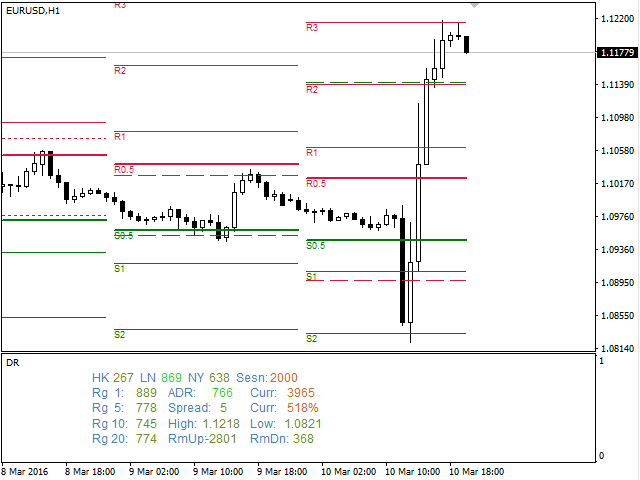
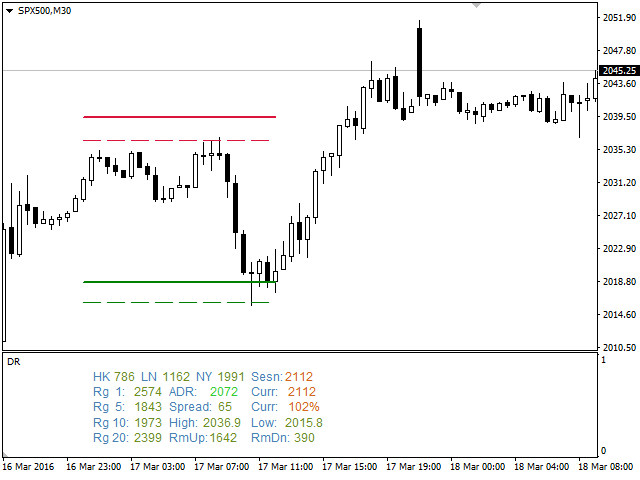
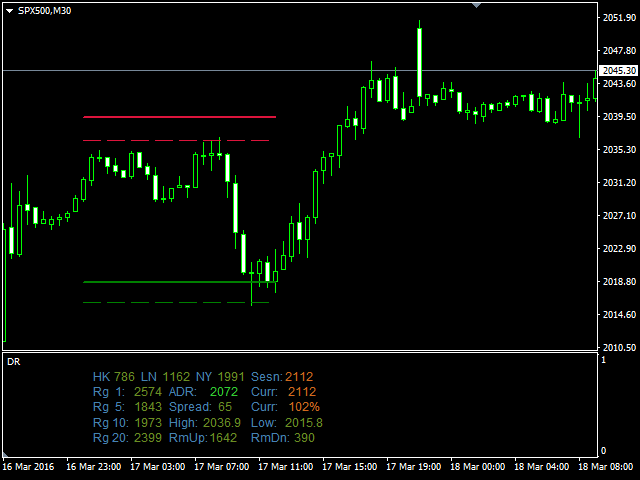
Der Blahtech Daily Range-Indikator zeigt die durchschnittliche tägliche Spanne neben den einzelnen Sitzungsspannen an. Unter Verwendung des täglichen Eröffnungskurses als Referenz zeigt der Indikator feste und dynamische Kursziele als Linien auf den Charts an. Diese Linien zeigen deutlich, wann die durchschnittliche Spanne ausgeschöpft ist. Tages- und Sitzungsspannen können nützlich sein, um Einstiege zu bestätigen oder Ziele festzulegen, und sie sind eine hervorragende Möglichkeit zur Verbesserung der Quoten für viele Handelssysteme.
Links [ Dokumentation |Installation | Update | Training| Alle Produkte ]
Funktions-Highlights
- Tägliche Ranges
- Session-Bereiche
- Einzelne oder mehrere Bereiche
- Feste und dynamische Erschöpfungsdiagrammlinien
- Hervorhebung von größeren Bereichen
- Konfigurierbare Ziele und Highlight-Werte
- Backtesting direkt im Chart
- Anpassbare Alarme und Meldungen
- Wählbarer Zeitraum für höhere Zeitrahmen
- Schneller Zugriff über Hotkeys
Entwickler - iCustom Buffers
- Leere
- ADR
- Öffnen
- Schließen
- Hoch
- Niedrig
- RaumAuf
- RaumRunter
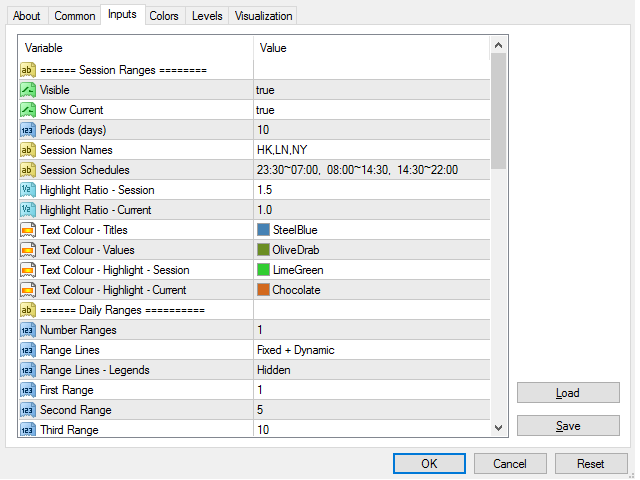
Eingänge
Session-Bereiche
- Sichtbar - Zeigt den Text der Sitzungsbereiche an
- Show Current - Zeigt den aktuellen Sessionbereich an
- Perioden (Tage) - Anzahl der Tage für die durchschnittliche Sitzungsgröße
- Session Names - Kommagetrennte Liste von Sitzungsnamen
- Sitzungszeitpläne - Kommagetrennte Liste der Sitzungszeiten
- Hervorhebungsverhältnis - Sitzungen - Relativer Prozentsatz, mit dem eine Sitzung hervorgehoben werden soll
- Hervorhebungsverhältnis - Aktuell - Prozentsatz, mit dem die aktuelle Sitzung hervorgehoben werden soll
- Textfarbe - Überschriften
- Textfarbe - Werte
- Textfarbe - Hervorheben - Sitzung
- Textfarbe - Hervorhebung - Aktuell
- Zonenfarbe 1 - Farbe für Sitzung 1
- Bereich Farbe 2 - Farbe für Sitzung 2
- Bereich Farbe 3 - Farbe für Sitzung 3
- Zonenfarbe 4 - Farbe für Sitzung 4
- Anzahl der Bereiche - Anzahl der Bereiche, die auf dem Chart angezeigt werden sollen
- Bereichslinien - Ein- und Ausblenden der fixen, erschöpfenden und projizierten Linien auf dem Diagramm. Hot-Key "A"
- Range Lines - Legends - Text, der unter den Linien angezeigt wird - Projektionen/Timeframes. Tastaturkürzel "\"
- Erster Bereich - Anzahl der für den ersten Bereich zu verwendenden Perioden
- Zweiter Bereich
- Dritter Bereich
- Vierter Bereich
- Typ der Durchschnittsbereichsberechnung - Durchschnittlicher Bereich / Durchschnittlicher wahrer Bereich
- Zusammensetzung des Durchschnittsbereichs - Wählen Sie die Bereiche aus, aus denen die Berechnung des Durchschnittsbereichs besteht.
- Zeitrahmen - Zeitraum, der für die Bereiche verwendet werden soll (standardmäßig täglich)
- Projektionen - Fest - Größe der ersten festen Projektion
- Projections - Levels - Kommagetrennte Liste der anderen Projektionen
- Hervorhebungsverhältnis - Aktuell - Prozentsatz, mit dem der aktuelle Bereich hervorgehoben werden soll
- Text ADR Titel - Text, der für den ADR-Titel verwendet werden soll
- Textfarbe - Titel
- Textfarbe - Werte
- Textfarbe - ADR-Wert
- Textfarbe - Hervorhebung - Aktuell
- Linienfarbe - Hoch - Farbe für hohe Linien
- Linienfarbe - Niedrig - Farbe für niedrige Linien
- Linienpreise - Preise auf der rechten Seite der Linien im Diagramm anzeigen. Tastenkürzel "P"
- Linienstil - Ziel - Linienstil für die Ziellinie vor der Erschöpfung
- Linienstil - Erschöpft - Linienstil für die Ziellinie nach Erschöpfung
- Linienstil - Projektionen - Fixiert
- Linienstil - Projektionen - Levels
- Linien Projektionen - Feste Dicke
- Daily Range Start Hour (GMT) - Option zum Ändern der Startstunde des Tages
- Roll Sunday Range - Option zum Verschieben des Sonntagsbereichs auf Montag oder Freitag
- Instanz-ID
- Text Schriftart
- Textgröße - Überschriften / Werte
- Textgröße - Zeilenlegenden
- Text Leerzeichen
- Text Startspalte
- Text Start Zeile
- Warnungen - Popup
- Warnmeldungen - E-Mail
- Alerts - Benachrichtigung
- Alarme - Sound-Wav-Datei
- Alarme - Startverzögerung in Sekunden
- Warnung - Nachrichtentext
- Alarm-E-Mail - Betreff
- Warn-E-Mail - Nachrichtentext
- Hot Key Map - Ermöglicht dem Benutzer die Neuzuweisung der Hot-Keys
- "A" Zeigt/verbirgt die Linien auf dem Diagramm
- "B" Schaltet den Backtest-Modus ein/aus
- "C" Löscht alle Blahtech-Indikatorgrafiken aus dem Chart. Erneutes Drücken von "C" bringt sie wieder zurück
- "R" Setzt den Indikator zurück. (Backtest-Modus und alle Hot-Key-Werte werden zurückgesetzt)
- "P" Zeigt die Preise rechts von den Chartlinien an.
- "\" Blendet den Legendentext unter den Linien ein/aus
- Backtest-Modus-Ablaufzeit (Min.) - Legen Sie die Anzahl der Minuten fest, die gewartet werden soll, bevor der Backtest-Modus beendet wird (0 = kein Limit)
- GMT Offset - Use Daylight Savings - Passen Sie die Zeit um 1 Stunde an, wenn Ihr lokaler Computer auf Sommerzeit umgestellt hat
- GMT-Offset - Manueller GMT-Offset in Sekunden. Einstellen, wenn die Uhr Ihres Brokers nicht mit den erwarteten Sitzungszeiten übereinstimmt


The best ADR indicator. Custom ADR time range. I use 8: 00- 22:00 CET. Blahtech suply demand + volume profile + ADR is the best combination. I still use pivot points. no delayed oscillators, no candle, only limit orders.