Daily Dipper Skipper RSI Scanner MT4

  • Indicators
  • Callum Gunn
    Callum Gunn
    CalmFx - calm, clear trading tools for MetaTrader 5.
    I build and support the CalmFx toolkit: on-chart panels, multi-symbol scanners and indicators designed to work side by side on the same charts, on any symbol and any screen size, from a laptop to a 40-inch TV.
    CalmFx on the Market:
  • Version: 4.20
  • Activations: 10

The Daily Dipper Skipper is an on-chart dashboard that watches a list of symbols on several timeframes at once and shows where RSI is in, or approaching, an oversold ("dip") or overbought ("rip") zone. It is a monitoring and alerting tool. It does not open, modify or close trades.

It reads RSI on D1, H4, H1, M30 and M15. Each symbol is given a class from A to E that sets how many of those timeframes it is watched on, so your most-traded instruments can be watched on all five while quieter ones stay on the Daily. Up to three RSI levels can be used (by default 30/70, with optional 25/75 and 20/80).

What the panel shows:

  • The symbols in the dip zone and in the rip zone right now, with the timeframe for each.
  • "Next up": the symbol closest to entering a zone.
  • A watchlist of symbols approaching a zone, sorted by distance, each with a proximity bar and a per-timeframe RSI heat strip.
  • Open positions on the account with profit, age and a progress bar toward take profit (read-only).
  • Optional RSI divergence counts.

Signal rules (your choice):

  • In zone: RSI at or beyond the level.
  • Cross: RSI turning back out of the zone.
  • Divergence: price makes a new low/high that RSI does not confirm.
  • Optional higher-timeframe moving average filter.

Alerts:

  • Pop-up and sound when a new signal appears, and optionally when a symbol gets close to a zone.
  • Optional push notifications and email through the standard MetaTrader settings. Alerts are grouped and rate-limited so a busy market doesn't flood your phone.
  • Optional CSV log of every signal.

Usability:

  • Drag the panel by its header; drag the bottom-right corner to resize. DPI-aware.
  • Remembers its position and size. A collapse button shrinks it to one summary line.
  • A "?" button shows the RSI levels in use and how many symbols each timeframe covers.

Setup:

  • Works on any MetaTrader 4 broker. Use your own symbol list or scan Market Watch (up to 200 symbols). Broker symbol suffixes are matched automatically.
  • On first load it downloads any missing price history in the background and shows a loading count until every symbol is ready.
  • In the Strategy Tester it watches the tested symbol only.
  • Run it on a VPS if you want alerts around the clock.

MetaTrader 4 notes:

  • MetaTrader 4 has no H12 or H8 chart periods, so this version watches D1, H4, H1, M30 and M15.
  • Alerts wait a short warm-up after loading while MetaTrader 4 finishes downloading history.

What it does not do:

  • It does not trade and makes no prediction about future prices. RSI readings are information for your own analysis, not buy or sell signals, and nothing here is financial advice.

Part of the CalmFx toolkit

  • The MetaTrader 5 version is also available, along with the CalmFx rankers and Trading Panel.
  • All CalmFx tools, for MetaTrader 4 and MetaTrader 5, are on the CalmFx seller page.
Recommended products
A useful scanner/dashboard that shows the RSI values for multiple symbols and time-frames. It can be easily hidden/displayed with a simple click on the scanner man top left of the dashboard. You can input upper and lower RSI values and the colours can be set to show when above/below these values. The default values are 70 and 30. There are also input colours for when the RSI is above or below 50 (but not exceeding the upper/lower levels Symbols and time-frames are input separated by commas.
Impulse fractals indicator - is counter-trend oriented complex market fractal pattern.  Market creates bull/bear impulse, trend starts, fractals on impulsed wave are an agressive pullback signals. Buy arrow is plotted when market is bearish and it's impulse showed up-side fractal, and sell arrow is plotted when market is bullish and it's impulse showed dn-side fractal. Main indicator's adjustable inputs : impulsePeriod - main period of impulse histogram  filterPeriod  - smoothes impulse accordi
This indicator is an indicator for automatic wave analysis that is perfect for practical trading! Case... Note:   I am not used to the Western name for wave classification. Influenced by the naming habit of Chaos Theory (Chanzhongshuochan), I named the basic wave as   pen   , the secondary wave band as   segment   , and the segment with trend direction   as main trend segment   (this naming method will be used in future notes, let me tell you in advance), but the algorithm is not closely relate
Currency Strength Oscillator MT4
Narayanan Mohanan Mohanan Krishnan
Currency Strength Oscillator for MetaTrader 4 A relative currency strength indicator that plots the history of the eight majors. This currency strength oscillator plots the relative strength of the eight major currencies as a history, decomposed from the 28 major pairs. While a standard currency strength meter tells you where things stand right now, this shows how they got there — which currency has been strengthening, which has rolled over, and where the ranking changed hands. All eight series
The R Scalper Arrows indicator delivers easy to read buy and sell signal arrows for any forex pair. It works good for short-term trend predictions: Up arrows suggest the pair is short-term trending up. Down arrows suggest the pair is short-term trending down. For long trades, place your stop-loss below the dots. For short trades, place your stop-loss above the dots. Tip You can use this indicator together with a longer term period trend-following forex indicator such as a simple moving average o
Indicator for binary options arrow is easy to use and does not require configuration works on all currency pairs, cryptocurrencies buy signal blue up arrow sell signal red down arrow tips do not trade during news and 15-30 minutes before their release, as the market is too volatile and there is a lot of noise it is worth entering trades one or two candles from the current period (recommended for 1 candle) timeframe up to m 15 recommended money management fixed lot or fixed percentage of the depo
ArchIntel Pivot Point
Raphael Adetunji Olaiyapo
This tool draws all the pivot point lines on chart. It is important to remind/tell you that there are 5 pivot method according to BabyPips website. All these methods have their unique mathematical formula. 1. Floor Method. 2. Woodie Method. 3. Camarilla Method. 4. DeMark Method. 5. Fibonacci Method. What makes this pivot tool unique is that you can click the "Fibonacci" button to select the pivot method you want. You can click the "Monthly" button to select the Period you want to use for the piv
Introduction to Fractal Pattern Scanner Fractal Indicator refers to the technical indicator that makes use of the fractal geometry found in the financial market. Fractal Pattern Scanner is the advanced Fractal Indicator that brings the latest trading technology after the extensive research and development work in the fractal geometry in the financial market. The most important feature in Fractal Pattern Scanner is the ability to measure the turning point probability as well as the trend probabi
This is  a dashboard indicator that displays the Average Level of each selected currency pairs that filters and gives us a signal for overbought (>=90%) or if price at extreme peak above 90, and/or oversold (<=10%) or if price at extreme peak below 10. The calculation is using Relative Strength Index default periods (2 & 9) applied to three different higher time frames H4,D1,&W1. This won't change or altered even if you change symbol or switch to lower time frames or even in monthly and year
Godfather
Ivan Simonika
The intelligent algorithm of the Godfather indicator accurately determines the trend, filters out market noise and generates entry and exit levels. The indicator will help in finding entry points when analyzing the price chart. The program first receives a "snapshot" of the graph, then analyzes it. The results are reported to the trader in the form of signals. The main purpose of this indicator is to determine the moments of entries and exits from transactions, so the indicator displays only th
Break and Retest Hunter MT4 is a powerful MetaTrader 5 indicator designed to automatically identify support and resistance levels, breakout structures, and potential retest opportunities in real time. Bonus Indicator: After purchasing Break and Retest Hunter , contact me to receive Trade Indicator Assistant EA completely free as a bonus utility. $65 for the next 10 copies . Next price is $120.  Combining adaptive market analysis, clear BUY/SELL signals, Fibonacci-based profit targets, and a pre
This indicator is based on the classical indicators: RSI (Relative Strength Index) and PSAR (Parabolic Stop and Reverse) and will be helpful for those who love and know how to use not a visual but digital representation of the indicators. The indicator shows values from 9 currency pairs. You will be able to change the main input parameters for RSI: OverboughtLevel = 70; OversoldLevel = 30; Period = 14; Price = PRICE_CLOSE; and PSAR: step = 0.02; maximum = 0.2; Also you may change Symb1 - Symb9 t
Master Manual: Complete Edition Aura HHLL   Platinum  V2.00 Integrated Manual This program is a tool that helps traders determine "what state the market is in right now?" most quickly amidst the complex movements of charts. It is the culmination of technical analysis combining the precision of price action with the intuitiveness of range trading. SECTION 01 Indicator   Key Components   Elements It provides the ability to read the structure of the market. 1. The System's 3 Core Axes HHLL Label
Note : The slow loading of the indicator issue has been addressed . This new version loads fast and does not slow the platform. Version 1.3 : We have updated the indicator to include an historical bar scanning option . So instead of scanning all bars in the history (which can make the indicator slow sometimes ) , you can select the maximum number of bars it can scan which can increase the performance and make the indicator faster. This indicator scans the 1-3 Trendline pattern . The indicator i
"Dynamic Scalping Oscillator" - is an advanced custom Crypto_Forex indicator - efficient Trading tool for MT4!  - New generation of Oscillators - see pictures to check how to use it. - Dynamic Scalping Oscillator has adaptive Oversold/Overbought zones. - Oscillator is an auxiliary tool to find exact entry points from dynamic OverSold/OverBought areas. - Oversold values: below Green line, Overbought values: over Orange line . - This indicator is great to combine with Price Action patterns as wel
RelicusRoad Dynamic Circles is a swing high and swing low indicator for MetaTrader 4 and MetaTrader 5 that marks turning points with circles at three lookback lengths at once: 9, 60 and 156 bars. Small turns and large turns sit on the same chart but look different. A short range dot shows a minor swing, while the larger medium and long range rings only appear where price made the extreme of a much longer window. Each circle can carry a short text label such as HH(60) or LL(156). How it works For
CCZ is an objective support/resistance zones built from consecutive candle-overlap through same price range, on any base timeframe   "From the maker of Risk Sentinel — risk-first position sizing that keeps your risk fixed as you drag the stop:   https://www.mql5.com/en/market/product/185979 " ================================================================================================================================================= The Main Concept: Classic support and resistance measures 
FREE
SuperTrend Alerts
Libertas LLC
3 (4)
SuperTrend Alerts adds alerts to the widely popular SuperTrend indicator. As the name suggests, SuperTrend is a trending indicator which works best in trendy (not choppy) markets. SuperTrend is extremely popular for intraday and daily trading, and can be used on any timeframe. Place a call when the price closes above the SuperTrend line, and place a put when the price closes below the SuperTrend line. These crossovers are highlighted by non-repainting up/down arrows. Alerts Email, message and s
Daily Trend Confluence Scanner Pro
Anthony Chukwujekwu Okparaeke
Daily Trend Confluence Scanner Daily Trend Confluence Scanner is a systematic multi-indicator trend-following tool designed to spot high-probability trade setups while filtering out market noise.   By evaluating market conditions strictly on completed daily candle closes (shift = 1), this indicator provides reliable, non-repainting signals based on four layers of technical confirmation.   Key Features 100% Non-Repainting: All calculations freeze upon daily candle close (shift = 1), eliminating
The Trend Professor is a moving average based indicator designed for the purpose of helping the community of traders to analyse the price trend. The indicator will be displayed in the main chart as it is indicated on the screenshot section. How it works The indicator has lines of moving averages and colored histograms to depict the direction of the trend. There will be a fast signal line colored blue/yellow/red at some points. The red/yellow colored lines stands for bearish trend/signal while th
Signal Arrows is an indicator that generates trade arrows. It generates trade arrows with its own algorithm. These arrows give buying and selling signals.  Can be used in all pairs. Sends a signal to the user with the alert feature. The indicator certainly does not repaint. Trade rules Enter the signal when the buy signal arrives. In order to exit from the transaction, an opposite signal must be received. It is absolutely necessary to close the operation when an opposite signal is received. The
Mystic Arrow
Svyatoslav Kucher
5 (4)
Mystic Arrow - уникальный авторский индикатор, отображающий сигналы в направлении основной тенденции, и против нее. Благодаря разнообразию настроек и фильтров индикатор можно настроить под свой стиль торговли. Mystic Arrow  подходит для любого таймфрейма, валютной пары. Сигналы индикатора не пропадают ни при каких условиях. Отличительной особенностью является возможность настроить сигналы индикатора отдельно для тенденции и против нее. Имеет в качестве отключаемого фильтра показания ценового кан
ENTRY AND EXIT ARROWS Indicator – Description The Entry and Exit Arrows indicator is a simple yet effective momentum-based tool designed to highlight potential buy and sell opportunities directly on the chart using visual arrows. It works by comparing two internal momentum measurements with different sensitivities. When both measurements align in the same direction, the indicator confirms a stronger directional bias and plots a signal. How It Works Buy Signal (Lime Arrow Below Candle): Appea
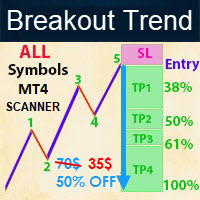
-  Real price is 70$ - 50% Discount (It is 35$ now) Please contact me by temporarily account for more info: https://www.mql5.com/en/users/temp_elif_kaya/ messages Contact me for instruction, any questions! - New Update - Lifetime update free - Non-repaint - I just sell my products in Elif Kaya Profile, any other websites are stolen old versions, So no any new updates or support. Introduction Breakout Trend Scanner indicator works based on the Elliott Wave in technical analysis describes price m
REMINDER: Early buyers hot price discount: Price subject to rise after first 20 copies. Starting price $65 and final price will be $1275. Secure your discounted copy Now! Smart Money Analyser Indicator User Manual 1. Introduction Welcome to the   Smart Money Analyser Indicator This powerful tool provides traders with comprehensive market analysis by combining various technical indicators to generate actionable trading signals. Designed to be user-friendly, this indicator helps traders of all
The trader uses the Trend for Neuro indicator to determine the market situation. This is a trending algorithm that is convenient to download, install and use. The algorithm with acceptable accuracy generates input signals and output levels. Strategy for trend trading, filtering and all the necessary functions built into one tool! By launching the indicator, the user will see only two types of arrows that can change color to blue during an uptrend, to red during a downtrend there is no uncertaint
Quantum Falcon Signal Free is a smart visual trading indicator for MetaTrader 4 designed for Forex and Gold traders. The indicator combines: • Trend analysis • RSI momentum confirmation • MACD momentum filtering • ATR volatility filtering • Higher timeframe confirmation • Smart exit signal detection Main Features: • Smart Buy and Sell signals • Exit Buy / Exit Sell alerts • Real-time dashboard on chart • Professional candle arrows • Multi-timeframe trend confirmation • ATR market volatility filt
FREE
TrendMorph — adaptive trend indicator with entry arrows What it is TrendMorph shows trend direction with a colored line, marks reversal points with Buy/Sell arrows, and gives every signal a confidence score together with Stop/Target levels. The indicator can adapt the sensitivity of its line to the current market state, so the same settings work in both quiet and volatile conditions. An information panel is displayed on the chart and all key values are available in buffers for Expert Advisors.
FREE
G2 Entry Signal MT4
Ida Bagus Putu Mahardika
G2 ENTRY SIGNAL by Ida Bagus Putu Mahardika STRATEGY DESCRIPTION G2 Entry Signal is a professional multi-strategy entry dashboard that combines top-down analysis with 3 proven trading strategies in one powerful indicator. Designed for traders who demand clarity, accuracy, and actionable signals, this tool filters market noise and delivers high-probability entry opportunities directly on your chart. KEY ADVANTAGES 1. 3 STRATEGIES IN ONE DASHBOARD Strategy 1 – London Session Breakout:   Capt
FREE
DoAid
Samuel Akinbowale
5 (1)
DoAid DoAid indicator is a simple channel indicator with an advance timeframe correlation board. DoAid indicator: can be used with any instrument provided by your broker and MetaTrader, be it Currency , Commodity ,Stock, or Cryptocurrencies. DoAid indicator   can be used for swing, scalping and day trading. DoAid indicator   is also a multi time-frame indicator {MTF}. DoAid indicator can be used with any timeframe. It does not repaint.It does not repaint. When To Buy if the market price is
Buyers of this product also purchase
Trend SniperX MT4
Sarvarbek Abduvoxobov
5 (5)
Trend Sniper X is a multi-timeframe trend-following indicator for MetaTrader 5 that helps traders identify trend direction and potential reversal points with clarity and precision. For MT5: https://www.mql5.com/en/market/product/181101 Price Information: The current price is promotional and is subject to change as upcoming updates and new features are released. Code2Profit Channel Master the Market with Multi-Timeframe Analysis! How to Maximize Your Win Rate with Trend Sniper X: Key Rules & Sess
Currency Strength Wizard is a very powerful indicator that provides you with all-in-one solution for successful trading. The indicator calculates the power of this or that forex pair using the data of all currencies on multiple time frames. This data is represented in a form of easy to use currency index and currency power lines which you can use to see the power of this or that currency. All you need is attach the indicator to the chart you want to trade and the indicator will show you real str
PRO Renko System
Oleg Rodin
5 (31)
PRO Renko System is a highly accurate trading system specially designed for trading RENKO charts. The ARROWS and Trend Indicators DO NOT REPAINT! The system effectively neutralizes so called market noise giving you access to accurate reversal signals. The indicator is very easy to use and has only one parameter responsible for signal generation. You can easily adapt the tool to any trading instrument of your choice and the size of the renko bar. I am always ready to provide extra support to help
SR Liquidity
Oleg Rodin
5 (2)
SR Liquidity is a trading indicator designed to reveal the hidden zones where market liquidity concentrates and price reacts most strongly. These special liquidity areas act as powerful support and resistance levels, giving you a clear map of where the market is most likely to reverse. Instead of drawing ordinary Support/Resistance lines, SR Liquidity analyzes real price behavior to detect the zones where buying and selling pressure accumulate. These are actually the pools of liquidity that driv
Scalper Vault
Oleg Rodin
5 (40)
Scalper Vault is a powerful, fully-equipped trading system designed for traders who want to achieve consistency in intraday trading . This high-precision indicator serves as a complete, standalone trading system that delivers institutional-grade analysis for both Forex and Binary Options traders. PLEASE CONTACT ME AFTER PURCHASE TO GET MY TRADING TIPS PLUS A GREAT BONUS! By eliminating the guesswork and complex manual analysis, Scalper Vault allows you to focus purely on execution using easy t
Smart Trend Trading System is a chart indicator for MetaTrader 4 that brings trend information, entry and exit signals, and price levels into one workspace. It combines 10+ trading tools into one system, including trend detection, reversal zones, smart cloud, trailing stop logic, support and resistance, candle coloring, alerts, and multi-timeframe analysis. The system is designed to help you trade different market conditions: Trending markets: Identify the main trend, detect pullbacks, follow mo
Quant Direction
Georgios Kalomoiropoulos
Quant Direction is a 3 dimensional market analysis tool. It provides a purely objective, algorithmic view of the market by calculating exact percentage-based biases across multiple dimensions simultaneously. Developed utilizing advanced AI modeling tools and subjected to thorough testing, this algorithm is engineered to read the market with unique precision. It can analyze any currency pair or financial instrument available on your platform.  Quant Direction is the ideal tool whether you are a S
Trend Lines PRO
Roman Podpora
5 (2)
TREND LINES PRO    helps understand where the market is truly changing direction. The indicator shows real trend reversals and points where major players re-enter. You see   BOS lines   Trend changes and key levels on higher timeframes — without complex settings or unnecessary noise. Signals don't repaint and remain on the chart after the bar closes. VERSION MT 5     -     Reveals its maximum potential when paired with the   RFI LEVELS PRO  indicator What the indicator shows: Real shifts   tren
AW Prime Oscillator
AW Trading Software Limited
5 (1)
A combination of two oscillators. The first one displays the entry points, the second shows the current trend . The indicator can display oscillator signals by arrows in two modes, all fast oscillator signals or signals only in the direction of the current trend. It has a multi-timeframe panel and three types of signal notifications. Benefits: Suitable for day and scalping trading Trend filtering Simple and sensitive setup Multi-timeframe panel Suitable for integration into an advisor. Works on
Atomic Analyst
Issam Kassas
5 (14)
Atomic Analyst — MetaTrader 4 For product questions, setup guidance, or technical support, message me directly here on MQL5. The indicator turns complex market calculations into simple visual signals, color-coded candles, trend readings, stop-loss levels, and multiple take-profit zones that traders can understand quickly and use in real market conditions. Main Trading Uses: Scalping and intraday trading: Designed for fast decision-making, clear arrows, alerts, candle colors, and structured entry
M1 Sniper
Oleg Rodin
4.97 (30)
M1 SNIPER  is an easy to use trading indicator system. It is an arrow indicator which is designed for M1 time frame. The indicator can be used as a standalone system for scalping on M1 time frame and it can be used as a part of your existing trading system. Though this trading system was designed specifically for short-term trading, it still can be helpful for all traders. This trading system can be used with any forex pair and time frame, though lower time frames are recommended from M1 up to M
SIO Oscillator: Self-Optimizing Semivariance Imbalance Oscillator Buy the indicator and get the Expert Advisor based on it for FREE. Most oscillators treat all price movement the same. SIO separates upside and downside market pressure and measures the imbalance between them, showing which side is really in control: buyers or sellers. When the imbalance reaches an extreme, SIO prints a clear signal with entry, Stop Loss and Take Profit levels. What makes SIO different is that it doesn’t rely on f
Hidden Cycles
Lev Vladimirovic Marushkin
5 (1)
The Only 100% Universal Tool! Stop trading against nature! This is your chance to secure the only indicator rooted in the absolute laws that govern the entire universe. Most tools guess—this one reveals the truth. Buy another toy or buy the truth. Your choice... Based on Universal Laws — NOT Some Guy’s Algorithm: Let the market adjust to the Hidden Cycles Geometry — not the other way around. Most indicators are based on a man-made formula. They often lag, fail over time, or need constant re-o
Neo Wave PRO
Nikolay Raykov
5 (1)
Price & Time Market Structure Indicator A professional market structure tool that analyzes waves through both price and time — not price alone. Main Description NeoWave PRO is a professional market structure indicator for MetaTrader 4 designed for traders who want to move beyond traditional one-dimensional wave tools such as ZigZag, swing indicators, and basic high/low systems. Most wave indicators analyze only one thing: Price. But a real market wave is not only a price movement. A true wave de
PZ Turning Points MT4
PZ TRADING SLU
1 (1)
Identify key turning points with reliable fractal analysis This indicator examines the price structure of fractals of different periods to determine possible reversal points in the market, providing timing to positional traders that already have a fundamental or technical valuation model. Unlike its younger brother, Reversal Fractals , this indicator won't miss reversals because of the period selected, and will find reversal fractals on a zig-zag fashion, ignoring those reversals which do not
CRT Multi-Timeframe Market Structure & Liquidity Sweep Indicator Non-Repainting | Multi-Asset | MT5 Version Available MT5 Version:   https://www.mql5.com/en/market/product/162075 Full User Guide — explains what each feature does and why:   https://www.mql5.com/en/blogs/post/767525 Quick Start User Guide  — explains how to configure and in what order:  https://www.mql5.com/en/blogs/post/767540 Indicator Overview CRT Ghost Candle HTF Fractal is a complete institutional-grade market structure too
Gann Time Clusters
Martin Eshleman
2.5 (2)
Gann Time Clusters Indicator This indicator is based on W. D. Gann's Square of 9 method for the time axis. It uses past market reversal points and applies the mathematical formula for Gann's Square of 9 and then makes projections into the future. A date/time where future projections line up is called a 'time cluster'. These time clusters are drawn as vertical lines on the right side of the chart where the market has not advanced to yet. A time cluster will result in a market reversal point (ex.
Non repaint MT4
Yan Zhen Du
5 (1)
This is a professional chart indicator designed for traders focused on stability and clear price action. It helps filter market noise and provides clear visual entry and exit zones for your trading decisions. Core Features: Strictly Non-Repainting: The system is built with strict non-repaint logic. What you see on the chart is the true historical performance. Confirmed Signals: Signals are triggered and confirmed only after the candle closes . Once a trading arrow appears on a closed candle, it
Forex Breath System is a trend based trading system which can be used with any market. You can use this system with currencies, metals, commodities, indices, crypto and even stocks. It can also be used with any time frame. The system is universal. It shows trend and provides arrow signals with the trend. The indicator can also provide you with a special type of alerts when the signals appear in the direction of the trend which makes trend trading an easy task. The indicator is very easy to use a
Advanced Supply Demand
Bernhard Schweigert
4.91 (302)
Trading Special – 30% OFF Best Solution for any Newbie or Expert Trader! This indicator is a unique, high quality and affordable trading tool because we have incorporated a number of proprietary features and a new formula. With this update, you will be able to show double timeframe zones. You will not only be able to show a higher TF but to show both, the chart TF, PLUS the higher TF: SHOWING NESTED ZONES. All Supply Demand traders will love it. :) Important Information Revealed Maximize the pot
Trading Special – 40% OFF Best Solution for any Newbie or Expert Trader! This indicator is a unique, high quality and affordable trading tool because we have incorporated a number of proprietary features and a secret formula. With only ONE chart it gives Alerts for all 28 currency pairs. Imagine how your trading will improve because you are able to pinpoint the exact trigger point of a new trend or scalping opportunity! Built on new underlying algorithms it makes it even easier to identify and c
Super Signal – Skyblade Edition Professional No-Repaint / No-Lag Trend Signal System with Exceptional Win Rate | For MT4 / MT5 It works best on lower timeframes, such as 1-minute, 5-minute, and 15-minute charts. Core Features: Super Signal – Skyblade Edition is a smart signal system designed specifically for trend trading. It applies a multi-layered confirmation mechanism to detect only strong, directional moves supported by real momentum. This system does not attempt to predict tops or bottoms
Liquidity Scalper System: a liquidity-based trading system in indicator form. Most indicators only show an arrow, and the trader then has to decide where the stop goes, where the target is and whether the signal can be trusted at all. Liquidity Scalper System covers the full trade cycle: it finds liquidity pools, gives a signal when they are broken, immediately calculates Entry, Stop Loss and three targets, and shows statistics and out-of-sample test results on the panel. The system picks its o
Market Reversal Alerts
Lee Samson
4.19 (114)
Profit from market structure changes as price reverses and pulls back. The Market Reversal Alerts indicator identifies when a trend or extended price move is approaching exhaustion, alerts you the moment market structure shifts, and confirms the entry when price re-tests the reversal zone, so you trade defined areas instead of guesses. How it works As price forms new highs or lows near potential exhaustion points, the indicator identifies the breakout and momentum, then draws a rectangle on the
Gann Made Easy
Oleg Rodin
4.84 (174)
Gann Made Easy is a professional and easy to use Forex trading system which is based on the best principles of trading using the theory of W.D. Gann. The indicator provides accurate BUY and SELL signals including Stop Loss and Take Profit levels. You can trade even on the go using PUSH notifications. PLEASE CONTACT ME AFTER PURCHASE TO GET TRADING  INSTRUCTIONS   AND GREAT EXTRA INDICATORS  FOR FREE! Probably you already heard about the Gann trading methods before. Usually the Gann theory is a
Neuro Poseidon MT4
Daria Rezueva
4.74 (46)
Neuro Poseidon is a new indicator by Daria Rezueva. It combines precise trading signals with adaptive TP/SL levels - creating best possible trades as a result! Message me and get  Neuro Poseidon Assistant  as a gift to automize your trading process! What makes it stand out? 1. Proven profitability on all assets and timeframes 2. Only confirmed BUY and SELL signals present on the chart 3. Adaptive TP & SL levels generated by the software for each trade 4. Easy to understand - suitable for all
Gold Channel is a volatility-based indicator, developed with a specific timing algorithm for the XAUUSD pair, which consists of finding possible corrections in the market. This indicator shows two outer lines, an inner line (retracement line) and an arrow sign, where the theory of the channel is to help identify overbought and oversold conditions in the market. The market price will generally fall between the boundaries of the channel. If prices touch or move outside the channel it is a tradi
Trading Special – 30% OFF Best Solution for any Newbie or Expert Trader! This dashboard software is working on 28 currency pairs plus one. It is based on 2 of our main indicators (Advanced Currency Strength 28 and Advanced Currency Impulse). It gives a great overview of the entire Forex market plus Gold or 1 indices. It shows Advanced Currency Strength values, currency speed of movement and signals for 28 Forex pairs in all (9) timeframes. Imagine how your trading will improve when you can watch
Italo Volume Indicator
Italo Santana Gomes
4.92 (79)
BUY INDICATOR AND GET EA FOR FREE AS A BONUS + SOME OTHER GIFTS! ITALO VOLUME INDICATOR  is the best volume indicator ever created, and why is that? The Indicator works on all time-frames and assets, indicator built after 7 years of experience on forex and many other markets. You know many volume indicators around the internet are not complete, does not help, and it's difficult to trade, but the Italo Volume Indicator is different , the Italo Volume Indicator shows the wave volume, when market
TDI Multi Timeframe Scanner: This Dashboard indicator uses the TDI (Trader's Dynamic Index) Indicator to find best trades. Read detailed How to Use Guide: https://www.mql5.com/en/blogs/post/758252 Extra indicators also available in above post. Checks for: - SharkFin Pattern Free indicator for SharkFin: https://www.mql5.com/en/market/product/42405/ - TDI Trend: Strong/Weak Trend Up/Down - TDI Signal: Strong/Medium/Weak Signal for Buy/Sell - Consolidation - Overbought/Oversold - Volatility Ban
More from author
A volatility squeeze is when the Bollinger Bands contract inside the Keltner Channel. Price is coiling, and the release that follows is often a strong move. Finding squeezes by hand across dozens of charts and timeframes is slow. CalmFx Squeeze Ranker scans your symbol list, or your whole Market Watch filtered by asset class, from a single chart and scores every market from 0 to 100, with the tightest coils at the top. How the score works Compression: how deep the Bollinger Bands sit inside the
A quiet session on a symbol that normally moves a lot has to resolve somewhere. CalmFx Session Range Ranker measures how tight a reference session's range was (Tokyo by default) against each symbol's own average daily range. It ranks your whole watchlist from 0 to 100 and shows the break levels next to the score, so you can see which markets are coiled ahead of the next session and where they would break. How the score works Compression: the session range as a percentage of the symbol's average
Markets that stretch too far from their mean tend to snap back. CalmFx Snap Ranker scans your symbol list, or your whole Market Watch, from a single chart and scores how stretched each market is from 0 to 100. The strongest snap-back candidates appear at the top, each with its expected direction. How the score works RSI: how far RSI is past its overbought or oversold level. Band position: how far price sits across the Bollinger Bands. 100 means at a band, and higher means it has closed outside.

Markets that move strongly and cleanly in one direction tend to keep going. CalmFx Surge Ranker scans your symbol list, or your whole Market Watch, from a single chart and scores the strength and cleanliness of each market's current move from 0 to 100. The strongest, cleanest trends appear at the top, each with its direction. How the score works Momentum: the rate of change measured in ATR units, so a currency pair, an index and gold can be compared fairly. Trend quality: how straight the move i
See the trend on nine timeframes at once. CalmFx MultiTF Trend Dashboard reads M1, M5, M15, M30, H1, H4, D1, W1 and MN on the chart symbol and shows each one as BULL, BEAR or MIX, with how long that reading has held and an overall bias across the board. What it shows One row per timeframe, from a fast moving average against a slow one (8 and 200 by default). A timer on each row showing how long the current reading has held. An overall bias and an agreement meter showing how aligned the nine time
The four forex sessions at a glance. CalmFx Sessions Clock shows which of Sydney, Tokyo, London and New York are open, a live countdown to the next open or close, and how far each open session has run. What it shows Open or closed for each session, with its hours in GMT. A live countdown to the next open or close. Progress through each open session. The server time and GMT in the title bar. Daylight saving handled properly London, New York and Sydney change their clocks on different dates, and S
FREE
Support and resistance zones drawn from where price has actually turned. CalmFx SR Zones finds swing highs and lows, merges the ones that sit close together into zones, and counts how many times each zone has been touched. Only zones with enough touches are drawn. How the zones are built Swing points are found with a strength you choose (bars on each side). Swing points within a fraction of ATR are merged into one zone, so the zone width suits the market: the same inputs work on a currency pair,
Three moving averages drawn as two coloured clouds, so trend, pullback and turn are visible at a glance. CalmFx Trend Ribbon shades between the fast and mid averages, and between the mid and slow averages, and each cloud changes colour with its direction. What it draws A fast-to-mid cloud for the quick read and a mid-to-slow cloud for the structure. The three moving average lines on top (8, 38 and 200 by default). Periods, method and applied price are inputs. An optional Bollinger envelope drawn
CalmFx Trading Panel is an on-chart panel for manual trading in MetaTrader 5. It places market and pending orders in one click, manages open positions with a trailing stop and a hedge button, and shows sessions, multi-timeframe trend, RSI alerts and the economic calendar on the same chart. The panel works on any symbol. Distance settings such as take profit, trailing stop and pending order offsets are scaled automatically to each market's average daily range, so the same settings behave consiste
The Daily Dipper Skipper is an on-chart dashboard that watches a list of symbols on several timeframes at once and shows where RSI is in, or approaching, an oversold ("dip") or overbought ("rip") zone. It is a monitoring and alerting tool. It does not open, modify or close trades. It reads RSI on D1, H12, H8, H4 and H1. Each symbol is given a class from A to E that sets how many of those timeframes it is watched on, so your most-traded instruments can be watched on all five while quieter ones st
A volatility squeeze is when the Bollinger Bands contract inside the Keltner Channel. Price is coiling, and the release that follows is often a strong move. Finding squeezes by hand across dozens of charts and timeframes is slow. CalmFx Squeeze Ranker scans your symbol list, or your whole Market Watch filtered by asset class, from a single chart and scores every market from 0 to 100, with the tightest coils at the top. How the score works Compression: how deep the Bollinger Bands sit inside the
A quiet session on a symbol that normally moves a lot has to resolve somewhere. CalmFx Session Range Ranker measures how tight a reference session's range was (Tokyo by default) against each symbol's own average daily range. It ranks your whole watchlist from 0 to 100 and shows the break levels next to the score, so you can see which markets are coiled ahead of the next session and where they would break. How the score works Compression: the session range as a percentage of the symbol's average
Markets that stretch too far from their mean tend to snap back. CalmFx Snap Ranker scans your symbol list, or your whole Market Watch, from a single chart and scores how stretched each market is from 0 to 100. The strongest snap-back candidates appear at the top, each with its expected direction. How the score works RSI: how far RSI is past its overbought or oversold level. Band position: how far price sits across the Bollinger Bands. 100 means at a band, and higher means it has closed outside.
Markets that move strongly and cleanly in one direction tend to keep going. CalmFx Surge Ranker scans your symbol list, or your whole Market Watch, from a single chart and scores the strength and cleanliness of each market's current move from 0 to 100. The strongest, cleanest trends appear at the top, each with its direction. How the score works Momentum: the rate of change measured in ATR units, so a currency pair, an index and gold can be compared fairly. Trend quality: how straight the move i
See the trend on ten timeframes at once. CalmFx MultiTF Trend Dashboard reads M1, M5, M15, M30, H1, H2, H4, H8, H12 and D1 on the chart symbol and shows each one as BULL, BEAR or MIX, with how long that reading has held and an overall bias across the board. What it shows One row per timeframe, from a fast moving average against a slow one (8 and 200 by default). A timer on each row showing how long the current reading has held. An overall bias and an agreement meter showing how aligned the ten t
The four forex sessions at a glance. CalmFx Sessions Clock shows which of Sydney, Tokyo, London and New York are open, a live countdown to the next open or close, and how far each open session has run. What it shows Open or closed for each session, with its hours in GMT. A live countdown to the next open or close. Progress through each open session. The server time and GMT in the title bar. Daylight saving handled properly London, New York and Sydney change their clocks on different dates, and S
FREE
Support and resistance zones drawn from where price has actually turned. CalmFx SR Zones finds swing highs and lows, merges the ones that sit close together into zones, and counts how many times each zone has been touched. Only zones with enough touches are drawn. How the zones are built Swing points are found with a strength you choose (bars on each side). Swing points within a fraction of ATR are merged into one zone, so the zone width suits the market: the same inputs work on a currency pair,
Three moving averages drawn as two shaded clouds, so trend, pullback and turn are visible at a glance. CalmFx Trend Ribbon shades between the fast and mid averages, and between the mid and slow averages, and each cloud changes colour with its direction. What it draws A fast-to-mid cloud for the quick read and a mid-to-slow cloud for the structure. The three moving average lines on top (8, 38 and 200 by default). Periods, method and applied price are inputs. An optional Bollinger envelope drawn a
Filter:
No reviews
Reply to review