Daily Dipper Skipper RSI Scanner MT4

  • Indicadores
  • Callum Gunn
    Callum Gunn
    CalmFx - calm, clear trading tools for MetaTrader 5.
    I build and support the CalmFx toolkit: on-chart panels, multi-symbol scanners and indicators designed to work side by side on the same charts, on any symbol and any screen size, from a laptop to a 40-inch TV.
    CalmFx on the Market:
  • Versão: 4.20
  • Ativações: 10

The Daily Dipper Skipper is an on-chart dashboard that watches a list of symbols on several timeframes at once and shows where RSI is in, or approaching, an oversold ("dip") or overbought ("rip") zone. It is a monitoring and alerting tool. It does not open, modify or close trades.

It reads RSI on D1, H4, H1, M30 and M15. Each symbol is given a class from A to E that sets how many of those timeframes it is watched on, so your most-traded instruments can be watched on all five while quieter ones stay on the Daily. Up to three RSI levels can be used (by default 30/70, with optional 25/75 and 20/80).

What the panel shows:

  • The symbols in the dip zone and in the rip zone right now, with the timeframe for each.
  • "Next up": the symbol closest to entering a zone.
  • A watchlist of symbols approaching a zone, sorted by distance, each with a proximity bar and a per-timeframe RSI heat strip.
  • Open positions on the account with profit, age and a progress bar toward take profit (read-only).
  • Optional RSI divergence counts.

Signal rules (your choice):

  • In zone: RSI at or beyond the level.
  • Cross: RSI turning back out of the zone.
  • Divergence: price makes a new low/high that RSI does not confirm.
  • Optional higher-timeframe moving average filter.

Alerts:

  • Pop-up and sound when a new signal appears, and optionally when a symbol gets close to a zone.
  • Optional push notifications and email through the standard MetaTrader settings. Alerts are grouped and rate-limited so a busy market doesn't flood your phone.
  • Optional CSV log of every signal.

Usability:

  • Drag the panel by its header; drag the bottom-right corner to resize. DPI-aware.
  • Remembers its position and size. A collapse button shrinks it to one summary line.
  • A "?" button shows the RSI levels in use and how many symbols each timeframe covers.

Setup:

  • Works on any MetaTrader 4 broker. Use your own symbol list or scan Market Watch (up to 200 symbols). Broker symbol suffixes are matched automatically.
  • On first load it downloads any missing price history in the background and shows a loading count until every symbol is ready.
  • In the Strategy Tester it watches the tested symbol only.
  • Run it on a VPS if you want alerts around the clock.

MetaTrader 4 notes:

  • MetaTrader 4 has no H12 or H8 chart periods, so this version watches D1, H4, H1, M30 and M15.
  • Alerts wait a short warm-up after loading while MetaTrader 4 finishes downloading history.

What it does not do:

  • It does not trade and makes no prediction about future prices. RSI readings are information for your own analysis, not buy or sell signals, and nothing here is financial advice.

Part of the CalmFx toolkit

  • The MetaTrader 5 version is also available, along with the CalmFx rankers and Trading Panel.
  • All CalmFx tools, for MetaTrader 4 and MetaTrader 5, are on the CalmFx seller page.
Produtos recomendados
A useful scanner/dashboard that shows the RSI values for multiple symbols and time-frames. It can be easily hidden/displayed with a simple click on the scanner man top left of the dashboard. You can input upper and lower RSI values and the colours can be set to show when above/below these values. The default values are 70 and 30. There are also input colours for when the RSI is above or below 50 (but not exceeding the upper/lower levels Symbols and time-frames are input separated by commas.
Impulse fractals indicator - is counter-trend oriented complex market fractal pattern.  Market creates bull/bear impulse, trend starts, fractals on impulsed wave are an agressive pullback signals. Buy arrow is plotted when market is bearish and it's impulse showed up-side fractal, and sell arrow is plotted when market is bullish and it's impulse showed dn-side fractal. Main indicator's adjustable inputs : impulsePeriod - main period of impulse histogram  filterPeriod  - smoothes impulse accordi
Este indicador é um indicador para análise automática de ondas que é perfeito para negociações práticas! Caso... Nota:   Não estou acostumado a usar nomes ocidentais para classificação de ondas. Devido à influência da convenção de nomenclatura de Tang Lun (Tang Zhong Shuo Zen), nomeei a onda básica como   uma caneta   e a banda de onda secundária como   um segmento   . ao mesmo tempo, o segmento tem a direção da tendência.   O segmento de tendência principal   é nomeado (esse método de nomencl
Currency Strength Oscillator MT4
Narayanan Mohanan Mohanan Krishnan
Oscilador de força monetária para MetaTrader 4 Um indicador de força relativa da moeda que traça a história das oito principais empresas. Este oscilador de força monetária representa a força relativa das oito principais moedas como um histórico, decomposto a partir do 28 pares principais. Embora um medidor de força monetária padrão lhe diga onde as coisas estão agora, isso mostra como elas chegaram lá – qual moeda tem se fortalecido, qual foi revertida e onde a classificação mudou de mãos. Todas
O indicador R Scalper Arrows fornece setas de sinal de compra e venda fáceis de ler para qualquer par de moedas. É adequado para prever tendências de curto prazo: Uma seta para cima indica que o par está em tendência de alta de curto prazo. Uma seta para baixo indica que o par está em uma tendência de baixa de curto prazo. Para negociações longas, coloque o stop loss abaixo do pip. Para negociações curtas, coloque um stop loss acima do pip. acompanhar Você pode usar este indicador com a tend
Indicator for binary options arrow is easy to use and does not require configuration works on all currency pairs, cryptocurrencies buy signal blue up arrow sell signal red down arrow tips do not trade during news and 15-30 minutes before their release, as the market is too volatile and there is a lot of noise it is worth entering trades one or two candles from the current period (recommended for 1 candle) timeframe up to m 15 recommended money management fixed lot or fixed percentage of the depo
ArchIntel Pivot Point
Raphael Adetunji Olaiyapo
This tool draws all the pivot point lines on chart. It is important to remind/tell you that there are 5 pivot method according to BabyPips website. All these methods have their unique mathematical formula. 1. Floor Method. 2. Woodie Method. 3. Camarilla Method. 4. DeMark Method. 5. Fibonacci Method. What makes this pivot tool unique is that you can click the "Fibonacci" button to select the pivot method you want. You can click the "Monthly" button to select the Period you want to use for the piv
Introduction to Fractal Pattern Scanner Fractal Indicator refers to the technical indicator that makes use of the fractal geometry found in the financial market. Fractal Pattern Scanner is the advanced Fractal Indicator that brings the latest trading technology after the extensive research and development work in the fractal geometry in the financial market. The most important feature in Fractal Pattern Scanner is the ability to measure the turning point probability as well as the trend probabi
This is  a dashboard indicator that displays the Average Level of each selected currency pairs that filters and gives us a signal for overbought (>=90%) or if price at extreme peak above 90, and/or oversold (<=10%) or if price at extreme peak below 10. The calculation is using Relative Strength Index default periods (2 & 9) applied to three different higher time frames H4,D1,&W1. This won't change or altered even if you change symbol or switch to lower time frames or even in monthly and year
Godfather
Ivan Simonika
The intelligent algorithm of the Godfather indicator accurately determines the trend, filters out market noise and generates entry and exit levels. The indicator will help in finding entry points when analyzing the price chart. The program first receives a "snapshot" of the graph, then analyzes it. The results are reported to the trader in the form of signals. The main purpose of this indicator is to determine the moments of entries and exits from transactions, so the indicator displays only th
Break and Retest Hunter MT4 is a powerful MetaTrader 5 indicator designed to automatically identify support and resistance levels, breakout structures, and potential retest opportunities in real time. Bonus Indicator: After purchasing Break and Retest Hunter , contact me to receive Trade Indicator Assistant EA completely free as a bonus utility. $65 for the next 10 copies . Next price is $120.  Combining adaptive market analysis, clear BUY/SELL signals, Fibonacci-based profit targets, and a pre
This indicator is based on the classical indicators: RSI (Relative Strength Index) and PSAR (Parabolic Stop and Reverse) and will be helpful for those who love and know how to use not a visual but digital representation of the indicators. The indicator shows values from 9 currency pairs. You will be able to change the main input parameters for RSI: OverboughtLevel = 70; OversoldLevel = 30; Period = 14; Price = PRICE_CLOSE; and PSAR: step = 0.02; maximum = 0.2; Also you may change Symb1 - Symb9 t
Manual Completo: Edição Completa Manual Integrado Aura HHLL Platinum V2.00 Este programa é uma ferramenta que ajuda os traders a determinar "em que estado se encontra o mercado agora?" mais rapidamente no meio dos movimentos complexos dos gráficos. É o resultado da análise técnica, combinando a precisão da ação do preço com a intuição da negociação em gamas de preços. SECÇÃO 01 Indicador Componentes Principais Elementos Fornece a capacidade de ler a estrutura do mercado. 1. Os 3 Eixos Princip
Note : The slow loading of the indicator issue has been addressed . This new version loads fast and does not slow the platform. Version 1.3 : We have updated the indicator to include an historical bar scanning option . So instead of scanning all bars in the history (which can make the indicator slow sometimes ) , you can select the maximum number of bars it can scan which can increase the performance and make the indicator faster. This indicator scans the 1-3 Trendline pattern . The indicator i
"Dynamic Scalping Oscillator" - um indicador avançado e personalizado para Crypto_Forex - uma ferramenta de negociação eficiente para MT4! - Nova geração de osciladores - veja as imagens para saber como usá-lo. - O Dynamic Scalping Oscillator possui zonas adaptáveis de sobrevenda/sobrecompra. - O oscilador é uma ferramenta auxiliar para encontrar pontos de entrada exatos em áreas dinâmicas de sobrevenda/sobrecompra. - Valores de sobrevenda: abaixo da linha verde, valores de sobrecompra: acima d
RelicusRoad Dynamic Circles é um indicador de máximos e mínimos de oscilação para MetaTrader 4 e MetaTrader 5 que marca pontos de viragem com círculos em três comprimentos de análise ao mesmo tempo: 9, 60 e 156 velas. Viragens pequenas e viragens grandes ficam no mesmo gráfico mas têm aspetos diferentes. Um ponto de amplitude curta mostra uma oscilação menor, enquanto os anéis maiores das amplitudes média e longa só aparecem onde o preço fez o extremo de uma janela muito mais longa. Cada círculo
CCZ is an objective support/resistance zones built from consecutive candle-overlap through same price range, on any base timeframe   "From the maker of Risk Sentinel — risk-first position sizing that keeps your risk fixed as you drag the stop:   https://www.mql5.com/en/market/product/185979 " ================================================================================================================================================= The Main Concept: Classic support and resistance measures 
FREE
SuperTrend Alerts
Libertas LLC
3 (4)
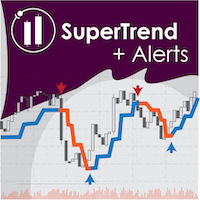
SuperTrend Alerts adds alerts to the widely popular SuperTrend indicator. As the name suggests, SuperTrend is a trending indicator which works best in trendy (not choppy) markets. SuperTrend is extremely popular for intraday and daily trading, and can be used on any timeframe. Place a call when the price closes above the SuperTrend line, and place a put when the price closes below the SuperTrend line. These crossovers are highlighted by non-repainting up/down arrows. Alerts Email, message and s
Daily Trend Confluence Scanner Daily Trend Confluence Scanner is a systematic multi-indicator trend-following tool designed to spot high-probability trade setups while filtering out market noise.   By evaluating market conditions strictly on completed daily candle closes (shift = 1), this indicator provides reliable, non-repainting signals based on four layers of technical confirmation.   Key Features 100% Non-Repainting: All calculations freeze upon daily candle close (shift = 1), eliminating
The Trend Professor is a moving average based indicator designed for the purpose of helping the community of traders to analyse the price trend. The indicator will be displayed in the main chart as it is indicated on the screenshot section. How it works The indicator has lines of moving averages and colored histograms to depict the direction of the trend. There will be a fast signal line colored blue/yellow/red at some points. The red/yellow colored lines stands for bearish trend/signal while th
Signal Arrows is an indicator that generates trade arrows. It generates trade arrows with its own algorithm. These arrows give buying and selling signals.  Can be used in all pairs. Sends a signal to the user with the alert feature. The indicator certainly does not repaint. Trade rules Enter the signal when the buy signal arrives. In order to exit from the transaction, an opposite signal must be received. It is absolutely necessary to close the operation when an opposite signal is received. The
Mystic Arrow
Svyatoslav Kucher
5 (4)
Mystic Arrow - уникальный авторский индикатор, отображающий сигналы в направлении основной тенденции, и против нее. Благодаря разнообразию настроек и фильтров индикатор можно настроить под свой стиль торговли. Mystic Arrow  подходит для любого таймфрейма, валютной пары. Сигналы индикатора не пропадают ни при каких условиях. Отличительной особенностью является возможность настроить сигналы индикатора отдельно для тенденции и против нее. Имеет в качестве отключаемого фильтра показания ценового кан
ENTRY AND EXIT ARROWS Indicator – Description The Entry and Exit Arrows indicator is a simple yet effective momentum-based tool designed to highlight potential buy and sell opportunities directly on the chart using visual arrows. It works by comparing two internal momentum measurements with different sensitivities. When both measurements align in the same direction, the indicator confirms a stronger directional bias and plots a signal. How It Works Buy Signal (Lime Arrow Below Candle): Appea
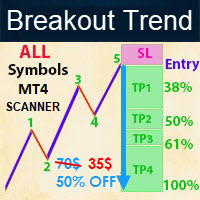
-  Real price is 70$ - 50% Discount (It is 35$ now) Please contact me by temporarily account for more info: https://www.mql5.com/en/users/temp_elif_kaya/ messages Contact me for instruction, any questions! - New Update - Lifetime update free - Non-repaint - I just sell my products in Elif Kaya Profile, any other websites are stolen old versions, So no any new updates or support. Introduction Breakout Trend Scanner indicator works based on the Elliott Wave in technical analysis describes price m
REMINDER: Early buyers hot price discount: Price subject to rise after first 20 copies. Starting price $65 and final price will be $1275. Secure your discounted copy Now! Smart Money Analyser Indicator User Manual 1. Introduction Welcome to the   Smart Money Analyser Indicator This powerful tool provides traders with comprehensive market analysis by combining various technical indicators to generate actionable trading signals. Designed to be user-friendly, this indicator helps traders of all
The trader uses the Trend for Neuro indicator to determine the market situation. This is a trending algorithm that is convenient to download, install and use. The algorithm with acceptable accuracy generates input signals and output levels. Strategy for trend trading, filtering and all the necessary functions built into one tool! By launching the indicator, the user will see only two types of arrows that can change color to blue during an uptrend, to red during a downtrend there is no uncertaint
Quantum Falcon Signal Free is a smart visual trading indicator for MetaTrader 4 designed for Forex and Gold traders. The indicator combines: • Trend analysis • RSI momentum confirmation • MACD momentum filtering • ATR volatility filtering • Higher timeframe confirmation • Smart exit signal detection Main Features: • Smart Buy and Sell signals • Exit Buy / Exit Sell alerts • Real-time dashboard on chart • Professional candle arrows • Multi-timeframe trend confirmation • ATR market volatility filt
FREE
TrendMorph — indicador de tendência adaptativo com setas de entrada O que é O TrendMorph mostra a direção da tendência com uma linha colorida, marca os pontos de reversão com setas Buy/Sell e fornece para cada sinal uma pontuação de confiança junto com níveis de Stop/Target. O indicador pode adaptar a sensibilidade da linha ao estado atual do mercado, de modo que as mesmas configurações funcionam tanto em mercados calmos quanto voláteis. Um painel informativo é exibido no gráfico e todos os val
FREE
G2 Entry Signal MT4
Ida Bagus Putu Mahardika
G2 ENTRY SIGNAL by Ida Bagus Putu Mahardika STRATEGY DESCRIPTION G2 Entry Signal is a professional multi-strategy entry dashboard that combines top-down analysis with 3 proven trading strategies in one powerful indicator. Designed for traders who demand clarity, accuracy, and actionable signals, this tool filters market noise and delivers high-probability entry opportunities directly on your chart. KEY ADVANTAGES 1. 3 STRATEGIES IN ONE DASHBOARD Strategy 1 – London Session Breakout:   Capt
FREE
DoAid
Samuel Akinbowale
5 (1)
DoAid DoAid indicator is a simple channel indicator with an advance timeframe correlation board. DoAid indicator: can be used with any instrument provided by your broker and MetaTrader, be it Currency , Commodity ,Stock, or Cryptocurrencies. DoAid indicator   can be used for swing, scalping and day trading. DoAid indicator   is also a multi time-frame indicator {MTF}. DoAid indicator can be used with any timeframe. It does not repaint.It does not repaint. When To Buy if the market price is
Os compradores deste produto também adquirem
Trend SniperX MT4
Sarvarbek Abduvoxobov
5 (5)
Trend Sniper X é um indicador de tendência multitemporal para MetaTrader 5 que ajuda os traders a identificar a direção da tendência e potenciais pontos de reversão com clareza e precisão. Para MT5: https://www.mql5.com/en/market/product/181101 Informação de preço: O preço atual é promocional e está sujeito a alterações à medida que novas atualizações e recursos forem lançados. Canal Code2Profit Domine o Mercado com Análise Multitemporal! Como Maximizar sua Taxa de Acerto com o Trend Sniper X: R
Currency Strength Wizard é um indicador muito poderoso que fornece uma solução completa para uma negociação bem-sucedida. O indicador calcula o poder deste ou daquele par forex usando os dados de todas as moedas em vários intervalos de tempo. Esses dados são representados em uma forma de índice de moeda fácil de usar e linhas de energia de moeda que você pode usar para ver o poder desta ou daquela moeda. Tudo o que você precisa é anexar o indicador ao gráfico que deseja negociar e o indicador mo
O sistema PRO Renko é um sistema de negociação altamente preciso especialmente concebido para a negociação de gráficos RENKO. Trata-se de um sistema universal que pode ser aplicado a vários instrumentos de negociação. O sistema neutraliza eficazmente o chamado ruído de mercado, dando-lhe acesso a sinais de inversão precisos. O indicador é muito fácil de usar e tem apenas um parâmetro responsável pela geração de sinal. Você pode facilmente adaptar a ferramenta a qualquer instrumento de negocia
SR Liquidity
Oleg Rodin
5 (2)
O SR Liquidity é um indicador de trading projetado para revelar as zonas ocultas onde a liquidez do mercado se concentra e o preço reage com maior intensidade. Essas áreas específicas de liquidez funcionam como níveis poderosos de suporte e resistência, oferecendo um mapa claro de onde é mais provável que o mercado reverta. Em vez de traçar linhas comuns de Suporte e Resistência, o SR Liquidity analisa o comportamento real dos preços para detectar as zonas onde se acumulam pressões de compra e v
Scalper Vault
Oleg Rodin
5 (40)
O Scalper Vault é um sistema de negociação poderoso e completo, projetado para traders que buscam consistência em operações intraday. Este indicador de alta precisão funciona como um sistema de negociação autônomo, oferecendo análises de nível institucional tanto para o mercado Forex quanto para Opções Binárias. ENTRE EM CONTATO COMIGO APÓS A COMPRA PARA RECEBER DICAS DE NEGOCIAÇÃO E UM BÔNUS EXCLUSIVO! Ao eliminar suposições e análises manuais complexas, o Scalper Vault permite que você foque
Smart Trend Trading System é um indicador para MetaTrader 4 que reúne informações de tendência, sinais de entrada e saída e níveis de preço em um único gráfico. Ele combina mais de 10 ferramentas de trading em um único sistema, incluindo detecção de tendência, zonas de reversão, Smart Cloud, lógica de trailing stop, suporte e resistência, coloração de candles, alertas e análise multi-timeframe. O sistema foi desenvolvido para ajudar você a operar diferentes condições de mercado: Mercados em tend
Quant Direction
Georgios Kalomoiropoulos
Quant Direction é uma ferramenta de análise de mercado tridimensional. Ela oferece uma análise de mercado totalmente objetiva, baseada em algoritmos, que calcula simultaneamente desvios percentuais precisos em diversos parâmetros. Desenvolvido com ferramentas avançadas de modelagem com inteligência artificial e rigorosamente testado, o algoritmo foi projetado para interpretar o mercado com precisão sem precedentes. Você pode analisar qualquer par de moedas ou instrumento financeiro em sua plataf
Trend Lines PRO
Roman Podpora
5 (2)
LINHAS DE TENDÊNCIA PRO       Ajuda a entender onde o mercado está realmente mudando de direção. O indicador mostra inversões de tendência reais e pontos onde os principais participantes retornam ao mercado. Você vê     Linhas BOS     Análise de tendências e níveis-chave em prazos maiores — sem configurações complexas ou ruídos desnecessários. Os sinais não são repintados e permanecem no gráfico após o fechamento da barra. VERSÃO MT 5      -      Revela seu potencial máximo quando emparelhada co
AW Prime Oscillator
AW Trading Software Limited
5 (1)
Uma combinação de dois osciladores. O primeiro exibe os pontos de entrada, o segundo mostra a tendência atual. O indicador pode exibir sinais do oscilador por meio de setas em dois modos, todos os sinais do oscilador rápido ou sinais apenas na direção da tendência atual. Possui painel multi-timeframe e três tipos de notificações de sinal. Benefícios: Adequado para negociação diurna e de scalping Filtragem de tendências Configuração simples e sensível Painel multiperíodo Adequado para integração
Atomic Analyst
Issam Kassas
5 (14)
Atomic Analyst — MetaTrader 4 Para dúvidas sobre o produto, orientação de configuração ou suporte técnico, envie-me uma mensagem diretamente aqui no MQL5. O indicador transforma cálculos complexos do mercado em sinais visuais simples, candles coloridos, leituras de tendência, níveis de stop loss e várias zonas de take profit que os traders podem entender rapidamente e usar em condições reais de mercado. Principais usos de trading: Scalping e day trade: Desenvolvido para tomada de decisão rápida
M1 Sniper
Oleg Rodin
4.97 (30)
O M1 SNIPER é um sistema indicador de negociação fácil de usar. É um indicador de seta projetado para o período M1. O indicador pode ser usado como um sistema independente para scalping no período M1 e pode ser usado como parte do seu sistema de negociação existente. Embora este sistema de negociação tenha sido projetado especificamente para negociação no M1, ele também pode ser usado em outros períodos. Originalmente, desenvolvi este método para negociar XAUUSD e BTCUSD. Mas considero-o útil ta
SIO Oscillator: oscilador auto-otimizável de desequilíbrio de semivariância Compre o indicador e receba GRÁTIS o Expert Advisor (EA) baseado nele. A maioria dos osciladores trata todo movimento de preço da mesma forma. O SIO separa a pressão de alta da pressão de baixa e mede o desequilíbrio entre elas, mostrando qual lado realmente controla o mercado: compradores ou vendedores. Quando o desequilíbrio atinge um extremo, o SIO gera um sinal claro com níveis de entrada, Stop Loss e Take Profit. O
Hidden Cycles
Lev Vladimirovic Marushkin
5 (1)
The Only 100% Universal Tool! Stop trading against nature! This is your chance to secure the only indicator rooted in the absolute laws that govern the entire universe. Most tools guess—this one reveals the truth. Buy another toy or buy the truth. Your choice... Based on Universal Laws — NOT Some Guy’s Algorithm: Let the market adjust to the Hidden Cycles Geometry — not the other way around. Most indicators are based on a man-made formula. They often lag, fail over time, or need constant re-o
Neo Wave PRO
Nikolay Raykov
5 (1)
Price & Time Market Structure Indicator A professional market structure tool that analyzes waves through both price and time — not price alone. Main Description NeoWave PRO is a professional market structure indicator for MetaTrader 4 designed for traders who want to move beyond traditional one-dimensional wave tools such as ZigZag, swing indicators, and basic high/low systems. Most wave indicators analyze only one thing: Price. But a real market wave is not only a price movement. A true wave de
Este indicador examina a estrutura de preços de fractais de diferentes períodos para determinar possíveis pontos de reversão no mercado, proporcionando tempo aos traders posicionais que já possuem um modelo de avaliação fundamental ou técnico. Diferentemente de seu irmão mais novo, Reversal Fractals , esse indicador não perde reversões por causa do período selecionado e encontra fractais de reversão em zigue-zague, ignorando as reversões que não possuem impulso suficiente para iniciar um movime
CRT Multi-Timeframe Market Structure & Liquidity Sweep Indicator Non-Repainting | Multi-Asset | MT5 Version Available MT5 Version:   https://www.mql5.com/en/market/product/162075 Full User Guide — explains what each feature does and why:   https://www.mql5.com/en/blogs/post/767525 Quick Start User Guide  — explains how to configure and in what order:  https://www.mql5.com/en/blogs/post/767540 Indicator Overview CRT Ghost Candle HTF Fractal is a complete institutional-grade market structure too
Gann Time Clusters
Martin Eshleman
2.5 (2)
Gann Time Clusters Indicator This indicator is based on W. D. Gann's Square of 9 method for the time axis. It uses past market reversal points and applies the mathematical formula for Gann's Square of 9 and then makes projections into the future. A date/time where future projections line up is called a 'time cluster'. These time clusters are drawn as vertical lines on the right side of the chart where the market has not advanced to yet. A time cluster will result in a market reversal point (ex.
Non repaint MT4
Yan Zhen Du
5 (1)
This is a professional chart indicator designed for traders focused on stability and clear price action. It helps filter market noise and provides clear visual entry and exit zones for your trading decisions. Core Features: Strictly Non-Repainting: The system is built with strict non-repaint logic. What you see on the chart is the true historical performance. Confirmed Signals: Signals are triggered and confirmed only after the candle closes . Once a trading arrow appears on a closed candle, it
Forex Breath System é um sistema de negociação baseado em tendências que pode ser usado em qualquer mercado. Você pode usar este sistema com moedas, metais, commodities, índices, criptografia e até ações. Também pode ser usado em qualquer período de tempo. O sistema é universal. Ele mostra tendência e fornece sinais de seta com a tendência. O indicador também pode fornecer um tipo especial de alerta quando os sinais aparecem na direção da tendência, o que torna a negociação de tendências uma tar
Advanced Supply Demand
Bernhard Schweigert
4.91 (302)
Atualmente com 30% de desconto! A melhor solução para qualquer Trader Novato ou especialista! Este indicador é uma ferramenta de negociação exclusiva, de alta qualidade e acessível porque incorporamos uma série de recursos proprietários e uma nova fórmula. Com esta atualização, você poderá mostrar fusos horários duplos. Você não só será capaz de mostrar um TF mais alto, mas também mostrar ambos, o TF do gráfico, MAIS o TF mais alto: MOSTRANDO ZONAS ANINHADAS. Todos os traders de Oferta e Demanda
ACTUALMENTE 40% DE DESCONTO!! A melhor solução para qualquer novato ou comerciante especializado! Este indicador é uma ferramenta comercial única, de alta qualidade e acessível, porque incorporámos uma série de características proprietárias e uma fórmula secreta. Com apenas UM gráfico, dá alertas para todos os 28 pares de moedas. Imagine como a sua negociação irá melhorar porque é capaz de identificar o ponto exacto de desencadeamento de uma nova tendência ou oportunidade de escalada! Constr
Super Signal – Skyblade Edition Sistema profissional de sinais de tendência sem repintar / sem atraso com taxa de acerto excepcional | Para MT4 / MT5 Funciona melhor em timeframes mais curtos, como 1 minuto, 5 minutos e 15 minutos. Principais características: Super Signal – Skyblade Edition é um sistema inteligente de sinais desenvolvido especificamente para operações com tendência. Utiliza uma lógica de filtragem em múltiplas camadas para detectar apenas movimentos direcionais fortes sustenta
Liquidity Scalper System: um sistema de trading baseado em liquidez no formato de indicador. A maioria dos indicadores mostra apenas uma seta, e depois o trader decide sozinho onde colocar o stop, onde está o alvo e se pode confiar no sinal. O Liquidity Scalper System cobre todo o ciclo da operação: encontra pools de liquidez, dá um sinal no seu rompimento, calcula imediatamente Entry, Stop Loss e três alvos, e mostra no painel as estatísticas e os resultados da validação em dados novos. O sist
Torne-se um Negociador Breaker e lucre com as mudanças na estrutura do mercado à medida que o preço reverte. O indicador de quebra de bloco de pedidos identifica quando uma tendência ou movimento de preço está chegando à exaustão e pronto para reverter. Ele o alerta sobre mudanças na estrutura do mercado, que normalmente ocorrem quando uma reversão ou uma grande retração está prestes a ocorrer. O indicador usa um cálculo proprietário que identifica rupturas e momento do preço. Toda vez que um
Gann Made Easy
Oleg Rodin
4.84 (174)
Gann Made Easy é um sistema de negociação Forex profissional e fácil de usar, baseado nos melhores princípios de negociação usando a teoria do sr. W. D. Gann. O indicador fornece sinais precisos de COMPRA e VENDA, incluindo níveis de Stop Loss e Take Profit. Você pode negociar mesmo em movimento usando notificações PUSH. Entre em contato comigo após a compra para receber instruções de negociação e ótimos indicadores extras gratuitamente! Provavelmente você já ouviu muitas vezes sobre os métodos
Neuro Poseidon MT4
Daria Rezueva
4.74 (46)
Neuro Poseidon is a new indicator by Daria Rezueva. It combines precise trading signals with adaptive TP/SL levels - creating best possible trades as a result! Message me and get  Neuro Poseidon Assistant  as a gift to automize your trading process! What makes it stand out? 1. Proven profitability on all assets and timeframes 2. Only confirmed BUY and SELL signals present on the chart 3. Adaptive TP & SL levels generated by the software for each trade 4. Easy to understand - suitable for all
Gold Channel   é um indicador baseado na volatilidade, desenvolvido com um algoritmo de tempo especifico para o par XAUUSD que consiste em encontrar possíveis correções no mercado. Este indicador mostra duas linhas exteriores, uma interior (linha de retração) e um sinal de seta, onde a teoria do canal consiste em ajudar a identificar condições de sobrecompra e sobrevenda no mercado. O preço do mercado cairá geralmente entre os limites do canal. Se os preços tocarem ou se moverem para fora do can
Actualmente 30% OFF ! A melhor solução para qualquer novato ou comerciante especializado! Este software de painel de instrumentos está a funcionar em 28 pares de moedas. É baseado em 2 dos nossos principais indicadores (Advanced Currency Strength 28 e Advanced Currency Impulse). Dá uma grande visão geral de todo o mercado Forex. Mostra valores avançados de força da moeda, velocidade de movimento da moeda e sinais para 28 pares de divisas em todos os (9) períodos de tempo. Imagine como a sua n
Italo Volume Indicator
Italo Santana Gomes
4.92 (79)
BUY INDICATOR AND GET EA FOR FREE AS A BONUS + SOME OTHER GIFTS! ITALO VOLUME INDICATOR  is the best volume indicator ever created, and why is that? The Indicator works on all time-frames and assets, indicator built after 7 years of experience on forex and many other markets. You know many volume indicators around the internet are not complete, does not help, and it's difficult to trade, but the Italo Volume Indicator is different , the Italo Volume Indicator shows the wave volume, when market
TDI Multi Timeframe Scanner: This Dashboard indicator uses the TDI (Trader's Dynamic Index) Indicator to find best trades. Read detailed How to Use Guide: https://www.mql5.com/en/blogs/post/758252 Extra indicators also available in above post. Checks for: - SharkFin Pattern Free indicator for SharkFin: https://www.mql5.com/en/market/product/42405/ - TDI Trend: Strong/Weak Trend Up/Down - TDI Signal: Strong/Medium/Weak Signal for Buy/Sell - Consolidation - Overbought/Oversold - Volatility Ban
Mais do autor
A volatility squeeze is when the Bollinger Bands contract inside the Keltner Channel. Price is coiling, and the release that follows is often a strong move. Finding squeezes by hand across dozens of charts and timeframes is slow. CalmFx Squeeze Ranker scans your symbol list, or your whole Market Watch filtered by asset class, from a single chart and scores every market from 0 to 100, with the tightest coils at the top. How the score works Compression: how deep the Bollinger Bands sit inside the
A quiet session on a symbol that normally moves a lot has to resolve somewhere. CalmFx Session Range Ranker measures how tight a reference session's range was (Tokyo by default) against each symbol's own average daily range. It ranks your whole watchlist from 0 to 100 and shows the break levels next to the score, so you can see which markets are coiled ahead of the next session and where they would break. How the score works Compression: the session range as a percentage of the symbol's average
Markets that stretch too far from their mean tend to snap back. CalmFx Snap Ranker scans your symbol list, or your whole Market Watch, from a single chart and scores how stretched each market is from 0 to 100. The strongest snap-back candidates appear at the top, each with its expected direction. How the score works RSI: how far RSI is past its overbought or oversold level. Band position: how far price sits across the Bollinger Bands. 100 means at a band, and higher means it has closed outside.

Markets that move strongly and cleanly in one direction tend to keep going. CalmFx Surge Ranker scans your symbol list, or your whole Market Watch, from a single chart and scores the strength and cleanliness of each market's current move from 0 to 100. The strongest, cleanest trends appear at the top, each with its direction. How the score works Momentum: the rate of change measured in ATR units, so a currency pair, an index and gold can be compared fairly. Trend quality: how straight the move i
See the trend on nine timeframes at once. CalmFx MultiTF Trend Dashboard reads M1, M5, M15, M30, H1, H4, D1, W1 and MN on the chart symbol and shows each one as BULL, BEAR or MIX, with how long that reading has held and an overall bias across the board. What it shows One row per timeframe, from a fast moving average against a slow one (8 and 200 by default). A timer on each row showing how long the current reading has held. An overall bias and an agreement meter showing how aligned the nine time
The four forex sessions at a glance. CalmFx Sessions Clock shows which of Sydney, Tokyo, London and New York are open, a live countdown to the next open or close, and how far each open session has run. What it shows Open or closed for each session, with its hours in GMT. A live countdown to the next open or close. Progress through each open session. The server time and GMT in the title bar. Daylight saving handled properly London, New York and Sydney change their clocks on different dates, and S
FREE
Support and resistance zones drawn from where price has actually turned. CalmFx SR Zones finds swing highs and lows, merges the ones that sit close together into zones, and counts how many times each zone has been touched. Only zones with enough touches are drawn. How the zones are built Swing points are found with a strength you choose (bars on each side). Swing points within a fraction of ATR are merged into one zone, so the zone width suits the market: the same inputs work on a currency pair,
Three moving averages drawn as two coloured clouds, so trend, pullback and turn are visible at a glance. CalmFx Trend Ribbon shades between the fast and mid averages, and between the mid and slow averages, and each cloud changes colour with its direction. What it draws A fast-to-mid cloud for the quick read and a mid-to-slow cloud for the structure. The three moving average lines on top (8, 38 and 200 by default). Periods, method and applied price are inputs. An optional Bollinger envelope drawn
CalmFx Trading Panel is an on-chart panel for manual trading in MetaTrader 5. It places market and pending orders in one click, manages open positions with a trailing stop and a hedge button, and shows sessions, multi-timeframe trend, RSI alerts and the economic calendar on the same chart. The panel works on any symbol. Distance settings such as take profit, trailing stop and pending order offsets are scaled automatically to each market's average daily range, so the same settings behave consiste
The Daily Dipper Skipper is an on-chart dashboard that watches a list of symbols on several timeframes at once and shows where RSI is in, or approaching, an oversold ("dip") or overbought ("rip") zone. It is a monitoring and alerting tool. It does not open, modify or close trades. It reads RSI on D1, H12, H8, H4 and H1. Each symbol is given a class from A to E that sets how many of those timeframes it is watched on, so your most-traded instruments can be watched on all five while quieter ones st
A volatility squeeze is when the Bollinger Bands contract inside the Keltner Channel. Price is coiling, and the release that follows is often a strong move. Finding squeezes by hand across dozens of charts and timeframes is slow. CalmFx Squeeze Ranker scans your symbol list, or your whole Market Watch filtered by asset class, from a single chart and scores every market from 0 to 100, with the tightest coils at the top. How the score works Compression: how deep the Bollinger Bands sit inside the
A quiet session on a symbol that normally moves a lot has to resolve somewhere. CalmFx Session Range Ranker measures how tight a reference session's range was (Tokyo by default) against each symbol's own average daily range. It ranks your whole watchlist from 0 to 100 and shows the break levels next to the score, so you can see which markets are coiled ahead of the next session and where they would break. How the score works Compression: the session range as a percentage of the symbol's average
Markets that stretch too far from their mean tend to snap back. CalmFx Snap Ranker scans your symbol list, or your whole Market Watch, from a single chart and scores how stretched each market is from 0 to 100. The strongest snap-back candidates appear at the top, each with its expected direction. How the score works RSI: how far RSI is past its overbought or oversold level. Band position: how far price sits across the Bollinger Bands. 100 means at a band, and higher means it has closed outside.
Markets that move strongly and cleanly in one direction tend to keep going. CalmFx Surge Ranker scans your symbol list, or your whole Market Watch, from a single chart and scores the strength and cleanliness of each market's current move from 0 to 100. The strongest, cleanest trends appear at the top, each with its direction. How the score works Momentum: the rate of change measured in ATR units, so a currency pair, an index and gold can be compared fairly. Trend quality: how straight the move i
See the trend on ten timeframes at once. CalmFx MultiTF Trend Dashboard reads M1, M5, M15, M30, H1, H2, H4, H8, H12 and D1 on the chart symbol and shows each one as BULL, BEAR or MIX, with how long that reading has held and an overall bias across the board. What it shows One row per timeframe, from a fast moving average against a slow one (8 and 200 by default). A timer on each row showing how long the current reading has held. An overall bias and an agreement meter showing how aligned the ten t
The four forex sessions at a glance. CalmFx Sessions Clock shows which of Sydney, Tokyo, London and New York are open, a live countdown to the next open or close, and how far each open session has run. What it shows Open or closed for each session, with its hours in GMT. A live countdown to the next open or close. Progress through each open session. The server time and GMT in the title bar. Daylight saving handled properly London, New York and Sydney change their clocks on different dates, and S
FREE
Support and resistance zones drawn from where price has actually turned. CalmFx SR Zones finds swing highs and lows, merges the ones that sit close together into zones, and counts how many times each zone has been touched. Only zones with enough touches are drawn. How the zones are built Swing points are found with a strength you choose (bars on each side). Swing points within a fraction of ATR are merged into one zone, so the zone width suits the market: the same inputs work on a currency pair,
Three moving averages drawn as two shaded clouds, so trend, pullback and turn are visible at a glance. CalmFx Trend Ribbon shades between the fast and mid averages, and between the mid and slow averages, and each cloud changes colour with its direction. What it draws A fast-to-mid cloud for the quick read and a mid-to-slow cloud for the structure. The three moving average lines on top (8, 38 and 200 by default). Periods, method and applied price are inputs. An optional Bollinger envelope drawn a
Filtro:
Sem comentários
Responder ao comentário