Sniper Vector
- Indicators
-
Jawad Ali Shah Ali
 Trader | EA & Utility Developer specializing in Forex, Crypto, Stocks, Algorithmic Trading, and Automated Trading Solutions. Focused on smart trading strategies, market analysis, and risk management.
- Version: 2.0
- Activations: 5
Sniper Vector is a multi-timeframe trend indicator for MetaTrader 5. It colors your candles by trend state, prints Buy / Sell arrows on closed bars, and draws a ready-to-read entry zone with Stop Loss and three Take Profit levels – all controlled from a clean on-chart dashboard.
The indicator does not open or manage trades. It is an analysis and decision-support tool.
What you see on the chart
- Trend candles – every candle is painted by state:
- Blue = Buy trend
- Red = Sell trend
- Gray = Weak / no-trade conditions (choppy market)
- Buy / Sell arrows – printed on the closed bar when the trend state changes into a confirmed Buy or Sell.
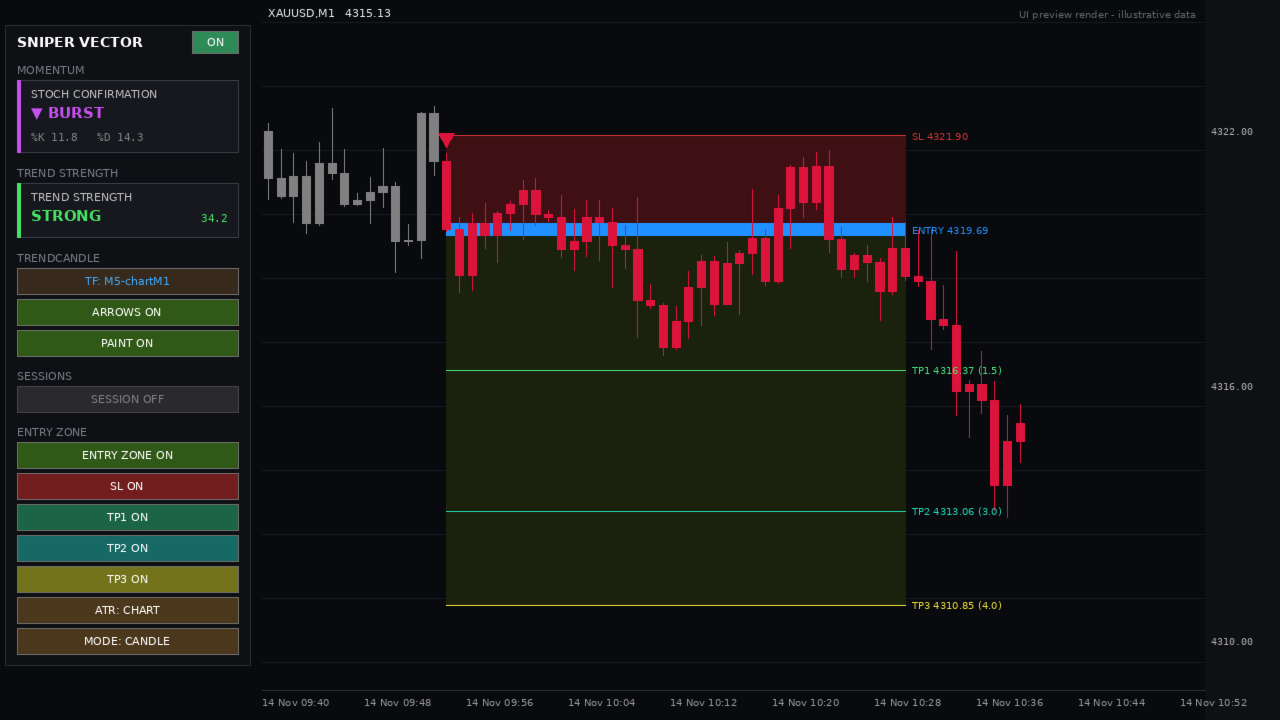
- Entry zone – for the latest signal: ENTRY level, SL level, TP1, TP2, TP3 with shaded risk and reward areas. The zone ends automatically when SL or TP3 is reached.
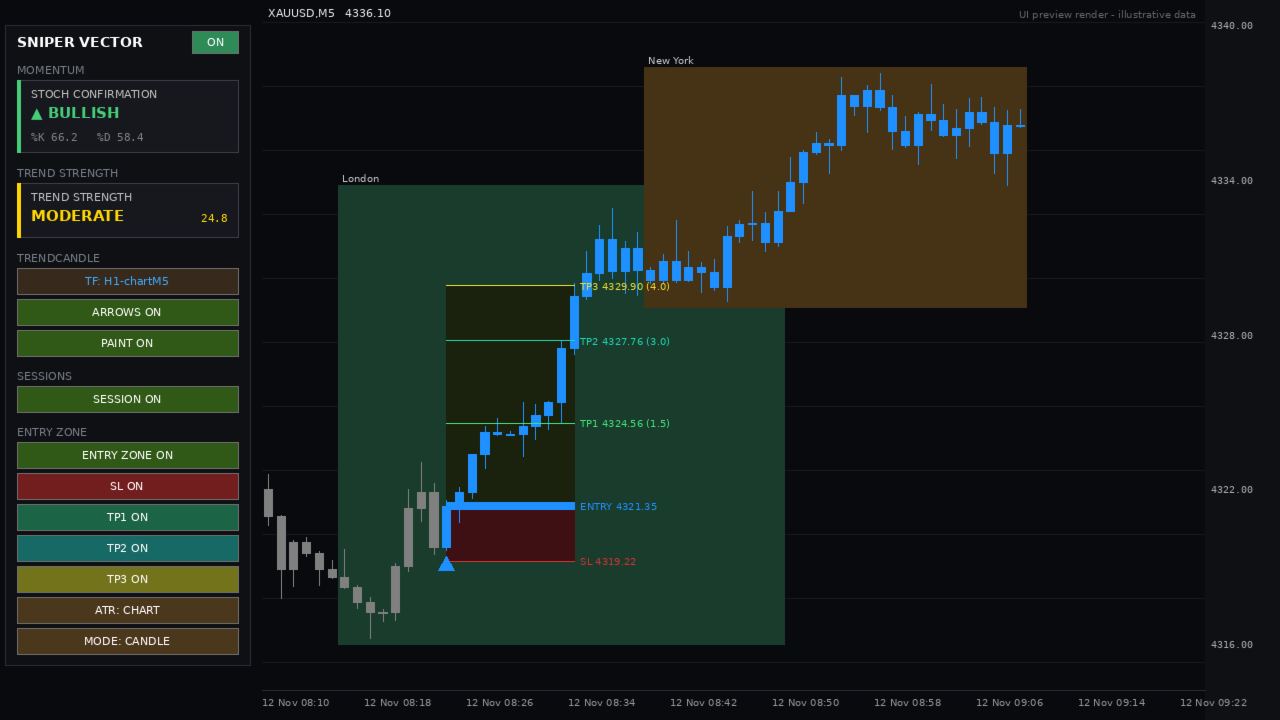
- Session boxes – Sydney, Tokyo, London and New York session ranges, drawn directly on the chart.
- Dashboard – a compact control panel on the left side of the chart.
How the trend state is built
Three layers must agree before a candle is painted Buy or Sell:
- Trend engine – an ATR-based trailing trend line on the chart timeframe.
- Higher-timeframe filter – the direction of a higher timeframe (EMA 21 / EMA 50 by default). By default only the last closed higher-timeframe bar is used, which keeps the higher-timeframe reading stable.
- ADX filter – when ADX is below the minimum level, the candle is painted gray (weak) instead of Buy / Sell.
If one layer disagrees, the candle stays gray. This is designed to keep you away from low-quality, choppy conditions.
Dashboard
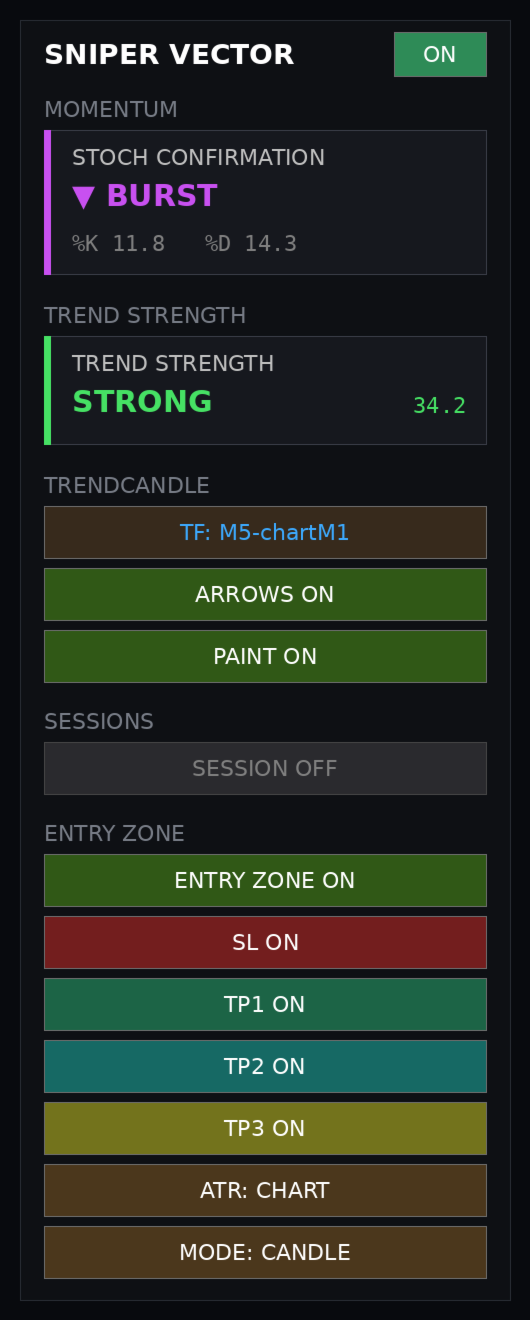
- MOMENTUM – Stochastic confirmation card: BURST (both lines in an extreme zone), BULLISH, BEARISH or NEUTRAL, with live %K and %D.
- TREND STRENGTH – ADX based: WEAK, MODERATE or STRONG, with the live ADX value.
- TRENDCANDLE
- TF button – cycles the higher timeframe (M5, M15, M30, H1, H4, D1).
- ARROWS – show / hide signal arrows.
- PAINT – show / hide the trend candles (your original candles come back when paint is off).
- SESSIONS – show / hide session boxes.
- ENTRY ZONE
- ENTRY ZONE , SL , TP1 , TP2 , TP3 – show / hide each part.
- ATR: CHART / HTF – which timeframe's ATR is used for the stop-loss calculation.
- MODE: CANDLE / ATR – how the stop loss is placed (see below).
- ON / OFF – master switch in the dashboard header.
Entry zone logic
- Entry = close of the signal candle.
- MODE: CANDLE – SL is placed beyond the signal candle's extreme (low for Buy, high for Sell) plus an ATR buffer.
- MODE: ATR – SL is placed at a fixed ATR distance from entry.
- TP1 / TP2 / TP3 = risk × reward ratio (defaults 1.5 / 3.0 / 4.0, all adjustable).
The zone is a visual planning aid. Position sizing and trade management remain entirely your decision.
Alerts
Popup, push notification, e-mail and sound alerts when a new Buy or Sell signal appears.
Main input parameters
| Group | Parameter | Meaning |
|---|---|---|
| Trend engine | HTF | Higher timeframe used for the filter |
| HTF fast / slow EMA | EMA periods on the higher timeframe (21 / 50) | |
| HTF no-repaint | Use only the closed higher-timeframe bar | |
| ST ATR period / multiplier | Sensitivity of the trend engine (10 / 3.0) | |
| ADX period / min level / strong level | Weak-market filter and strength labels (14 / 18 / 30) | |
| Stochastic | K / D / Slow, OB / OS | Momentum card settings (14-3-3, 80 / 20) |
| Entry zone | TP1 / TP2 / TP3 RR | Reward-to-risk ratios (1.5 / 3 / 4) |
| SL ATR buffer / multiplier | Stop-loss distance settings for CANDLE / ATR mode | |
| Zone bars | Maximum width of the zone in bars | |
| Signals | Alerts | Popup / push / e-mail / sound |
| Look | Colors, hide original candles, panel position, button size | Appearance |
| Sessions | Broker GMT offset, session hours, colors | Set the GMT offset to match your broker's server time |
How to use
- Attach Sniper Vector to the chart and pick a higher timeframe with the TF button (for example M5 filter on an M1 chart, or H1 filter on an M15 chart).
- Wait for colored candles and an arrow on a closed bar. Gray candles mean no clean setup.
- Check the dashboard: Trend Strength should not be WEAK, and the Momentum card should not point against the signal.
- Use the entry zone to plan Stop Loss and Take Profit levels, and size your position according to your own risk rules.
- Prefer the London and New York sessions, when liquidity is higher; use the session boxes to see where you are.
Important notes
- Arrows are printed on closed bars. The candle that is still forming can change color until it closes – wait for the bar close before acting on a signal.
- Set Broker GMT offset correctly, otherwise session boxes will be shifted.
- Results depend on market conditions and your own risk management. No indicator is right all the time – test on a demo account first.
- New on-chart dashboard (Momentum, Trend Strength, TrendCandle, Sessions, Entry Zone).
- Entry zone with SL, TP1, TP2, TP3 and ATR / candle stop-loss modes.
- Higher-timeframe button, arrows / paint / session toggles.
- Session boxes, alerts, performance improvements.
- First release: multi-timeframe trend candles, Buy / Sell arrows, alerts.
| # | What to capture | Caption (English) |
|---|---|---|
| 1 | M1 or M5 chart with full dashboard, colored candles, one Sell or Buy entry zone visible (SL + TP1/2/3 lines) | Trend candles, dashboard and entry zone |
| 2 | Same setup on M15 / H1 with a Buy arrow and zone | Buy signal with SL and three Take Profit levels |
| 3 | Chart with gray (weak) candles between colored trends | Gray candles flag weak, choppy conditions |
| 4 | Dashboard close-up (crop the left panel), Momentum showing BURST and Trend Strength showing STRONG | On-chart dashboard: momentum and trend strength |
| 5 | Chart with session boxes ON (London + New York visible) | Sydney, Tokyo, London and New York session boxes |
| 6 | PAINT OFF + original candles with only arrows and zone | Use only arrows and entry zone on your own candles |
| 7 | Inputs window (Inputs tab) | Fully adjustable inputs |
Risk warning
Trading leveraged products such as Forex, metals, indices and crypto involves a high level of risk and may not be suitable for everyone. This indicator is a technical analysis tool and does not guarantee profits. Past performance does not guarantee future results.