YazanPro Supply Demand Flow
- Indicators
-
Yazan Adnan Ramadan Ibrahim
 Algorithmic trader and MQL5 developer based in Jordan. I build Expert Advisors for MetaTrader 5 focused on gold (XAUUSD) and major FX pairs: multi-module confluence systems, short-hold scalping tools and manual trade panels. Each product is tested in the Strategy Tester on real ticks with
- Version: 1.0
- Activations: 10
YazanPro Supply Demand Flow is a MetaTrader 5 indicator that draws supply and demand zones, fair value gaps, VWAP bands, volume spike dots, session boxes and day levels on the chart, and sums up the recent volume in a panel. It works on any symbol (forex, metals, indices, stocks, crypto) and on any timeframe from M1 to MN1. It is a display tool: it places no orders and gives no signals.
What you see on the chart (the numbers match the call-outs in the screenshots)
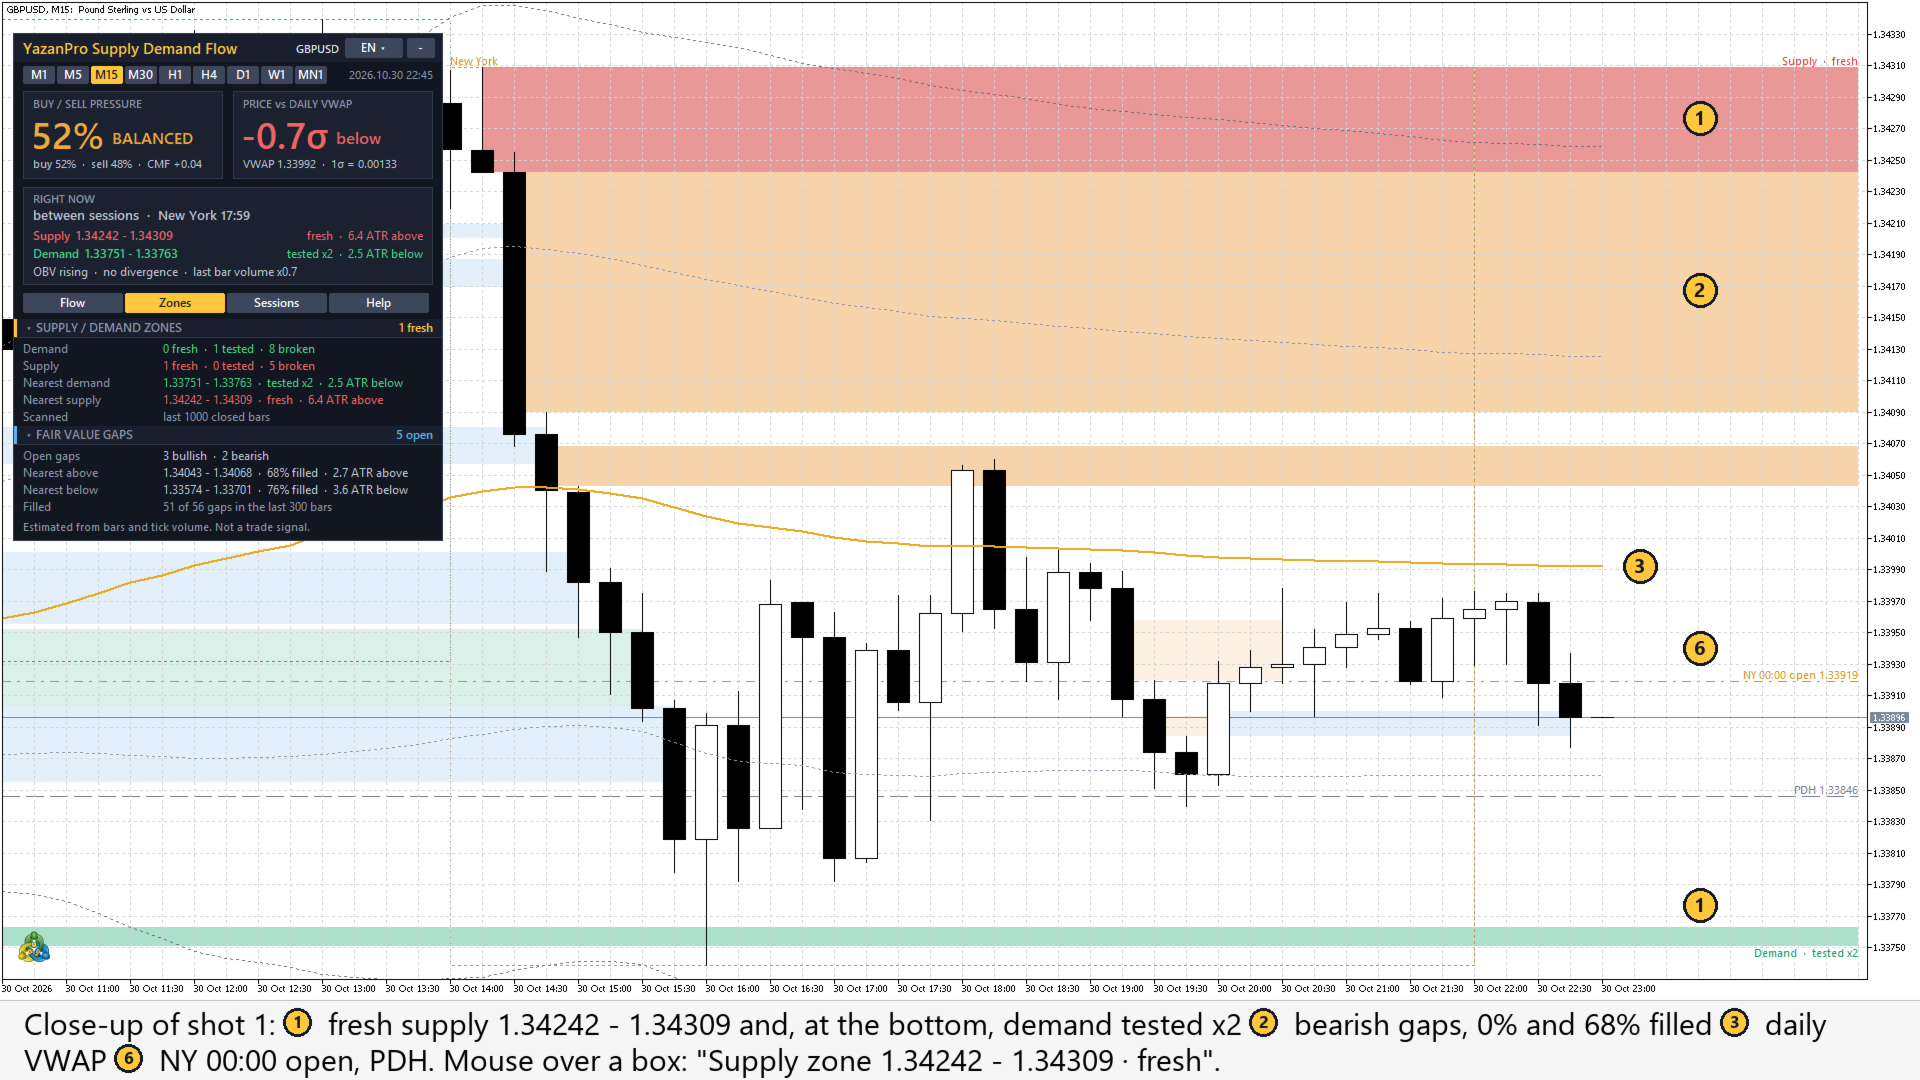
- Supply and demand zones. A zone is 1 to 3 small base bars followed by an impulse bar that closes beyond them. Red = supply, green = demand. The shade shows the state: strong = fresh (price has not come back yet), softer = tested (price came back and the zone held; the label at the right edge shows how many times, for example "Supply · tested x2"), faint = broken (a bar closed beyond the far edge; the box stops at that bar). Valid zones extend to the right.
- Fair value gaps. Three-bar imbalances: the third bar's low stays above the first bar's high (bullish, blue box) or its high stays below the first bar's low (bearish, orange box). Open gaps extend to the right. When price trades back through the whole gap it is marked filled: faint and cut at that bar.
- VWAP with bands. The volume-weighted average price of the day as a gold line, with dotted bands at 1 and 2 standard deviations. It restarts each day (each week on D1, each month on W1, each year on MN1); the day can start at server midnight, New York midnight or New York 17:00.
- Volume spike dots. A green dot under a closed bar that closed up, or a red dot over one that closed down, when its volume is at least 2 times the average of the 20 bars before it (both numbers are inputs).
- Session boxes. Dotted Asia, London and New York boxes with their high and low on M1 to H1 charts. You type the session times in New York time; the indicator places them on the server clock with the US and EU summer time rules, so they stay in place through the clock changes. The server offset is detected automatically or set in the inputs.
- Day levels. The previous day high and low (dashed, PDH / PDL) and the New York midnight open (dash-dot line).
- Two large tiles. BUY / SELL PRESSURE: the share of the last 20 closed bars' volume that closed toward the high (buy) or the low (sell), with the word BUY, SELL or BALANCED and the Chaikin money flow value. PRICE vs VWAP: how many standard deviations (σ) the price is above or below the VWAP of the day (week, month or year on D1, W1, MN1).
- RIGHT NOW box. The session running now with the New York time, the nearest valid supply zone above and demand zone below the price (fresh first, else tested) with their state and distance in ATR, the OBV direction, the A/D divergence flag and the last bar's volume against its average.
- Tabs and header. Flow: buy / sell split, delta (CMF), OBV slope, A/D divergence, last bar volume and which volume is used. Zones: fresh / tested / broken counts, the nearest zones, the open gaps and the nearest gap above and below with how much of it is filled. Sessions: New York and server time, the last Asia, London and New York high and low, the server clock setting, PDH / PDL, the New York midnight open, the VWAP and its bands. Help: what each drawing means and how the volume is estimated. The header has a language button with 12 languages (English, Arabic, Russian, Chinese, Spanish, Portuguese, Japanese, German, Korean, French, Italian, Turkish; the choice is kept per chart), timeframe buttons from M1 to MN1 and a fold button. Click a section strip to fold it. Rest the mouse on a tile, a zone or a gap for an explanation.
How to read it
- Find where price is. The RIGHT NOW box names the nearest valid supply zone above and demand zone below with the distance in ATR; on the chart they are the strongest red and green boxes.
- Check the state of a zone before you rely on it: fresh has not been visited, tested held the number of times in its label, broken is faint and over. An open gap between the price and a zone is a place where price may stop first.
- Read the two tiles: BUY / SELL PRESSURE tells which side the last 20 bars leaned to; PRICE vs VWAP tells whether price is stretched (near ±2σ) or close to its average for the day.
- On M1 to H1, use the session boxes, PDH / PDL and the New York midnight open as the reference levels of the day; the Sessions tab lists their prices.
- Open the Help tab for the meaning of every drawing. Everything here is context for your own analysis: the indicator gives no entry or exit signals.
Who it is for
Traders who mark supply and demand zones, fair value gaps, VWAP levels and session highs and lows by hand and want them drawn and kept up to date on every chart, with a short reading of the recent volume next to them.
About the volume (please read)
MetaTrader 5 forex and CFD symbols have only tick volume: the number of price changes in a bar. It is not exchange volume and not real buy or sell orders. This indicator does not read order flow from an exchange. It estimates it from the bars: the volume of a bar that closed near its high counts mostly as buying, near its low mostly as selling (volume x (close - low) / (high - low), the same formula as Chaikin money flow). OBV, A/D and the VWAP weights use the same tick volume. Where a symbol has real volume (some stocks and futures) you can switch to it in the inputs.
What it does not do
- It does not give buy or sell signals and has no entry arrows. The words BUY / SELL in the pressure tile describe the recent volume only.
- It does not predict prices and makes no claim about how often a zone, gap or VWAP band holds.
- It does not see real order flow, the order book or exchange volume on CFD symbols (see "About the volume").
- It places no orders and sends no alerts.
- It does not keep zones or gaps older than the scanned window (the last 1000 / 300 closed bars by default).
How it is computed
- ATR is a simple 14-bar average true range on the chart's own timeframe.
- Zone: an impulse bar whose body is at least 1.5 x ATR, with 1 to 3 base bars before it whose range is at most 1.0 x ATR, and a close beyond the base. The zone is the high-low of the base bars. Tested = price left the zone and came back into it. Broken = a close beyond the far edge. A new zone that overlaps a still valid zone of the same side is not added. Up to 30 valid zones and 10 broken ones are drawn, newest first.
- Fair value gap: at least 0.1 x ATR wide. Filled when a later bar trades through the far edge. Up to 20 open and 10 filled gaps are drawn.
- Buy / sell pressure: buy share = sum(volume x (close - low) / (high - low)) / sum(volume) over the last 20 closed bars. BUY above 54%, SELL below 46%, BALANCED in between. CMF = 2 x buy share - 1.
- OBV slope: linear regression slope of OBV over the last 20 closed bars, in average bar volumes per bar (rising above +0.15, falling below -0.15).
- A/D divergence: the 20-bar window is split into two halves. Bullish = price made a lower low while the cumulative A/D made a higher low; bearish = price made a higher high while A/D made a lower high.
- VWAP: sum(typical price x volume) / sum(volume) since the start of the period. The bands use the volume-weighted standard deviation of the typical price. The first bar of each period is left empty, so no line crosses the reset.
- Updates: zones, gaps, spikes and the flow numbers use closed bars and are computed once per new bar. The VWAP, its bands and the current session follow the live bar. The panel refreshes once a second.
The VWAP, its bands and the spike dots are indicator buffers (0 VWAP, 1 +1 SD, 2 -1 SD, 3 +2 SD, 4 -2 SD, 5 spike closed up, 6 spike closed down). Their colours and styles can be changed in the Colors tab, and other programs can read them with iCustom.
Inputs
Supply / demand zones
- Draw supply / demand zones: true
- Bars scanned for zones: 1000 (100..5000)
- Impulse bar body >= x ATR(14): 1.5
- Base bar range <= x ATR(14): 1.0
- Base bars before the impulse, max: 3 (1..5)
- Show tested zones: true
- Show broken zones: true (they end at the break bar)
- Most valid zones drawn: 30 (5..100, newest first)
- Demand colour / Supply colour: green / red
Fair value gaps
- Draw fair value gaps: true
- Bars scanned for gaps: 300 (50..5000)
- Smallest gap, x ATR(14): 0.1
- Show filled gaps: true (they end where filled)
- Most open gaps drawn: 20 (5..100, newest first)
- Bullish / bearish gap colour: blue / orange
VWAP and volume
- Draw the VWAP line: true
- Draw the 1 and 2 standard deviation bands: true
- VWAP day starts at: Server midnight (or New York midnight, New York 17:00. D1 chart: week, W1: month, MN1: year)
- Volume: Tick volume (real volume only where the symbol has it)
- Mark relative volume spikes: true
- Spike: average of the previous N bars: 20 (5..200)
- Spike: bar volume >= x that average: 2.0
- Buy / sell pressure and A/D window, bars: 20 (6..200)
- OBV slope window, bars: 20 (5..200)
Sessions and day levels (New York time)
- Draw session boxes: true (M1..H1 charts)
- Asia session: 19:00-03:00 (New York time, HH:MM-HH:MM)
- London session: 03:00-08:00 (New York time)
- New York session: 08:00-16:00 (New York time)
- Days of session boxes: 3 (1..20)
- Draw previous day high / low and the New York midnight open: true (charts below D1)
- Server GMT offset in winter, hours: 99 (99 = detect automatically)
- Server summer time rule: Europe (or USA, None)
Panel
- Show the panel: true
- Panel language: English (12 languages; also switchable on the panel)
- Tab shown first: Order flow (or Zones, Sessions, Help)
- Panel X / Y: 10 / 30 (pixels from the top-left corner)
Quick start and FAQ
Quick start
- Attach the indicator to any chart and any timeframe.
- Pick your language with the button at the top right of the panel.
- Read the two tiles and the RIGHT NOW box first. Then open the tabs: Flow, Zones, Sessions, Help.
- Rest the mouse on a tile, a section strip or a zone for an explanation.
FAQ
Is this real order flow?
No. MetaTrader 5 forex and CFD symbols only have tick volume. Buy and sell volume are estimated from where each bar closed in its range. See "About the volume".
Does it repaint?
Zones, gaps, spikes and the flow numbers use closed bars. A drawn zone or gap keeps its place, but its state changes as new bars close (fresh -> tested -> broken, open -> filled). Zones and gaps are searched in the last 1000 / 300 closed bars, so old ones leave the chart. The VWAP and the current session follow the live bar.
My broker's server is not GMT+2 / GMT+3. Are the sessions right?
The offset is detected from the server clock. If your broker follows US instead of EU summer time, set "Server summer time rule" to USA. In the Strategy Tester there is no live clock: set the offset in the inputs (the default there is GMT+2 with EU summer time).
Why no session boxes on H4 and above?
A session is only one or two bars there. The Sessions tab still shows the last session highs and lows.
Can an Expert Advisor read it?
Yes, the VWAP, bands and spike dots are buffers 0 to 6 (see "How it is computed"). Zones and gaps are chart objects only.
Risk warning
Trading carries a high risk of loss. This indicator does not predict prices and does not guarantee any result. Volume readings on MetaTrader 5 CFD symbols are estimates from tick volume. Use it as context for your own analysis, never as a trade signal on its own.