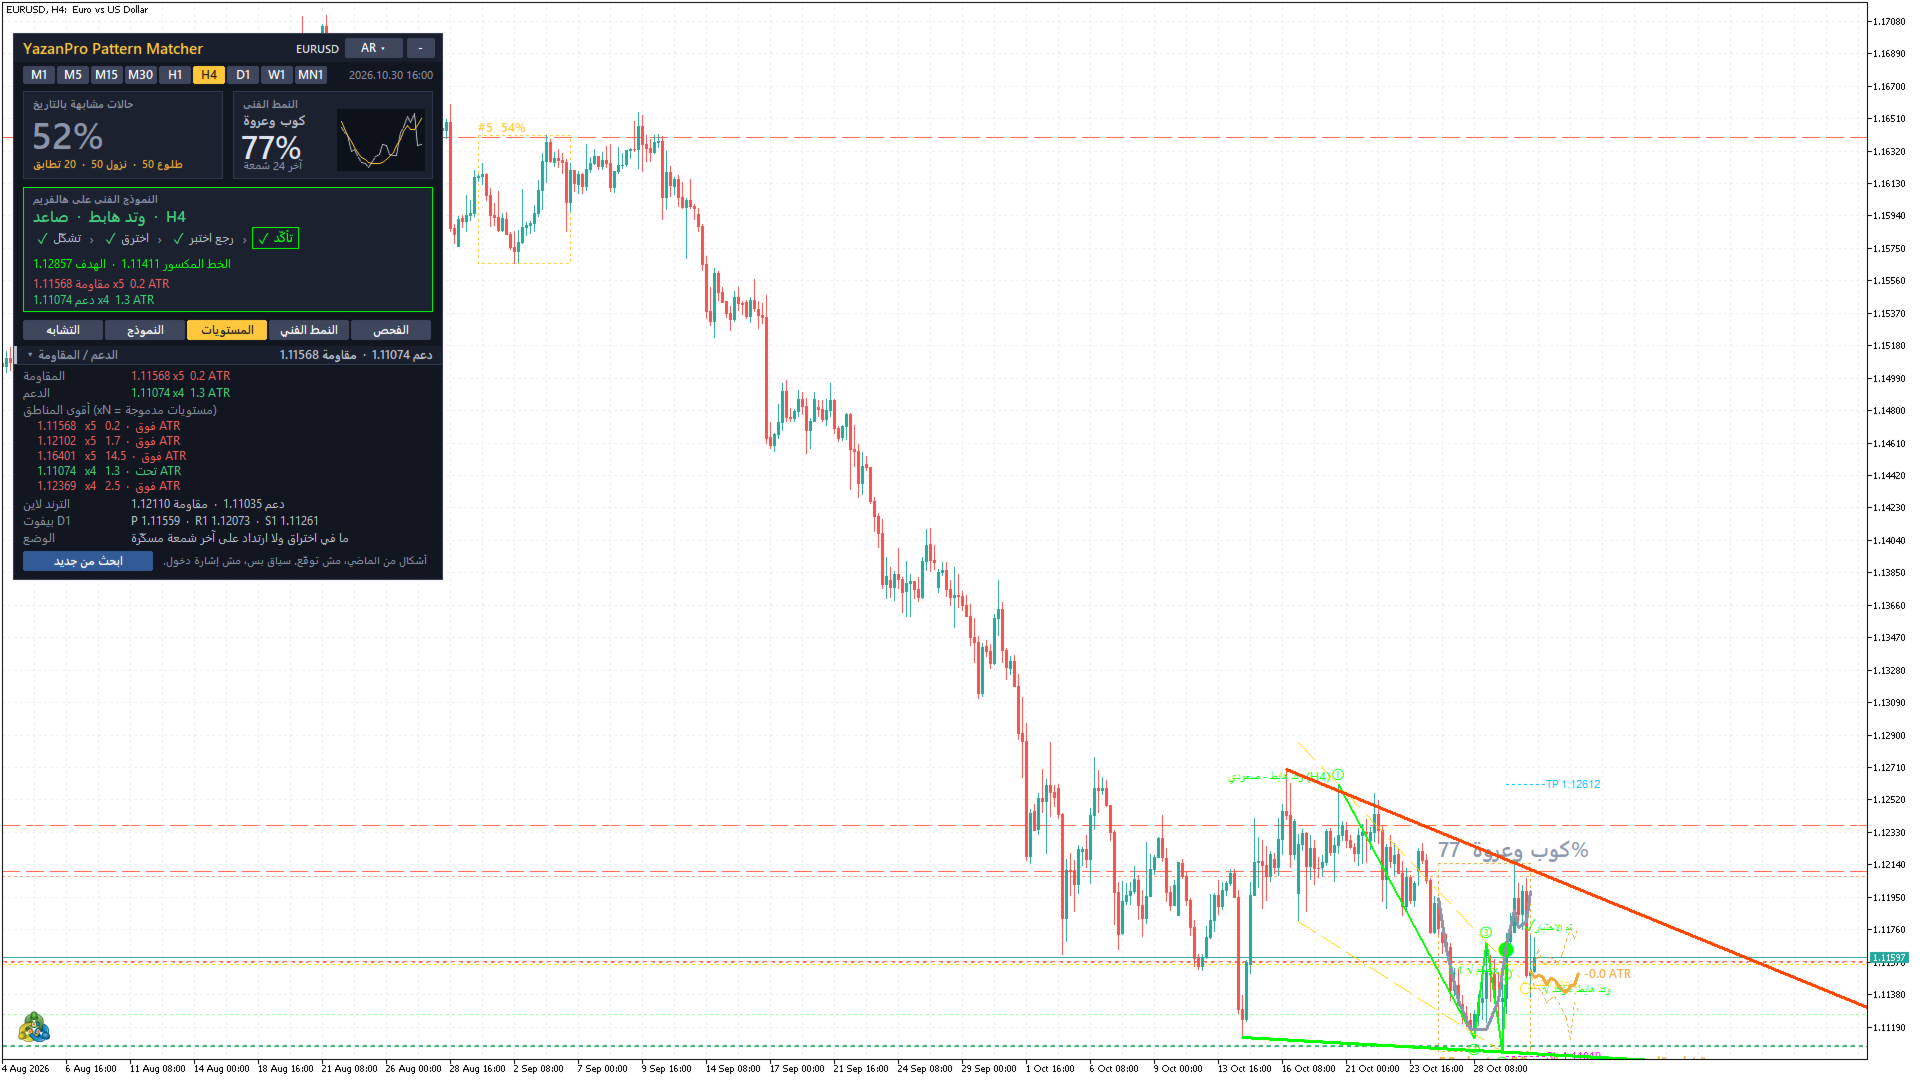
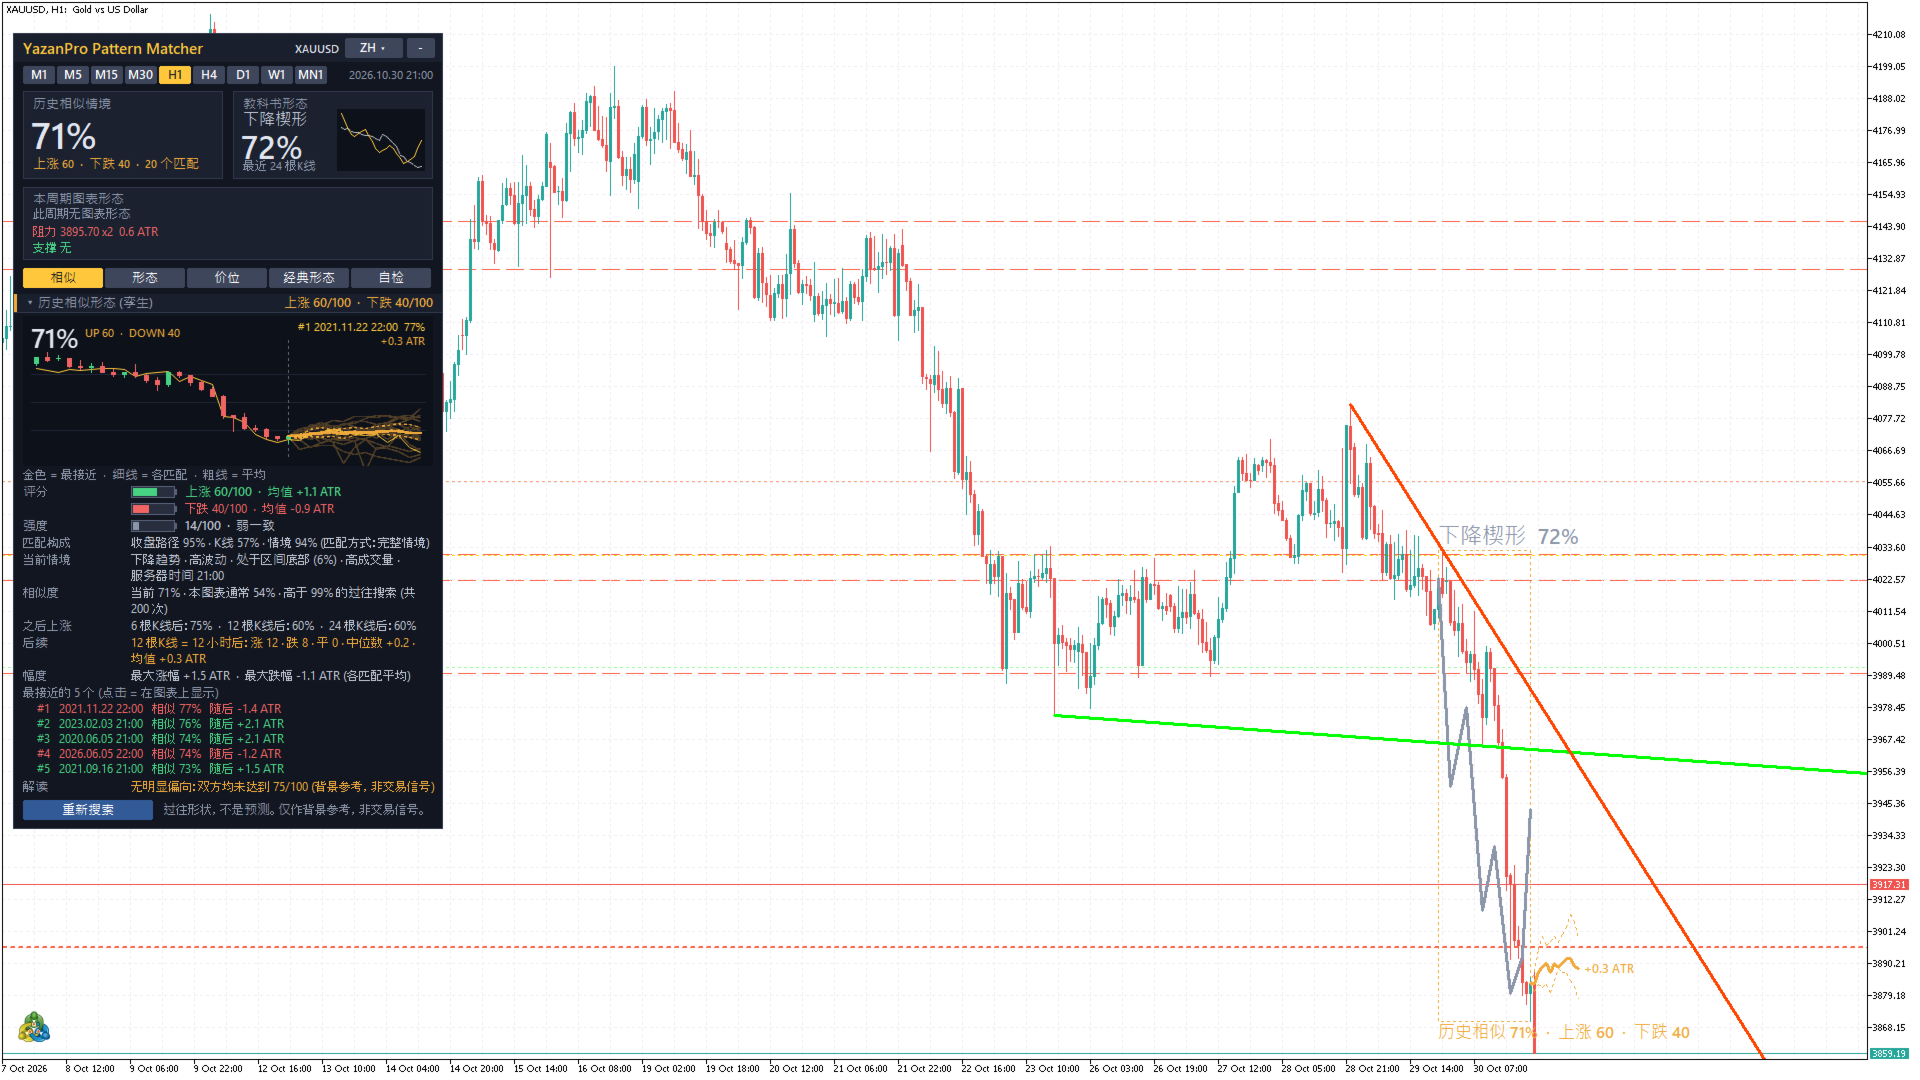
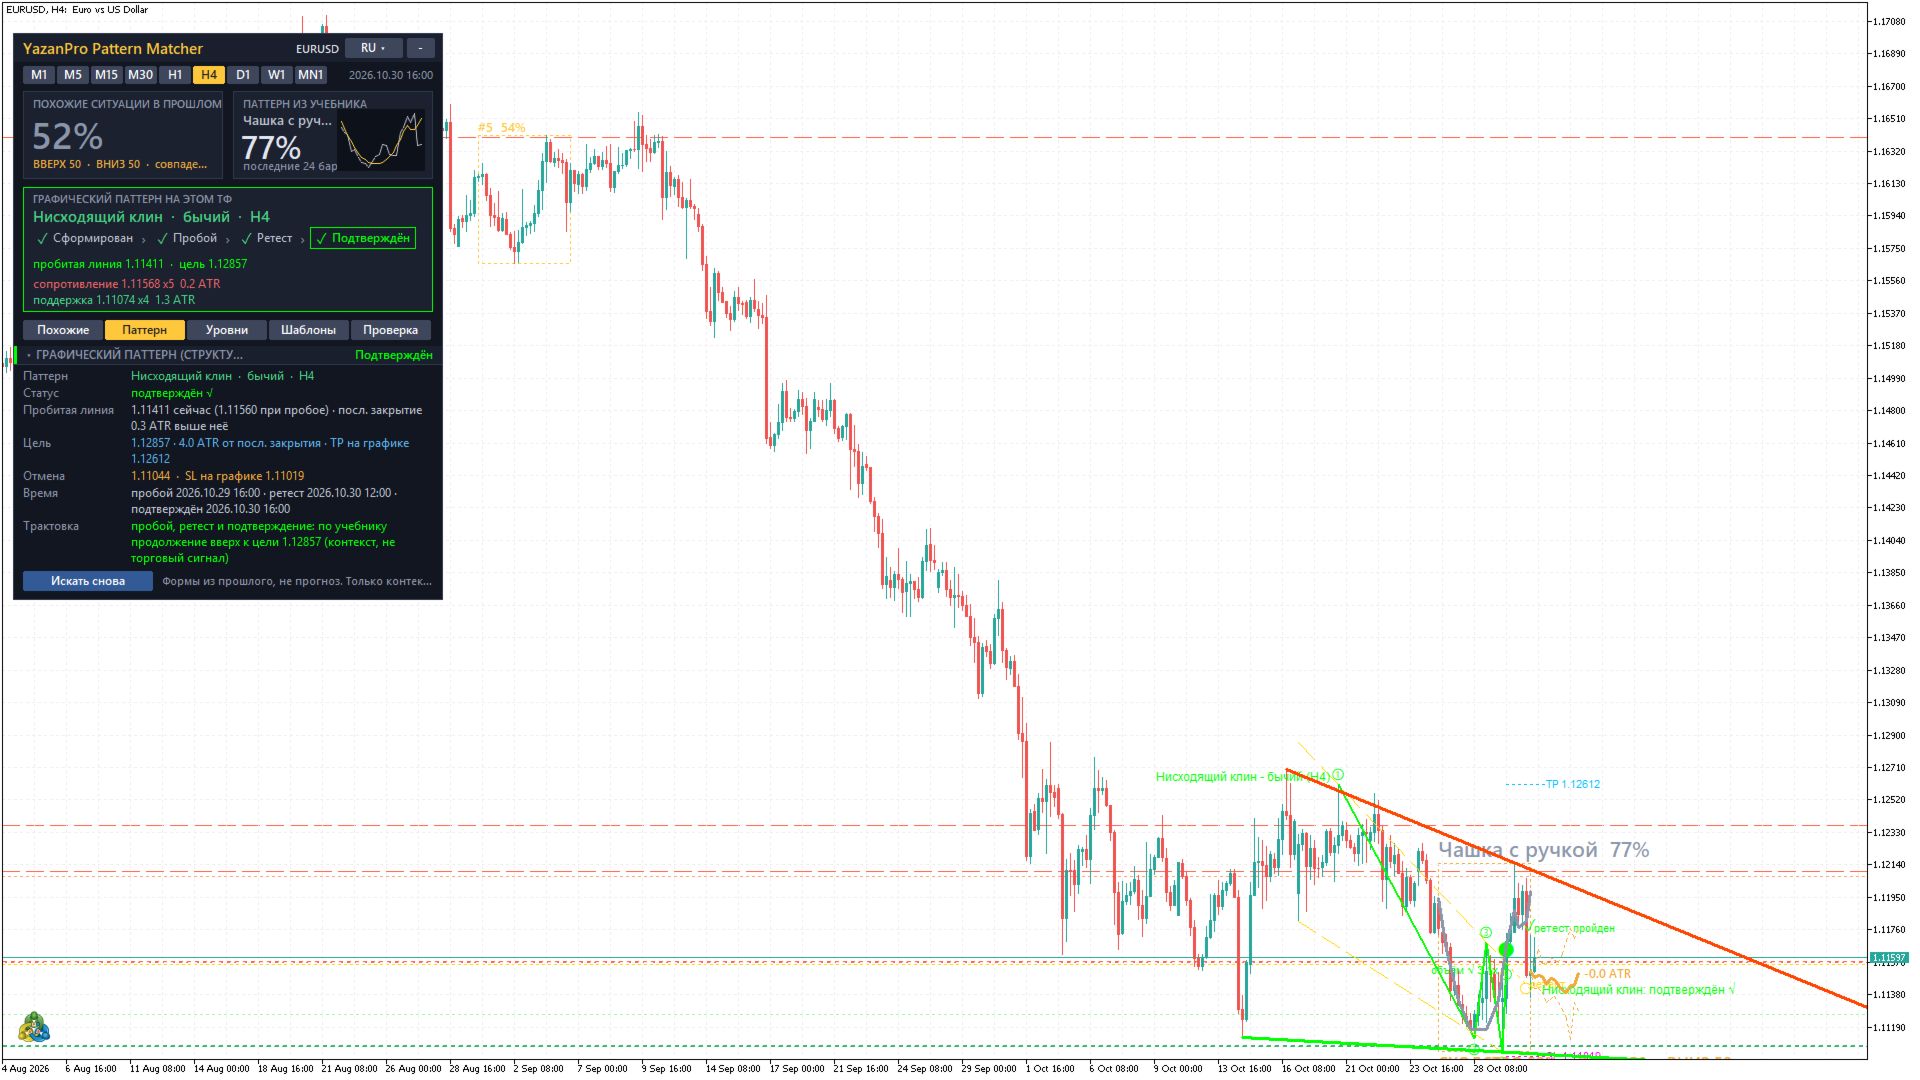
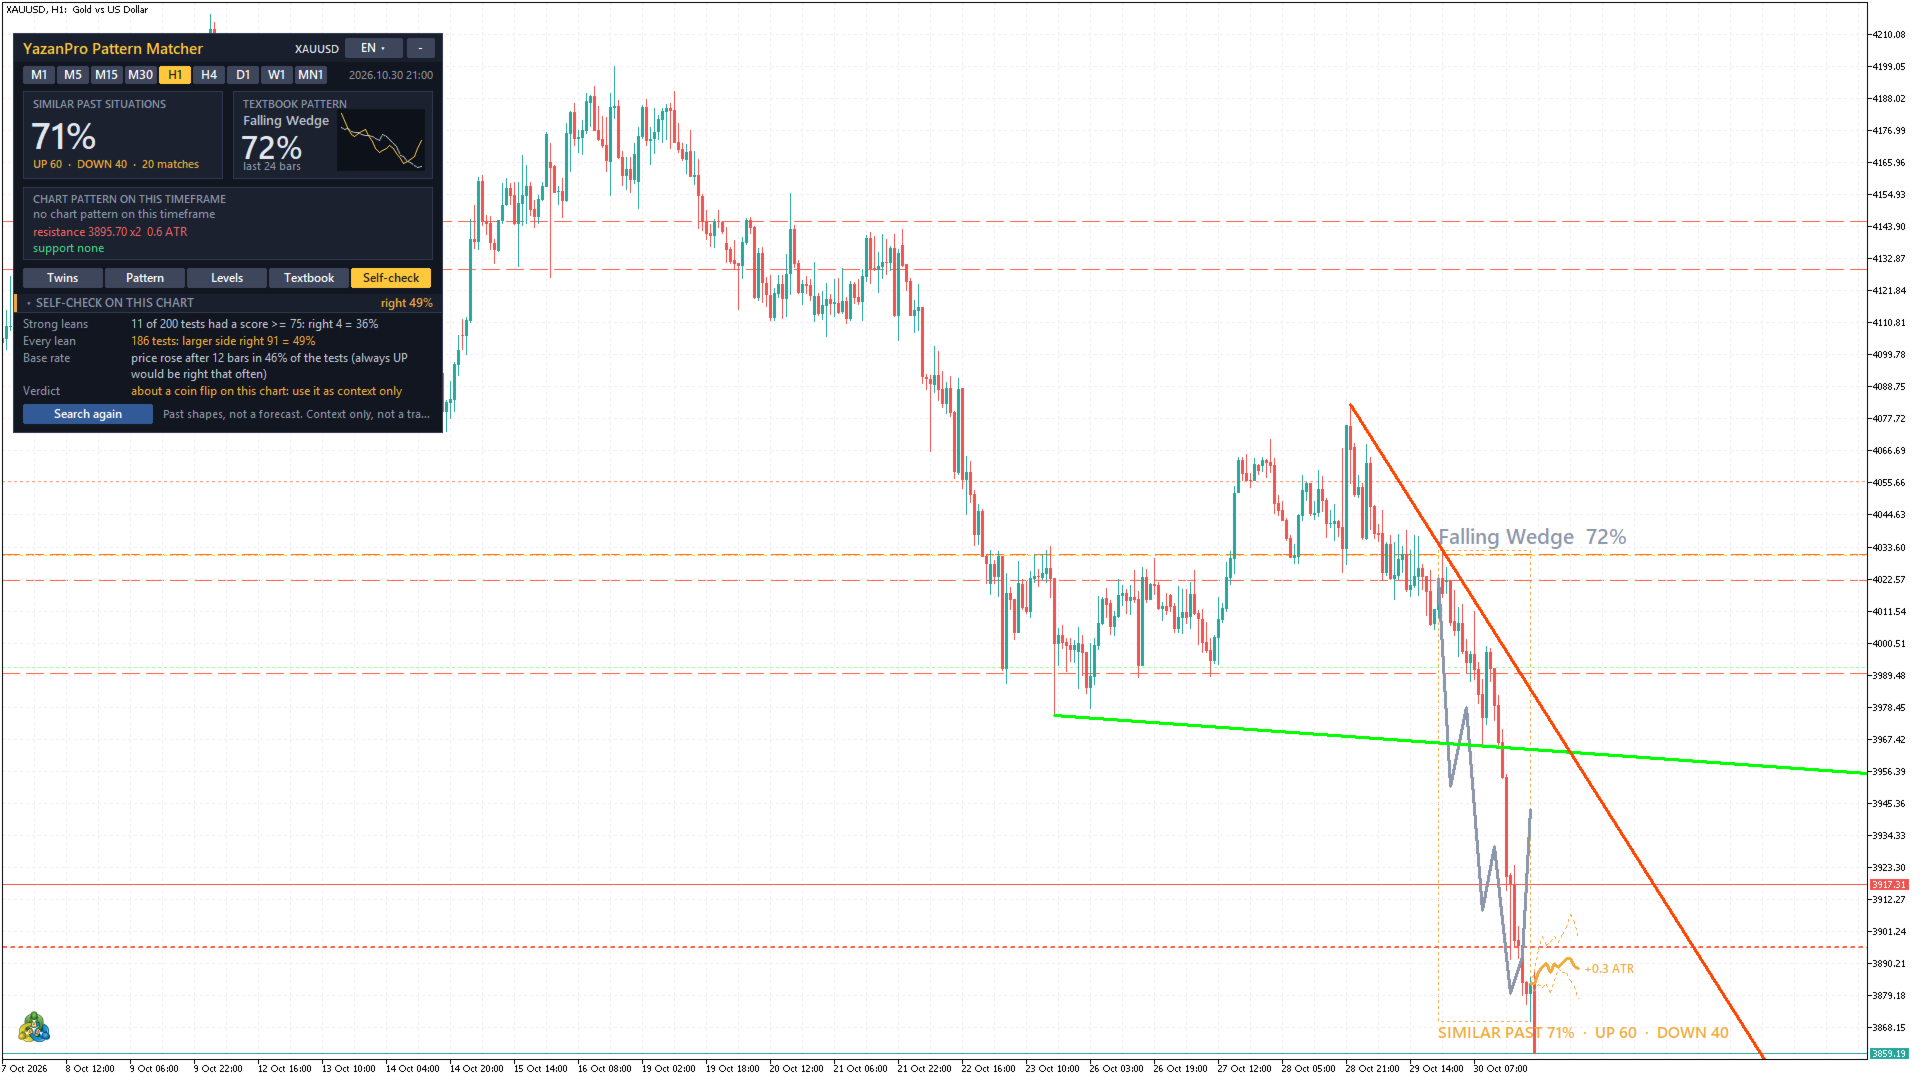
YazanPro Pattern Matcher

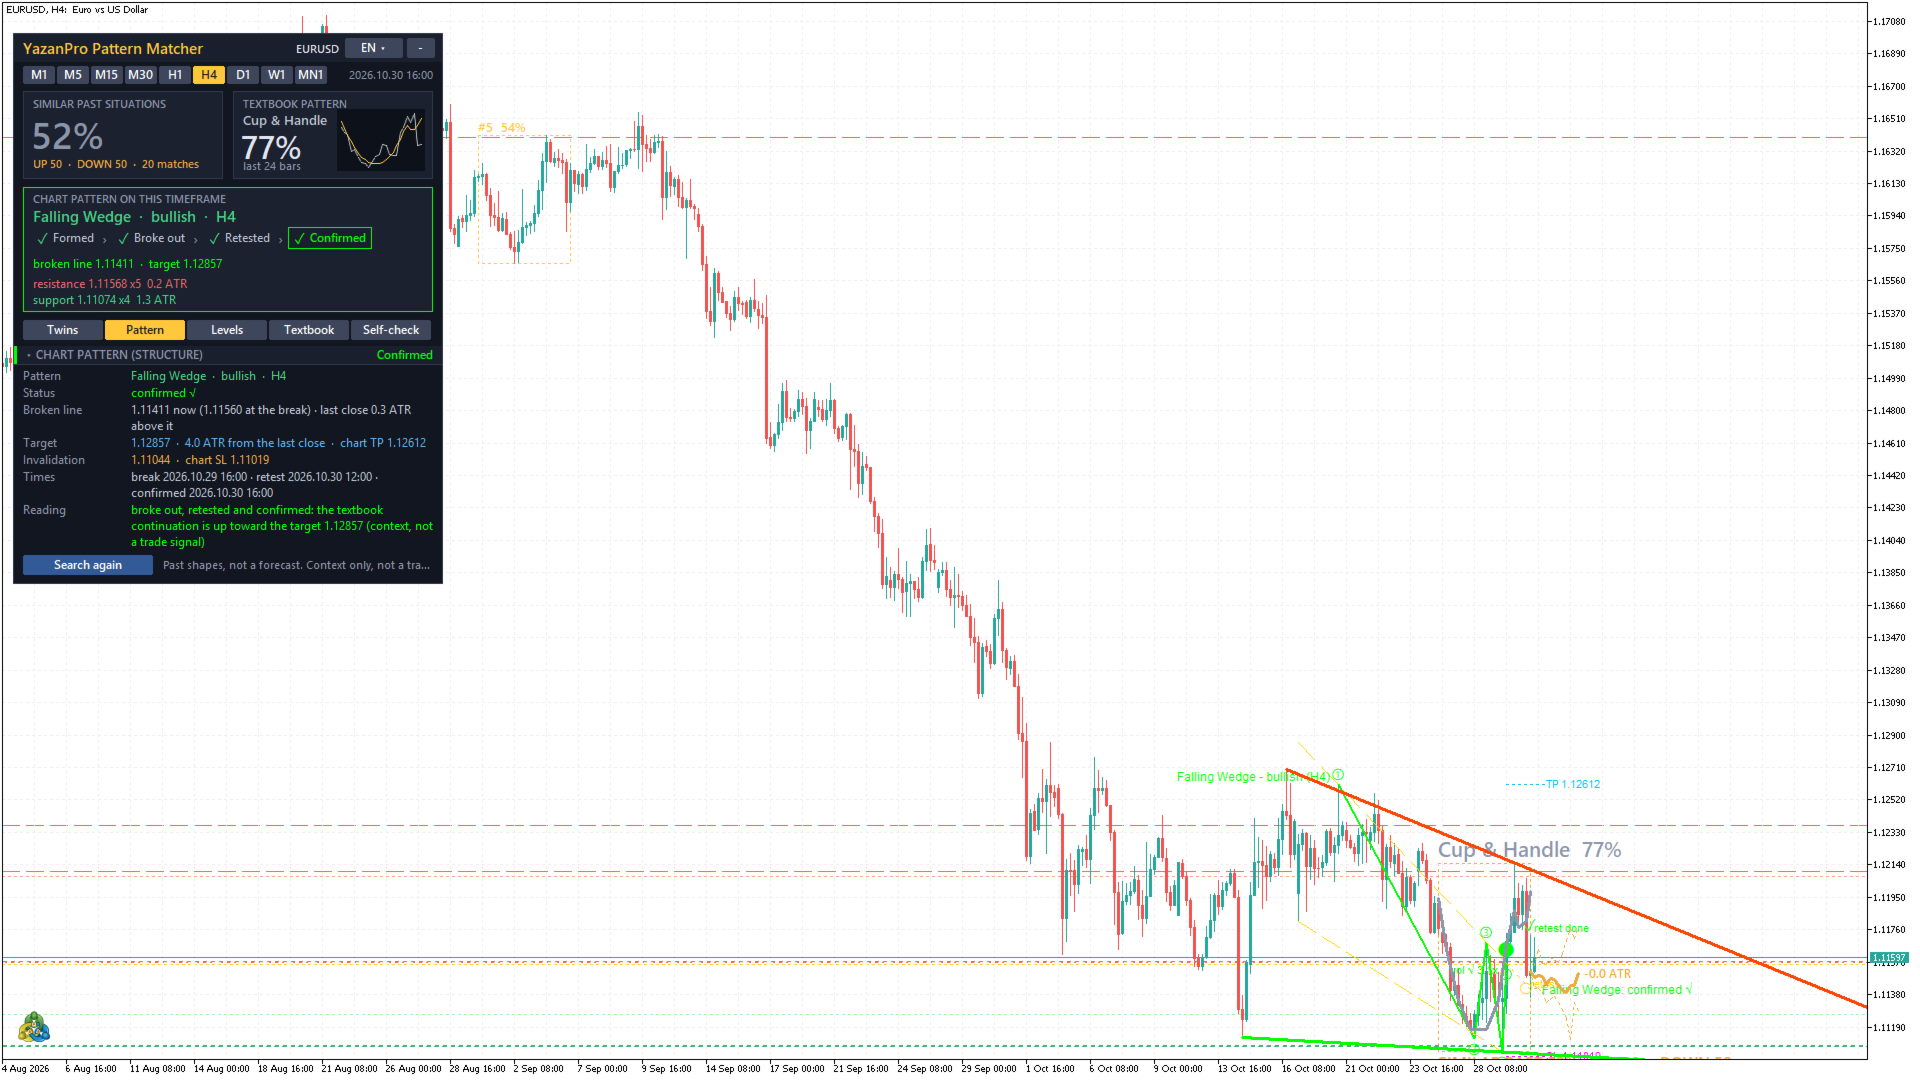
YazanPro Pattern Matcher is an indicator for MetaTrader 5. It answers three questions on any symbol and on whatever timeframe the chart shows, from M1 to MN1:

  • When did price last look like this, and what happened next?
  • Is there a chart pattern here, and has it formed, broken out, retested, been confirmed or failed?
  • Where are the nearest support and resistance levels?

It works on closed bars only, so nothing repaints. It places no orders.

Similar past situations

On every closed bar it compares the last 24 bars with every window of the chart's own last 40,000 bars. Choose how it compares them with the "Match by" input:

  • Close path: the shape of the closes.
  • Candle shapes: the body, upper wick and lower wick of each bar, bar by bar.
  • Close path + candles: both together.
  • Full situation (the default): the path and the candles, plus the context at the end of each window. The context is the trend before it, the volatility, where price sits in its recent range, the tick volume and the hour of day.

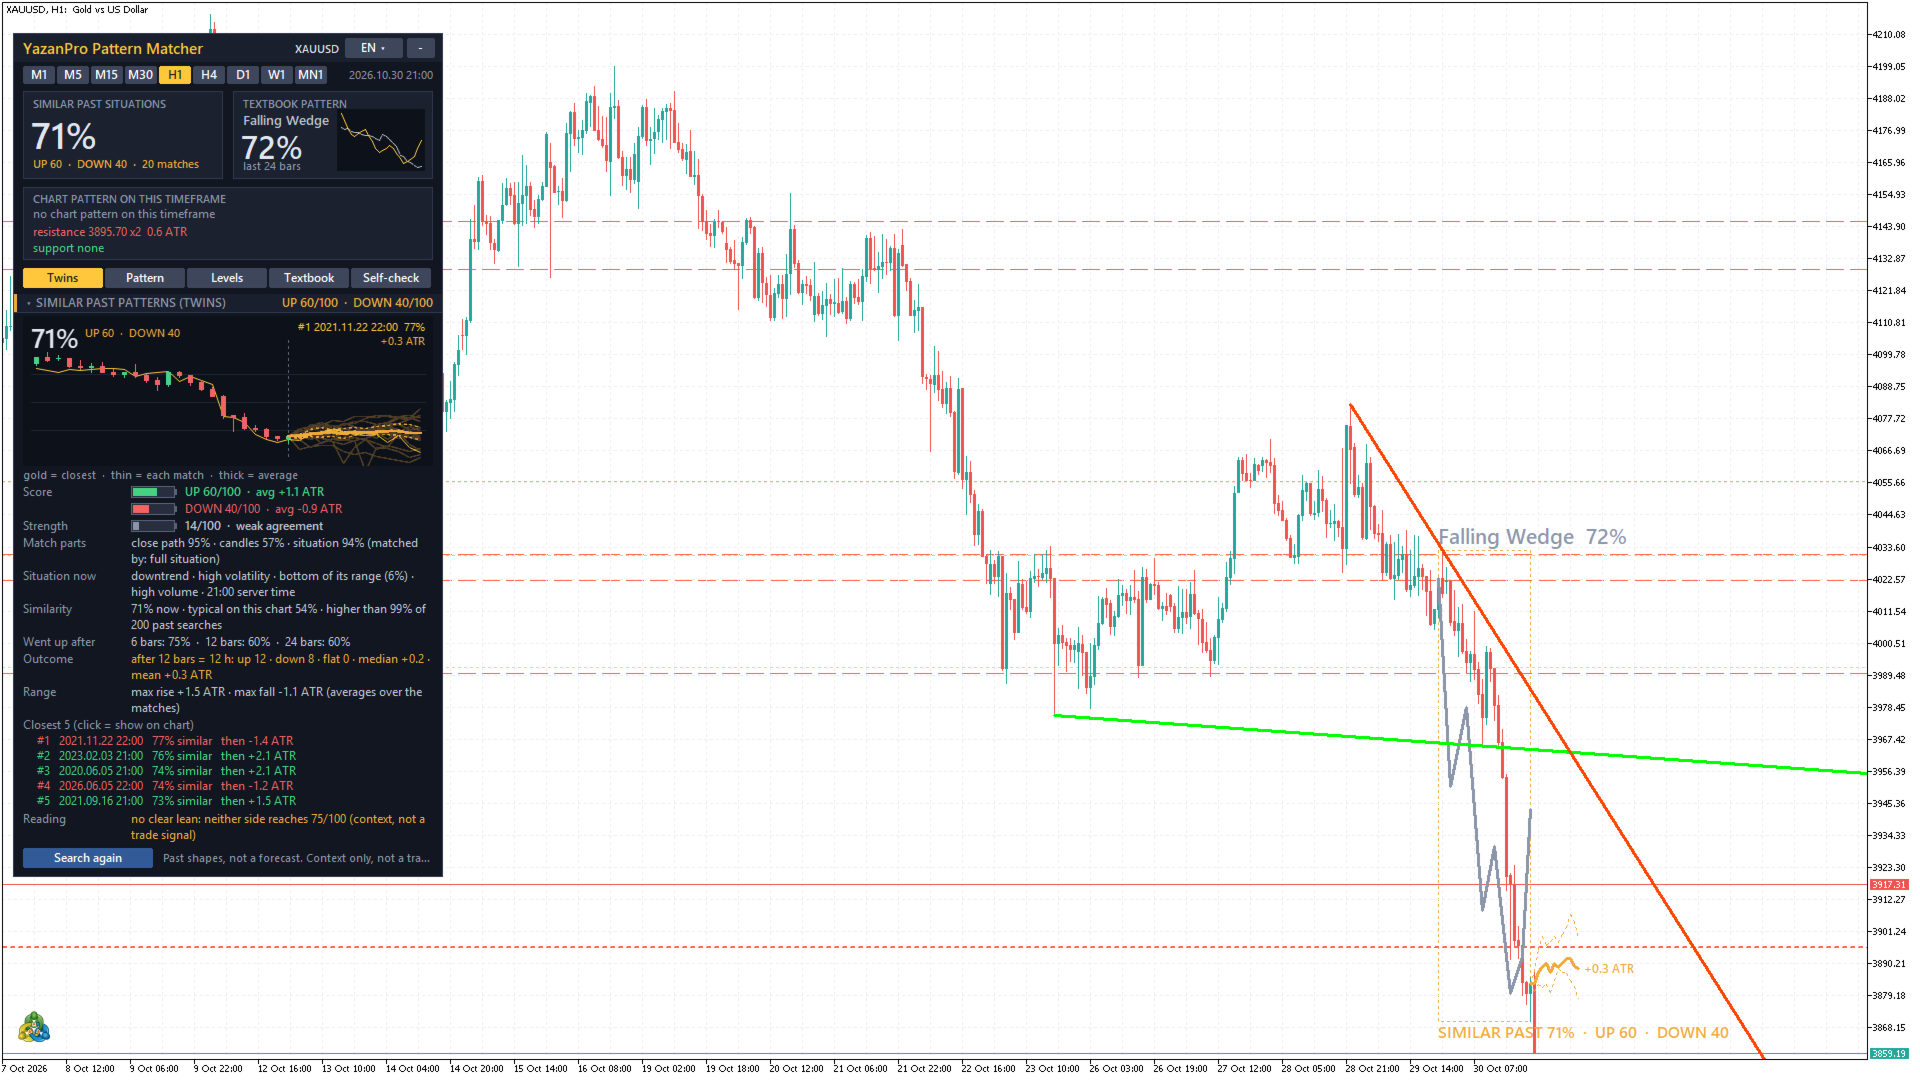
It keeps the 20 closest matches that do not overlap and shows:

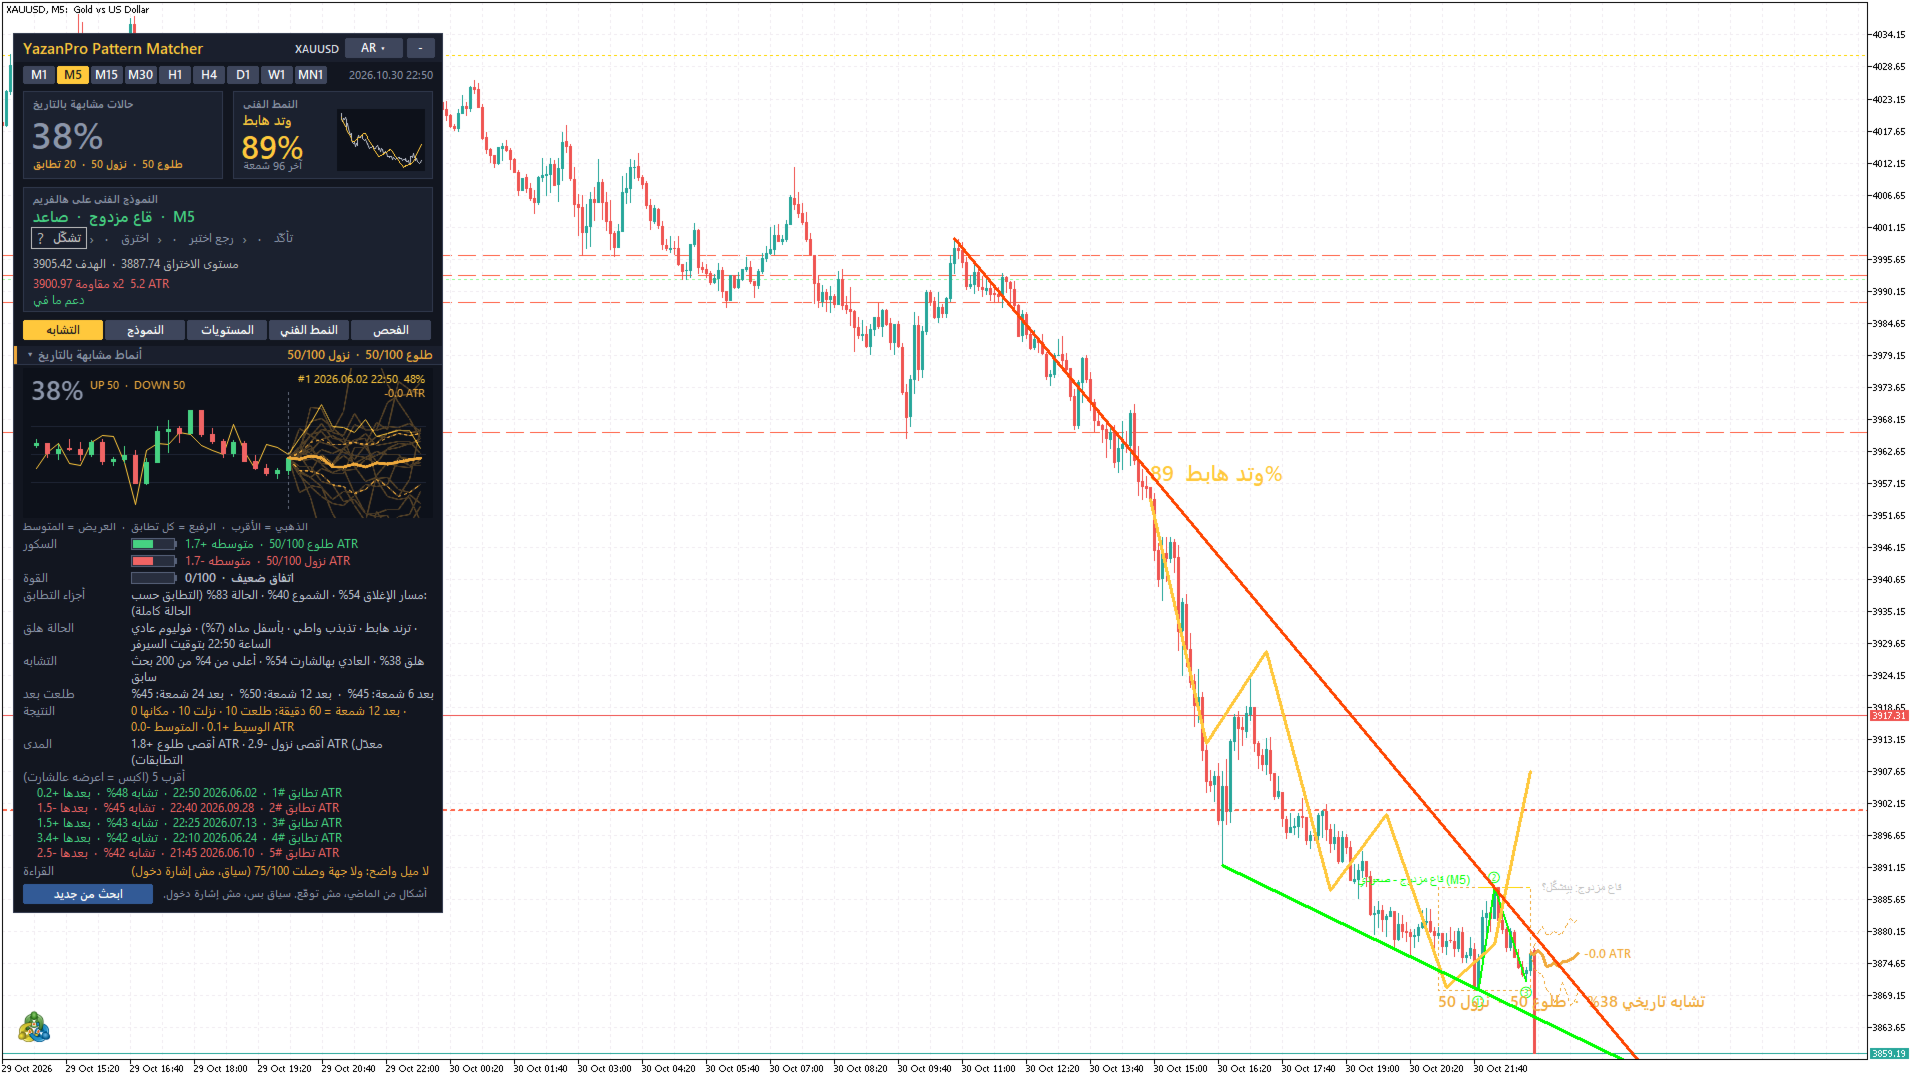
  • Similarity % in large type, with its parts: close path %, candles % and situation %.
  • The situation now in plain words, for example "downtrend · high volatility · bottom of its range (6%) · high volume · 21:00".
  • UP and DOWN scores (0 to 100) with battery bars: the similarity-weighted share of matches that ended higher or lower after 12 bars.
  • Strength (0 to 100): how close the matches are and how much they agree.
  • Went up after: the % of matches that closed higher after 6, 12 and 24 bars, plus the median and mean move and the average best and worst point (in ATR units).
  • The 5 closest matches with date, similarity and what followed. Click one to scroll the chart there.
  • A picture: the current candles, the closest match laid over them, and the paths of all matches after it with their average.
  • On the chart: a box around the current bars, the average path of the matches projected forward with the middle half dotted, and gold boxes on the 5 closest past matches.

Chart pattern status

A structural pattern detector reads swing points on the chart's timeframe. It finds:

  • double and triple tops and bottoms
  • head and shoulders and its inverse
  • ascending, descending and symmetrical triangles
  • rising and falling wedges
  • bull and bear flags
  • rectangles, channels and cup and handle

A status box shows the pattern, its direction and a step strip: Formed ✓ › Broke out ✓ › Retested ✓ › Confirmed ✓. A failed breakout shows as "Fake breakout ✗" and an old one as "Expired". The Pattern tab adds:

  • the broken line and its distance in ATR
  • the target and the invalidation level
  • the "fake if" level while it is waiting for a retest
  • the bar times of the break, the retest and the confirmation

On the chart the pattern is drawn with numbered points, the breakout, the retest and confirmation marks and target / stop guides.

Support and resistance

The nearest resistance and support are shown with their strength (how many levels merged into the zone) and their distance in ATR. The Levels tab also shows:

  • the 5 strongest zones
  • the support and resistance trendlines
  • the pivots for the timeframe
  • whether price just broke out of or bounced off a level

Only the nearest and strongest zones are drawn, so the chart stays readable.

Textbook pattern match

The last 24, 48 and 96 bars are also compared with 14 drawn textbook outlines. The best one is shown with its match % and a thumbnail, and its outline is drawn over the price. The indicator then lists every past moment on the same chart that matched that outline at least as well, and what followed. You see how that pattern actually behaved on your symbol.

Self-check on your chart

On start the indicator replays the same search on 200 past bars of your chart, each using only the bars before it. It shows:

  • how often the side with the larger score was right
  • how often price simply rose, so you can compare the two
  • how usual today's similarity is on that chart

So you see, for your own symbol and timeframe, how much the reading is worth.

Panel and languages

  • Header: a language button with 12 panel languages: English, Arabic, Russian, Chinese, Spanish, Portuguese, Japanese, German, Korean, French, Italian and Turkish.
  • Timeframe buttons: M1 to MN1, to switch the chart.
  • Tabs: Twins, Pattern, Levels, Textbook and Self-check.
  • Fold button: shrinks the panel to its tiles and the pattern status.
  • Alerts: pop-up and push notifications, once per bar, for a strong match or a textbook pattern match of 90% or more.

Please read this first

This is a context tool, not a trading system. In the developer's tests, similar past situations were followed by rises and falls about equally often. That was true even when candles, trend, volatility and volume were matched too, and trading every strong match did not beat a random entry after costs (Section 3). The self-check shows the same kind of number for your own chart. Use the indicator to see what similar situations, patterns and levels looked like, never as an entry signal on its own.

3. What the tests found

Every test replays the search with only the data that was available at each bar. Spreads are the recorded values. An extra cost was added where stated.

Does history repeat? (8 markets: EURUSD, GBPUSD, USDJPY, XAUUSD, USDCAD and US500 on H1, plus EURUSD and XAUUSD on M15)

All four "Match by" modes were tested on the direction 12 bars later. The best mode was chosen on the older data, then run once on 2024-2026 data it had never seen.

Match by | Side right | Always the main direction

Close path | 50.5% | 52.3%

Candle shapes | 50.2% | 52.2%

Close path + candles | 50.6% | 52.3%

Full situation | 51.2% | 52.7%

  • The "always the main direction" column uses each period's main direction, known afterwards. Against a plain 50% coin, only the full situation was slightly better (+1.2 points).
  • An independent re-implementation of the whole test gave the same matches and numbers.

Trading every strong match (larger score 75 or more), H1, the same 6 markets

The rule: stop loss 1.5 x ATR(14), take profit 1.3 x the stop, break-even, recorded spread plus an extra cost per round trip.

  • 2024-2026: 328 trades, profit factor 0.98, about zero per trade.
  • A random side on the same entries did the same.

Trading every match of 90% or more on EURUSD (close path mode)

  • H1, 2017-2026: 14,222 trades, profit factor 0.97.
  • M5, 2026: 14,472 trades, profit factor 0.33 (stop 0.8 x ATR, target 1.2 x the stop, 30-minute exit).

Inputs

Search

  • Match by: Full situation (Close path only / Candle shapes only / Close path + candle shapes / Full situation)
  • Pattern length, bars (10..120): 24
  • Bars after a match read as its outcome (1..48): 12
  • Closest matches kept (5..50): 20
  • History bars searched (1000..200000): 40000. The chart must have this many bars, or the indicator uses what it has. Raise "Max bars in chart" under Tools > Options > Charts for more.
  • Also match textbook chart patterns: true
  • Textbook pattern: past cases need a match >= this %: 80
  • Self-check: replay the search on past bars of this chart: true
  • Self-check: number of past tests (50..500): 200

Display

  • Tab shown first: Similar past situations
  • Panel language: English (12 languages; also switchable on the panel)
  • Panel X / Y, pixels from the top-left corner: 10 / 30
  • Draw on the chart (window box, expected path, pattern outline): true
  • Mark the 5 closest past matches on the chart: true

Alerts

  • Alert on a strong match (once per bar): true
  • ... similarity >= this %: 85
  • ... and the UP or DOWN score >= this: 75
  • ... and the median move >= this (x ATR): 0.3
  • Alert when a textbook pattern match >= this % (0 = off): 90
  • Also send a push notification: false

Chart patterns and levels

  • Chart patterns (stage, levels, drawing): true
  • Support / resistance levels: true

Quick start

  • Attach the indicator to any chart and any timeframe. It works on forex, metals, indices, stocks and crypto.
  • Pick your language with the button at the top right.
  • Read the two large tiles and the pattern status box first. Then open the tabs: Twins, Pattern, Levels, Textbook, Self-check.
  • Use the timeframe buttons to look at the same symbol on another timeframe.
  • Rest the mouse on any row for an explanation.

FAQ

Does it repaint?

No. It uses closed bars only, and each search sees only the bars before it.

Does it trade or give buy / sell signals?

No. It places no orders and has no buffers. Section 3 shows that the direction of similar past situations did not predict the next move.

Which timeframes?

Any timeframe from M1 to MN1. Everything is computed on the chart's own timeframe. On MN1 or short histories some parts may say "not enough history".

Is it heavy for the terminal?

One search takes a few milliseconds per new bar. The self-check runs in small steps in the background.

Trading carries a high risk of loss. This indicator does not predict prices and does not guarantee any result. The numbers above are past tests on the developer's broker data and may differ on yours.
Recommended products
Session Liquidity Pro — institutional-grade session mapping for MetaTrader 5, by DEFPARAM Labs. WHAT IT DOES • Draws Asian, London and New York session ranges as shaded boxes with High, Low and 50% Equilibrium levels (optionally extended to the right) • Builds a custom Opening Range (ORB) box with user-defined start time and duration • Detects confirmed liquidity sweeps (stop hunts): when price takes out a completed session high/low and closes back inside, an arrow prints on the closed bar • L
ATR Line
Evgeny Levchenko
The indicator - "ATR Line" determines the current trend and gives signals to buy (green arrow to the top) or sell (red arrow to the bottom). The indicator calculation is based on the deviation of the average price of the instrument from its average true range - ATR. The moving average of prices is used to reduce "market noise". If the main line of the indicator - "ATR Line" is lower the instrument price chart, then the market is in a "bullish" trend. If the main line of the indicator is higher t
Radar Trade Analytic
Jeverson Rodrigues Ferreira
Radar Trade Analytic 2.0 – Quantitative Panel for MT5 What is Radar Trade Analytic? Radar Trade Analytic is the quantitative module of the Radar Trade Ecosystem. It opens in a separate window below the main chart and displays four synchronized layers , all built with the same proprietary Sigma engine, ensuring a direct correspondence between what you see on the chart and what you read in the panel. No buy or sell signals. No targets. No alerts. Radar Trade Analytic organizes the data tha
RangeZone  Indicator General Overview: Global Exchange Trading from East to West World financial markets operate on the principle of continuous trading sessions, where activity moves with the sun from one financial center to another. Understanding this dynamic is key to successful trading! How Trading Moves Around the World: Asian Session   (Sydney, Tokyo): Opens first, sets the tone for daily volatility Japanese yen, Australian dollar, Asian indices Often forms key support/resistance level
This indicator is based on a classic Moving Average indicator. Moving averages help us to first define the trend and second, to recognize changes in the trend. Multi TimeFrame indicator MTF-MA shows MA data from the 4 timeframes by your choice. By default this indicator has external parameters: TF1 = 1; TimeFrame2b = true; TF2 = 5; TimeFrame3b = true; TF3 = 15; TimeFrame4b = true; TF4 = 60; InpPSARStep = 0.02; InpPSARMaximum = 0.2; You can change TF1-TF4 in the next limits: TF1 from M1 (1) to H4
"Scalper Channel MT5" is a modern channel indicator that shows the trader the direction of the trade. For work, the indicator uses built-in and proprietary technical means and a new secret formula. Load it on the chart and the indicator will show you the entry direction in color: If the upper limit of the price channel of the indicator is blue, open a buy position. If the lower limit of the price channel of the indicator is red, open a sell position. If the border of the indicator is gray, neut
Advanced Trading Chaos  The main purpose of the indicator is to help the trader detect the signals described by Bill Williams in his books to make a quick and correct trading decision. 1)Bullish/Bearish Reversal Bar(BDB) 2) Divergent Bar(DB) 3) Second Sage Signal — the third consecutive Awesome Oscillator bar  4) Working fractals (Fractals that worked above/below the red forehead  5) Three bar coloring modes 5.1) Coloring of bars according to the AO indicator (Including the squatting bar) 5.2
Heiken_Ashi_Bars - Advanced Trend Visualizer for MT5 Overview Heiken_Ashi_Bars is a powerful, visually intuitive custom indicator designed to filter out market noise and highlight the true underlying trend. Traditional candlestick charts can often be erratic, leading to false signals and premature exits. By averaging the price data, this indicator smooths out price action, making it significantly easier to spot trend continuations, reversals, and profitable entry zones. Whether you are a scalper
HAS RSI Signal — Professional Trend Indicator with SL/TP Calculation HAS RSI Signal is a powerful trading tool that combines time-tested classics with modern noise-filtering algorithms. The indicator analyzes the market through the prism of Heiken Ashi Smoothed candles and the RSI oscillator, providing clear entry signals at trend reversals or when exiting overbought/oversold zones. Key Advantages: Double Filtration: Using Heiken Ashi Smoothed eliminates market "noise," while RSI confirms the mo
PatternDetector
Thien Thanh Tran
PatternScope — Multi-Pattern Recognition for MT5 PatternScope is a multi-pattern recognition indicator for MetaTrader 5. It scans price action for classic chart patterns, confirms breakouts, and draws clear   Entry, Stop Loss and Take Profit   levels. A compact dashboard shows the latest pattern, bias and Risk:Reward. Patterns:   Double Top/Bottom, Triple Top/Bottom, Head and Shoulders (and inverted), Bullish & Bearish Flag, Pennant, Rising & Falling Wedge, Triangle, Rectangle, Cup and Handle —
Fabii Half Trend Baseline
Fabien Georges Andre Guillemaud
Stop trading against the higher timeframe trend. Two baselines, one chart. No repaint. Any pair, any timeframe. On your chart in 2 minutes. Free demo in the Strategy Tester. Get more indicators here Baselines, volatility filters and oscillators. No repaint. Why you need it You enter a trade because a line turned green on your chart. Then you open a higher timeframe and see that the bigger trend points the other way. The signal was real. The trend behind it was not on your side. Every trade ta

Support Becomes Resistance SR Flip Mhw
Muhammad Amir Azri Bin Samani
5 (1)
Support Becomes Resistance SR Flip Mhw automatically draws Buy and Sell zones on your chart. An SR Flip zone is a price area where old resistance has been broken and now acts as support, or old support has been broken and now acts as resistance. Price often comes back to retest these areas before it continues. This indicator does not give signals or entry alerts. You can combine it with your own techniques to make your analysis stronger. This is the free version. If you want the full version, wh
FREE
The indicator detects divergence signals - the divergences between the price peaks and the MACD oscillator values. The signals are displayed as arrows in the additional window and are maintained by the messages in a pop-up window, e-mails and push-notifications. The conditions which formed the signal are displayed by lines on the chart and in the indicator window. The indicator parameters MacdFast - fast MACD line period MacdSlow - slow MACD line period MacdSignal - MACD signal line period Macd
The Average Directional Index(ADX) Multicurrency Scanner MT5 is an advanced trading indicator designed to analyze multiple currency pairs simultaneously. It benefits traders looking to enhance their decision-making process by providing real-time signals based on the Average Directional Index, allowing for efficient market trend analysis. This tool streamlines the trading experience by simplifying the identification of trend strength and directional movement, making it an essential asset for trad
Kecia Market Manager
Niccolo Filippo Palombi
The Kecia Market Manager is an advanced MT5 indicator that transforms multi-asset correlation analysis into actionable trading intelligence. By employing 6 sophisticated statistical frameworks and professional-grade visualizations, this tool reveals hidden market relationships, pair trading opportunities, and portfolio hedging strategies across unlimited currency pairs in real-time. Key Features: Multi-Metric Analysis Engine : Pearson correlation coefficient with rolling windows Cointegration te
RBreaker
Zhong Long Wu
RBreaker Gold Indicators is a short-term intraday trading strategy for gold futures that combines trend following and intraday reversal approaches. It not only captures profits during trending markets but also enables timely profit-taking and counter-trend trading during market reversals. This strategy has been ranked among the top ten most profitable trading strategies by the American magazine   Futures Truth   for 15 consecutive years. It boasts a long lifecycle and remains widely used and st
Five Patterns Momentum – Advanced Wave & Momentum Indicator (MT5) Five Patterns Momentum is an advanced technical indicator for MetaTrader 5 , based on the M & W wave pattern theory developed by Arthur A. Merrill . It combines market structure , wave analysis , and momentum statistics to help traders identify high-probability continuation and reversal zones with precision. How It Works The indicator uses a dynamic ZigZag algorithm to automatically detect key market structure points ( A, B,
Smart ATR Grid Pro
Syamsurizal Dimjati
SMART ATR GRID PRO++ – Adaptive Grid Intelligence Suite is a next-generation, institutional-grade grid trading indicator engineered for traders who demand precision, adaptability, and comprehensive market structure analysis. By seamlessly integrating   Adaptive Volatility Grid System ,   KAMA Candle Trend Filtering ,   Multi-Factor Trend Detection (ADX + EMA20/50) ,   Dynamic Heatmap Zone Engine , and   Real-Time Market Regime Classification , this indicator delivers a complete decision-making
Caicai L&S Yield Histogram Important Notice: This indicator is an integral tool of the automated EA Caicai Long and Short Pair Trading . This indicator visually displays the percentage deviation (Yield %) of a pair's current spread relative to its own historical mean. It is an excellent tool for quickly visualizing the gross financial potential of a market distortion in Long & Short operations. Main Features: Percentage Visualization: Understand the size of the distortion in palpable percentage
Royal Aurum Confluence is a MetaTrader 5 indicator built for traders who are tired of guessing where to enter, where to get out, and how far a gold move can actually go. Launch price: $49 . The price will increase by $10 after every 20 purchases until it reaches the final price of $199 . Next price: $59 . Royal Aurum Companion is included at no additional cost. It is a manual execution and position-management companion tool designed to work alongside Royal Aurum Confluence. After purchase, pleas
RFX Market Speed MT5
Rasoul Mojtahedzadeh
RFX Market Speed is an indicator designed to measure a new dimension of the market which has been hidden from the most traders. The indicator measures the speed of the market in terms of points per seconds and shows the measurement graphically on the chart, and saves the maximum bullish and bearish speeds per each bar. This indicator is specially designed to help the scalpers of any market with their decisions about the short bias of the market. The indicator uses real-ticks and cannot be fully
Crypto_Forex Indicator "Hanging Man and Inverted Hammer pattern" for MT5, No repaint, No delay. - Indicator "Hanging Man and Inverted Hammer pattern" is very powerful indicator for Price Action trading. - Indicator detects bullish Inverted_Hammer and bearish Hanging_Man patterns on chart: - Bullish Inverted_Hammer - Blue arrow signal on chart (see pictures). - Bearish Hanging_Man - Red arrow signal on chart (see pictures). - With PC alerts and Mobile notification. - With 4 different styles for s
BTC Trend Scalper MT5 Trend Capture Edition — Precision Momentum Trading for BTCUSD Hello, traders! I am BTC Trend Scalper MT5 — an intelligent Bitcoin trading Expert Advisor engineered to capture momentum moves with disciplined risk management. I am not a martingale. I am not a grid system. I am not a gambling robot. I am a trend-following scalper built specifically for traders who understand that protecting capital is more important than chasing every candle. My specialty? Bitcoin (BTCUSD)
Bitcoin Dynamics Pro
Kabelo Frans Mampa
Bitcoin Dynamics Pro A regression-based trend structure system for BTCUSD Overview Bitcoin Dynamics Pro reads Bitcoin's price action the way a technical analyst would, by mapping out trend structure across recent, mid-term, and longer price ranges, then measuring where price sits relative to that structure before entering a trade. Instead of reacting to a single moving average cross or oscillator signal, the EA builds a picture of the trend using regression-based trendlines drawn across highs,
Divergence Scanner MT5 is a scanner indicator for MetaTrader 5. One panel shows the latest RSI, MACD, Stochastic, CCI and OBV divergence on many symbols and timeframes. It shows how long ago each was confirmed and how many oscillators agree, and it sends an alert when a new one appears. It runs the same divergence engine as the free Divergence Signal Alerts indicator, for a whole list of charts at once. It adds three more oscillators and a count of how many agree. It places no orders. Cells use
Auto Optimized RSI   is a smart and easy-to-use arrow indicator designed for precision trading. It automatically finds the most effective RSI Buy and Sell levels for your selected symbol and timeframe using real historical data simulations. The indicator can be used as a standalone system or as part of your existing trading strategy. It is especially useful for intraday trading. Unlike traditional RSI indicators that rely on fixed 70/30 levels,   Auto Optimized RSI   dynamically adjusts its lev
Structure King AI Signal Structure King AI Signal is a professional MetaTrader 5 trading indicator designed to help traders analyze market structure, trend direction, multi-timeframe confirmation and trade management from one clean dashboard. Key Features • Market Structure & Trend Analysis • BUY / SELL Signals • Multi-Timeframe (HTF) Confirmation • Entry Price Levels • Dynamic Stop Loss (SL) • TP1 / TP2 / TP3 Levels • ATR Volatility Analysis • ADX Trend Strength Filter • Adaptive Market Filter
This indicator draws supply and demand zones on the chart. Combined with your own rules and techniques, this indicator will allow you to create (or enhance) your own powerful system. Please also check out the paid version which offers much more. My recommendation is to look for trading opportunities where the first zone test occurs after at least 25 bars. Features The zones have 3 colors (adjustable by input). Dark color for untested zone, medium for tested zone and light for broken zone . The p
FREE
PROMETHEUS TECHNICAN VERSION Free | By THE SONS A gift from The Sons — no strings, no trial, no expiry. Every trader deserves access to professional-grade market intelligence. That belief is why Prometheus Technical Version exists, and why it costs nothing. Consider it our handshake to the trading community. What You're Getting This is not a simplified tool dressed up as a gift. Prometheus Technican Version is a fully built, institutional-quality technical analysis indicator running a dual-model
FREE
Clever Parabolic RSI A smart oscillator combining Parabolic SAR and RSI for precise market signals This oscillator merges the power of Parabolic SAR and RSI , creating an intelligent system that clearly shows market conditions , trend strength , and provides reliable buy/sell signals . How it works: A green square dot indicates the beginning of a bullish trend A red square dot signals the start of a bearish trend After the first signal, the oscillator plots three more dots in the
Buyers of this product also purchase
Trend Sniper X
Sarvarbek Abduvoxobov
4.86 (43)
Trend Sniper X is a multi-timeframe trend-following indicator for MetaTrader 5 that helps traders identify trend direction and potential reversal points with clarity and precision. for MT4: https://www.mql5.com/en/market/product/193245 Price Information: The current price is promotional and is subject to change as upcoming updates and new features are released. Bonus Offer: To get the FREE Auto-Trade Assistant EA for this indicator, please message the author after purchasing. Code2Profit Channe
In 2019 I showed the whole world what this indicator can do. I traded its signals by hand, on a real account, in the open — the account was monitored live on Myfxbook, and I covered my experiment in detail on Facebook. The result: $10,000 became $941,411 in four months. The risk was deliberately extreme — the drawdown reached 54%, because in our profession profit and risk always go hand in hand. The Myfxbook screenshot is the first picture in the gallery. Looks like congratulations are in order:
ULTRA is a technical indicator that operates on an “all-in-one” basis—it independently analyzes the market, generates trading signals, displays levels for setting stop-loss orders, and suggests when to close trades to lock in profits or minimize losses. In other words, it doesn't matter if you don't know how to analyze the market, determine levels—where to set your stop-loss—or struggle with money management. ULTRA will do all of that for you! BUYER BONUS: After purchasing the ULTRA indicator, s
Gann Made Easy   is a professional and easy to use Forex trading system which is based on the best principles of trading using the theory of W.D. Gann. The indicator provides accurate BUY and SELL signals including Stop Loss and Take Profit levels. You can trade even on the go using PUSH notifications. PLEASE CONTACT ME AFTER PURCHASE TO GET TRADING  INSTRUCTIONS   AND GREAT EXTRA INDICATORS  FOR FREE! Probably you already heard about the Gann trading methods before. Usually the Gann theory is a
M1 Sniper MT5
Oleg Rodin
5 (7)
M1 SNIPER  is an easy to use trading indicator system. It is an arrow indicator which is designed for M1 time frame. The indicator can be used as a standalone system for scalping on M1 time frame and it can be used as a part of your existing trading system. Though this trading system was designed specifically for short-term trading, it still can be helpful for all traders. This trading system can be used with any forex pair and time frame, though lower time frames are recommended from M1 up to M
Auto Optimized SpeedAngle is an institutional-grade momentum vectoring system that eliminates curve-fitting through continuous Walk-Forward Optimization (WFO). Rather than relying on static inputs that degrade when market regimes shift, the indicator dynamically recalibrates its parameters using Out-of-Sample (OOS) validation, ensuring the displayed signals represent genuine statistical edges rather than historical anomalies. By shifting the focus from subjective visual angles to normalized, qua
Boba Analysis Suite
Trade Ready Solutions LLC
5 (2)
Boba Analysis Suite Boba Analysis Suite is an analytical indicator for MetaTrader 5. It brings market structure, relevant price zones and broader market context together in a single chart view. Developed through practical experience as a trader and trading coach, it supports a structured analysis process: assessing market direction, identifying important levels and considering multiple timeframes together. Analysis in Context Individual signals gain meaning through context. Boba Analysis Suite h
Multi Currency Strength and Momentum Indicator MT5 Dynamic Forex28 Navigator is the evolution of our long-time, popular indicators, combining the power of three into one: Advanced Currency Strength28 Indicator (700 reviews) Advanced Currency IMPULSE with ALERT (530 reviews) CS28 Combo Signals (recent Bonus) The two predecessor indicators together have received more than 1,200 reviews on the MQL5 Market and have been a staple in the MT4 community since 2016. Dynamic Forex28 Navigator MT5 carries
Zain Gold Scalping
Ahmed Gamal Abdel Nasser Mohamed
A complete price-action analysis tool built around dual independent entry logic, each confirmed against a volatility band, combined with a configurable set of nine optional confirmation filters that let you shape exactly how conservative or aggressive the tool's signals behave. Core Strategy Two independent entry setups, each triggering only when price moves outside a dynamic volatility band — giving two distinct ways to spot potential reversal points, which can be used together or separately.
Quantum TrendPulse
Bogdan Ion Puscasu
5 (26)
Introducing Quantum TrendPulse , the ultimate trading tool that combines the power of SuperTrend , RSI , and Stochastic into one comprehensive indicator to maximize your trading potential. Designed for traders who seek precision and efficiency, this indicator helps you identify market trends, momentum shifts, and optimal entry and exit points with confidence. Key Features: SuperTrend Integration: Easily follow the prevailing market trend and ride the wave of profitability. RSI Precision: Detect
Adaptive Price Action Engine Buy Indicator- Get EA Based on it for FREE. Self-Optimizing Multi-Timeframe Trend & Candlestick Intelligence Markets do not behave the same way all the time—and not every price-action pattern has the same value in every market regime. Adaptive Price Action Engine is designed to adapt to changing market conditions by combining trend structure, multi-timeframe analysis, candlestick patterns, and statistical optimization into one analytical framework. Two Adaptive Mode
Superhero
Ihor Otkydach
5 (3)
The SUPERHERO indicator is a multi-currency trading system designed on an "all-inclusive" basis. The indicator independently analyzes the market and provides signals on when to open and close trades. It uses Stop Loss and Take Profit orders. The R:R ratio is 1:1. This system can send push notifications to your smartphone, so you can place trades "on the go" without needing to be tied to a PC. It's perfect for proprietary trading firms. A BONUS FOR EVERY CUSTOMER: Every buyer of this indicator wi
Neuro Poseidon MT5
Daria Rezueva
4.75 (52)
Neuro Poseidon is a new indicator by Daria Rezueva. It combines precise trading signals with adaptive TP/SL levels - creating best possible trades as a result! Message me and get  Neuro Poseidon Assistant  as a gift to automize your trading process! What makes it stand out? 1. Proven profitability on all assets and timeframes 2. Only confirmed BUY and SELL signals present on the chart 3. Adaptive TP & SL levels generated by the software for each trade 4. Easy to understand - suitable for al
Azimuth Pro
Ottaviano De Cicco
5 (7)
Azimuth Pro V2: Synthetic Fractal Structure and Confirmed Entries for MT5 Overview Azimuth Pro is a multi-level swing structure indicator by Merkava Labs . Four nested swing layers, swing-anchored VWAP, ABC pattern detection, three-timeframe structural filtering, and closed-bar confirmed entries — one chart, one workflow from micro-swings to macro-cycles. This is not a blind signal product. It is a structure-first workflow for traders who care about location, context, and timing. Halloween P
OrderFlux – Orderflow Footprint Chart, Volume Profile & Market Profile Indicator for MetaTrader 5 OrderFlux is an order flow footprint indicator for MetaTrader 5 that explains itself. It opens the single candle and shows what happens inside it: the volume traded at every price level, split into aggressive buyers and aggressive sellers. From the ticks it builds a complete footprint chart in real time with delta, imbalance, absorption, volume profile, market profile (TPO), VWAP, cumulative delta (
CGE Trading Suite
Carl Gustav Johan Ekstrom
5 (3)
Institutional-Grade Analytics for MT5 The full analytical edge of a professional trading desk, built into your MT5 chart. A full guided tour walks you through every feature step by step. Standard retail platforms lack the depth required for professional market analysis. The CGE Trading Suite bridges this gap, transforming MetaTrader 5 into a comprehensive workspace. By integrating 18 proprietary modules into a single, unified chart interface, the suite eliminates fragmented analysis. It provide
Scalper Vault is a powerful, fully-equipped trading system designed for traders who want to achieve consistency in intraday trading . This high-precision indicator serves as a complete, standalone trading system that delivers institutional-grade analysis for both Forex and Binary Options traders. PLEASE CONTACT ME AFTER PURCHASE TO GET MY TRADING TIPS PLUS A GREAT BONUS! By eliminating the guesswork and complex manual analysis, Scalper Vault allows you to focus purely on execution using easy to
Divergence Bomber
Ihor Otkydach
4.89 (94)
Each buyer of this indicator also receives the following for free: The custom utility "Bomber Utility", which automatically manages every trade, sets Stop Loss and Take Profit levels, and closes trades according to the rules of this strategy Set files for configuring the indicator for various assets Set files for configuring Bomber Utility in the following modes: "Minimum Risk", "Balanced Risk", and "Wait-and-See Strategy" A step-by-step video manual to help you quickly install, configure, and
FX Analysis is an all-in-one MT5 indicator dashboard that combines eight analytical tools in a single panel, helping traders identify high-probability setups without switching between charts or indicators. Designed for standard forex pairs on MetaTrader 5. Best results on M15 - H4 timeframes when all components are used together as part of the included workflow. Components Volatility Analyzer Displays historical average movement by hour and by day of the week. A real-time Pip Balance shows the
PainX GainX Blue Spike Fusion AI Synthetic Index Spike Analysis Indicator for MetaTrader 5 Overview PainX GainX Blue Spike Fusion AI is a technical analysis indicator for MetaTrader 5, designed to help traders monitor potential spike setups on compatible synthetic indices. The indicator combines signal monitoring, market-condition analysis, chart markers, notifications, and an on-chart information panel. It presents relevant market information in an organized format to help traders evaluate pote
Hi Trader, Most retail traders rely on lagging, web-based scripts. To trade with a true edge, you need institutional architecture. The Astro AI Indicator is not a standard chart overlay. It is a compiled, dual-agent neural network running directly on your terminal. Here is the exact technology driving the system: 1. Agent 1: The Analyst (Graph Neural Networks - GNN) Markets are not just isolated price bars; they are interconnected networks of data. The Function: Agent 1 utilizes a Graph Neural
ARIPoint
Temirlan Kdyrkhan
1 (4)
ARIPoint is a powerful trading companion designed to generate high-probability entry signals with dynamic TP/SL/DP levels based on volatility. Built-in performance tracking shows win/loss stats, PP1/PP2 hits, and success rates all updated live. Key Features: Buy/Sell signals with adaptive volatility bands Real-time TP/SL/DP levels based on ATR Built-in MA Filter with optional ATR/StdDev volatility Performance stats panel (Success, Profit/Loss, PP1/PP2) Alerts via popup, sound, push, or email Cu
Best Solution for any Newbie or Expert Trader! This Indicator is a unique, high quality and affordable trading tool because we have incorporated a number of proprietary features and a new formula. With only ONE chart you can read Currency Strength for 28 Forex pairs! Imagine how your trading will improve because you are able to pinpoint the exact trigger point of a new trend or scalping opportunity? User manual:   click here That's the first one, the original! Don't buy a worthless wannabe clone
KURAMA GOLD SIGNAL PRO (MT5) — 7-Layer Filter, Auto TP/SL, Quality Score & Signal History Save | Complete XAUUSD Trading System No repaint in real time. The moment a signal appears, the arrow, entry, TP and SL are locked on the spot and never move afterward. What you trade is this real-time signal. And in v7.20, every signal that is actually sent is auto-saved and restored exactly after restart. BUYER BONUS Buy the lifetime license and receive AI Zone Radar (
Advanced Supply Demand MT5
Bernhard Schweigert
4.53 (15)
Best Solution for any Newbie or Expert Trader! This indicator is a unique, high quality and affordable trading tool because we have incorporated a number of proprietary features and a new formula. With this update, you will be able to show double timeframe zones. You will not only be able to show a higher TF but to show both, the chart TF, PLUS the higher TF: SHOWING NESTED ZONES. All Supply Demand traders will love it. :) Important Information Revealed Maximize the potential of Advanced Supply
DELTA FUSION PRO  is a professional MetaTrader indicator dedicated to real-time order flow analysis and institutional pressure (Ask/Bid difference). Main Features Smart Auto-Tuning: Automatically calibrates based on the market (Forex, Crypto, Indices, Commodities, Stocks, Futures), timeframe, and volatility (ATR). Operational Functionality: NetDelta & Cumulative Delta: Tracking directional pressure with EMA smoothing. Price/Volume Divergences: Detects regular/hidden divergences (classified as St
SR Liquidity   is a trading indicator designed to reveal the hidden zones where market liquidity concentrates and price reacts most strongly. These special liquidity areas act as powerful support and resistance levels, giving you a clear map of where the market is most likely to reverse. Instead of drawing ordinary Support/Resistance lines, SR Liquidity analyzes real price behavior to detect the zones where buying and selling pressure accumulate. These are actually the pools of liquidity that dr
Introducing   Quantum Breakout PRO , the groundbreaking MQL5 Indicator that's transforming the way you trade Breakout Zones! Developed by a team of experienced traders with trading experience of over 13 years,   Quantum Breakout PRO   is designed to propel your trading journey to new heights with its innovative and dynamic breakout zone strategy. Quantum Breakout Indicator will give you signal arrows on breakout zones with 5 profit target zones and stop loss suggestion based on the breakout b
Volatility Master for MetaTrader is a real-time dashboard tool that scans up to  50 symbols  to identify high-volatility , trending markets instantly. With bullish/bearish signals, customizable alerts, and a user-friendly interface, it helps you avoid range-bound conditions and focus on high-probability trades. Clarity leads to confidence. Trade confidently and protect your capital effectively with this powerful dashboard. We don't offer free or bonus indicators in exchange of reviews from you.
Graded Liquidity Sweep
Kaustubh Pradeep Deshmukh
This indicator marks the candles where price runs through a liquidity level and turns back. It finds and ranks the levels by itself, so there is nothing to draw by hand. It is made for manual trading on any symbol and timeframe. What you see on the chart A buy or sell arrow on the candle that confirms the reversal. Arrows appear only after that candle has closed, and they do not repaint. For every signal: the level that was swept, a stop level and two target levels. A label with the type of leve
More from author
YazanPro Confluence H1
Yazan Adnan Ramadan Ibrahim
YazanPro Confluence H1 is an Expert Advisor with a chart panel for traders who want to see why a trade is taken. On every closed bar of the analysis timeframe (H1 by default) it scores several groups of indicators, checks the trend on D1, H4 and H1, and looks for a price-action trigger. It enters only when the score, the trend and the trigger agree and every filter passes. It can trade by itself (AUTO), wait for your BUY or SELL click (MANUAL), or only show the analysis (PANEL). Please read this
YazanPro Scalp Panel M5
Yazan Adnan Ramadan Ibrahim
YazanPro Scalp Panel M5 is an Expert Advisor for MetaTrader 5 that puts a multi-indicator checklist on your chart and lets you open short trades with one click. It can also trade by itself (AUTO mode, which is the default). It is meant for traders who want to see in one place what the trend, oscillators, moving averages and candlestick and chart patterns say on a short timeframe, and who will test and adjust the settings themselves. Please read this first. With the default settings this is not a
YazanPro Session Open Scalper
Yazan Adnan Ramadan Ibrahim
YazanPro Session Open Scalper is a configurable Expert Advisor for traders who want to test one specific idea: trading the first minutes after a market session opens. At each scheduled open it waits for a tick with a normal spread, takes a small fixed target, and closes after a short time limit if the target is not reached. Please read this first. With the default settings, this idea lost money in every backtest below that placed trades, including a one-year gold test. In a separate research stu
YazanPro Activity Burst Scalper
Yazan Adnan Ramadan Ibrahim
YazanPro Activity Burst Scalper is an experimental Expert Advisor for traders who want to study one idea on their own broker's data: short bursts of market activity. Price does not move at an even pace. Now and then the number of ticks per minute and the size of the 1-minute bars jump well above their usual level for a few minutes. This EA measures those bursts, opens a short trade when one starts, and closes it quickly. Please read this first. With the default settings this EA lost money in eve
YazanPro Supply Demand Flow
Yazan Adnan Ramadan Ibrahim
YazanPro Supply Demand Flow is a MetaTrader 5 indicator that draws supply and demand zones, fair value gaps, VWAP bands, volume spike dots, session boxes and day levels on the chart, and sums up the recent volume in a panel. It works on any symbol (forex, metals, indices, stocks, crypto) and on any timeframe from M1 to MN1. It is a display tool: it places no orders and gives no signals. What you see on the chart (the numbers match the call-outs in the screenshots) Supply and demand zones. A zone
YazanPro Auto Levels & Fibonacci is a MetaTrader 5 indicator that draws support / resistance zones, breakout arrows, trendlines, pivots, round numbers and an auto Fibonacci on the chart, and shows on a panel how far the price is from each of them. It draws the price levels most traders mark by hand, keeps them up to date on every closed bar and tells you on a panel where price is right now against them. It works on any symbol (forex, metals, indices, stocks, crypto) and on any timeframe from M1
Filter:
No reviews
Reply to review