RSI Triple Timeframe
- Indicators
-
Deepak
 Welcome to Deepak Fx Trader. I’ve seen countless people step into the trading world with big dreams, only to get lost without a clear path or the right technical guidance. I build advanced Expert Advisors, Indicators, and Trading Utilities to give you that exact direction. True success in trading
 - Version: 12.0
- Activations: 5
RSI Triple Timeframe - Three Timeframes RSI Average Indicator for MetaTrader 5
Developer Profile & Other Tools: You can view my seller profile on MQL5 for more trading tools and utilities
Main Features & Key Highlights
-
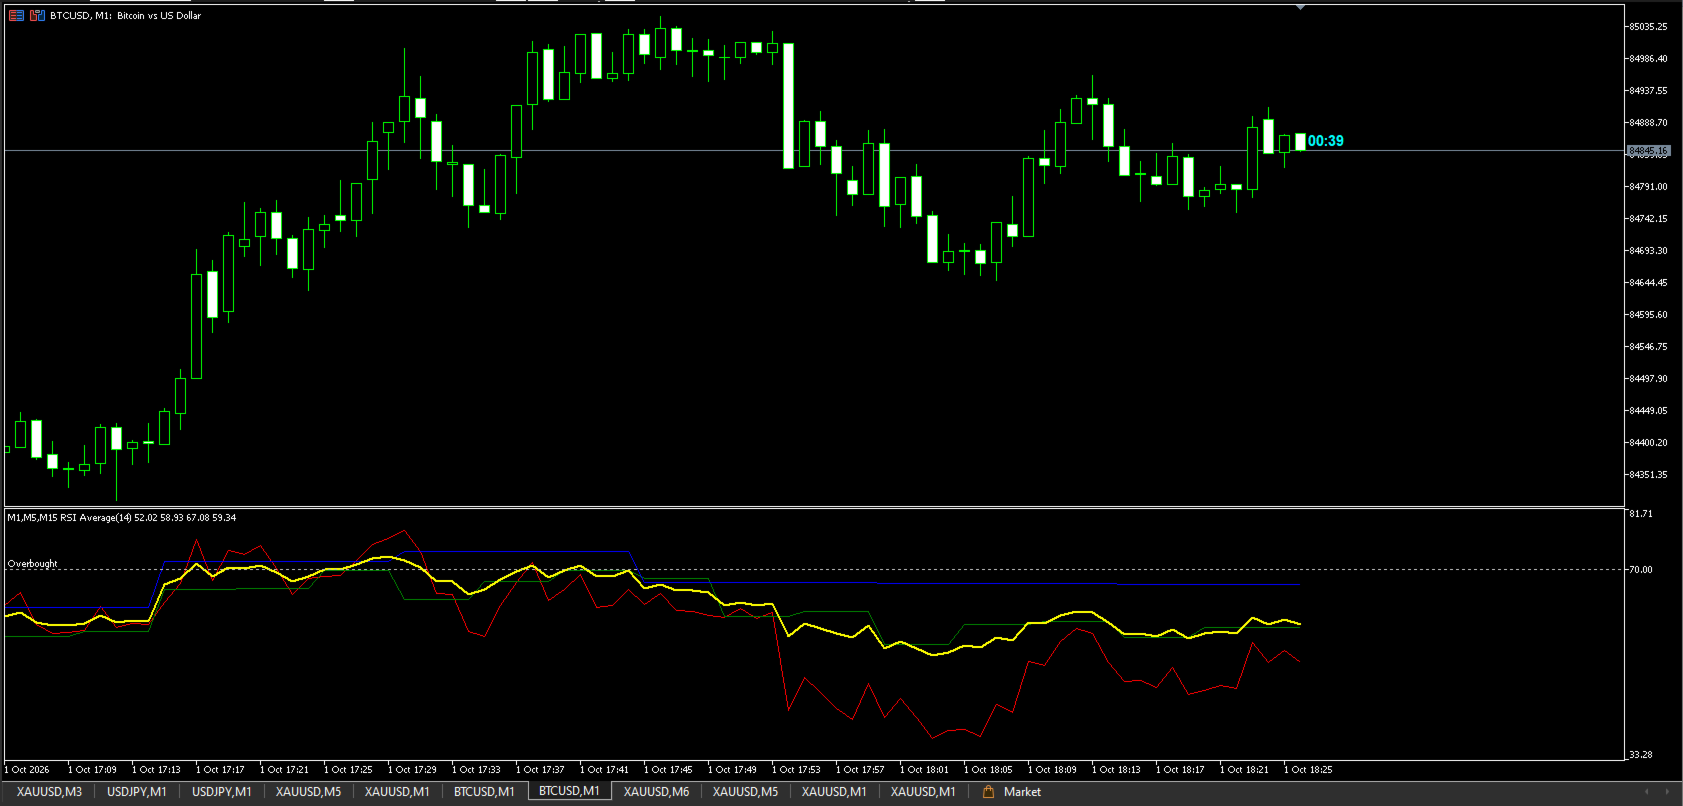
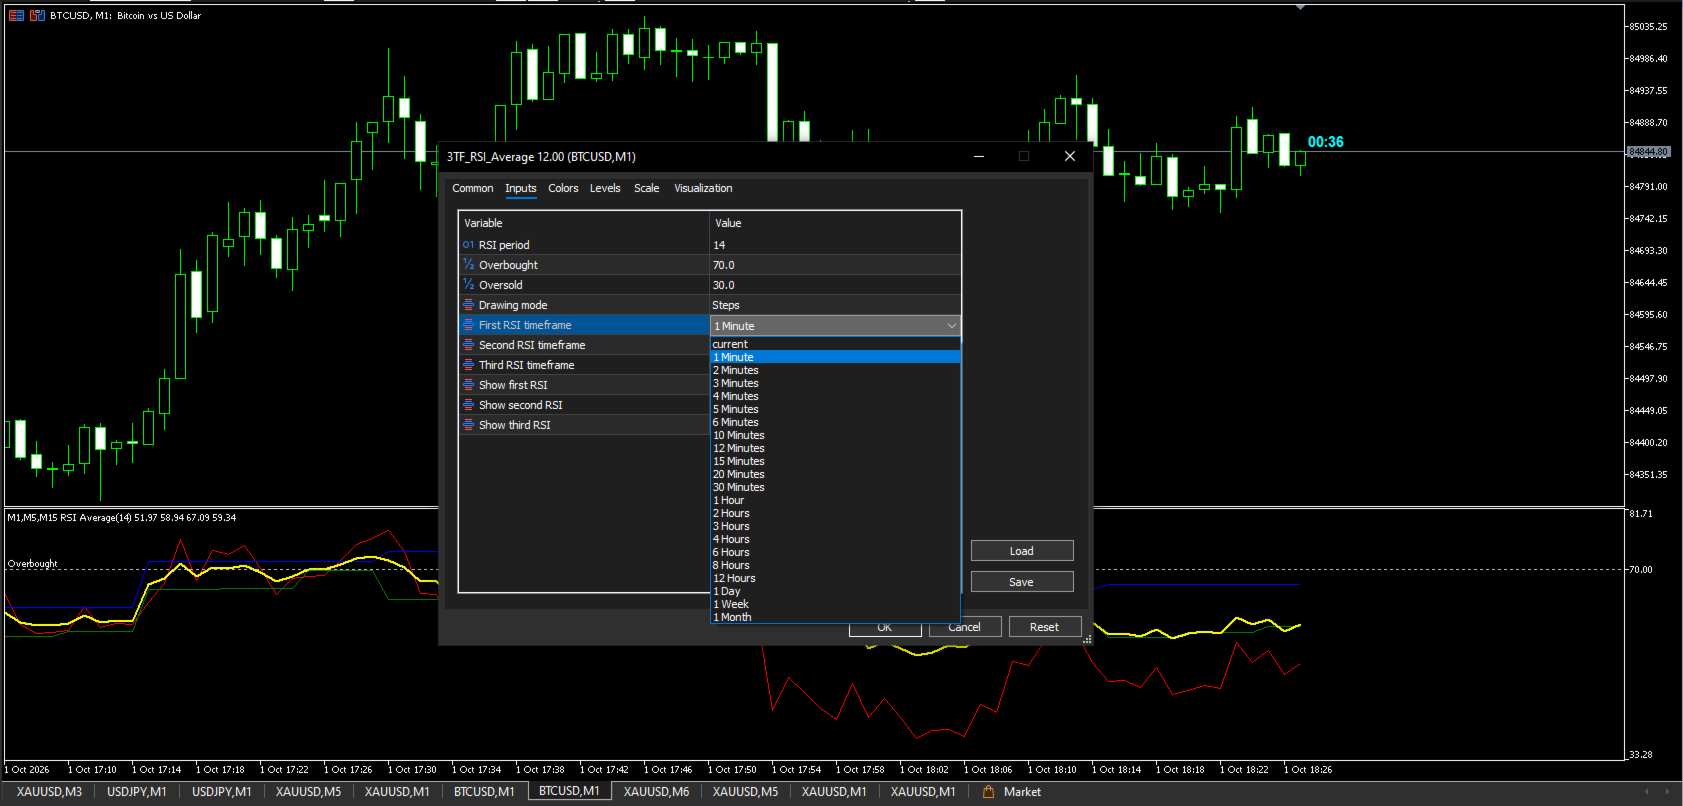
Multi-Timeframe Analysis (3 Timeframes in 1 Window): Monitor three different timeframes of the Relative Strength Index (RSI) simultaneously on a single separate indicator window, giving you an immediate view of both short-term and long-term momentum.
-
Smart Average RSI Line (Golden Line): Automatically calculates and plots the average of all three timeframes ( (RSI1 + RSI2 + RSI3) / 3 ), helping you gauge overall trend direction and market strength with high clarity.
-
No Need to Change Timeframes Again & Again: Save time and streamline your workflow. You no longer need to switch back and forth between 1-minute, 5-minute, 15-minute, or higher charts to check individual timeframe conditions—everything is displayed right in front of you.
-
Customizable Drawing Modes (Steps & Slope): Choose how higher timeframe data is projected on your current chart:
-
Steps: Displays data in a staircase format for clean breakout/level identification.
-
Slope: Smoothly connects points with straight sloping lines.
-
-
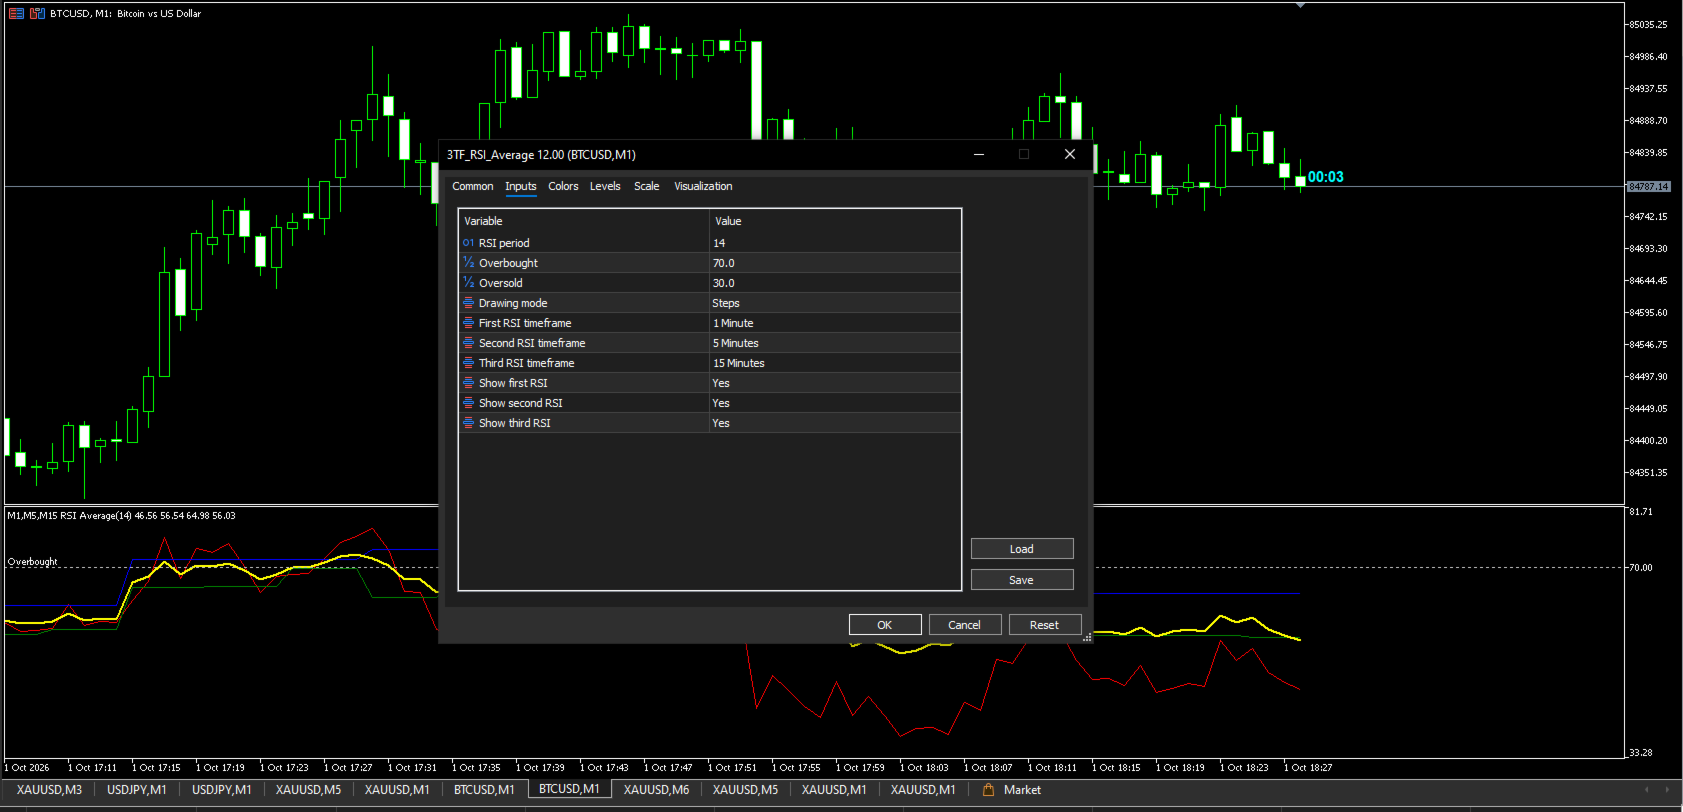
Flexible Display Options: Easily toggle the visibility of individual RSI lines ( Show first RSI , Show second RSI , Show third RSI ) via input settings if you want to focus purely on the average line or specific components.
Customizable Input Parameters
-
RSI Period: Set the calculation period for the RSI (Default: 14 ).
-
Overbought / Oversold Levels: Configure custom levels (Default: 70.0 for Overbought and 30.0 for Oversold) with clear on-chart reference lines and labels.
-
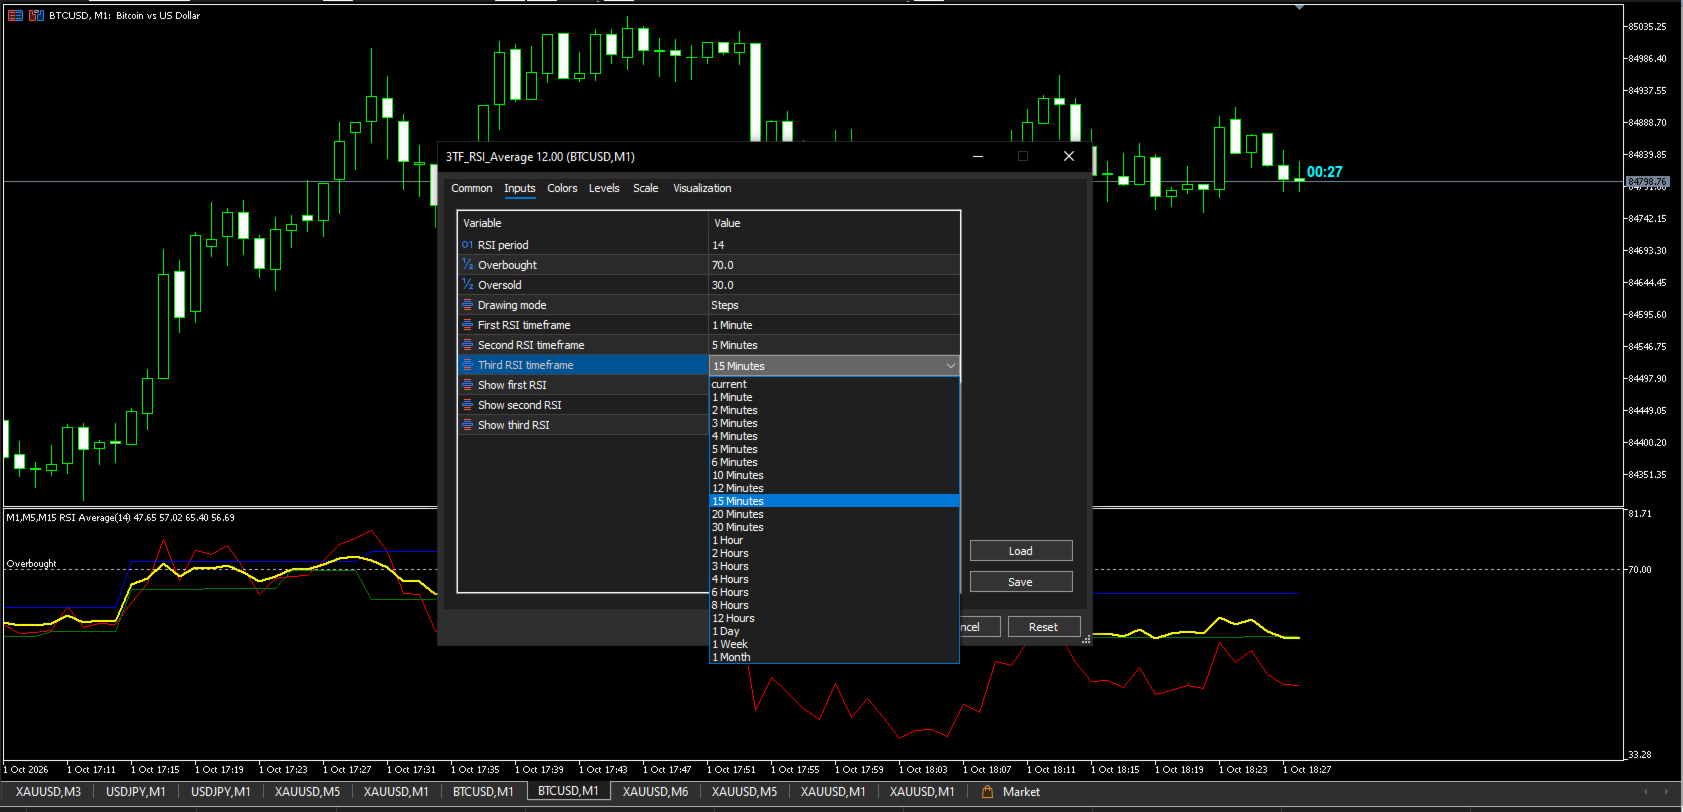
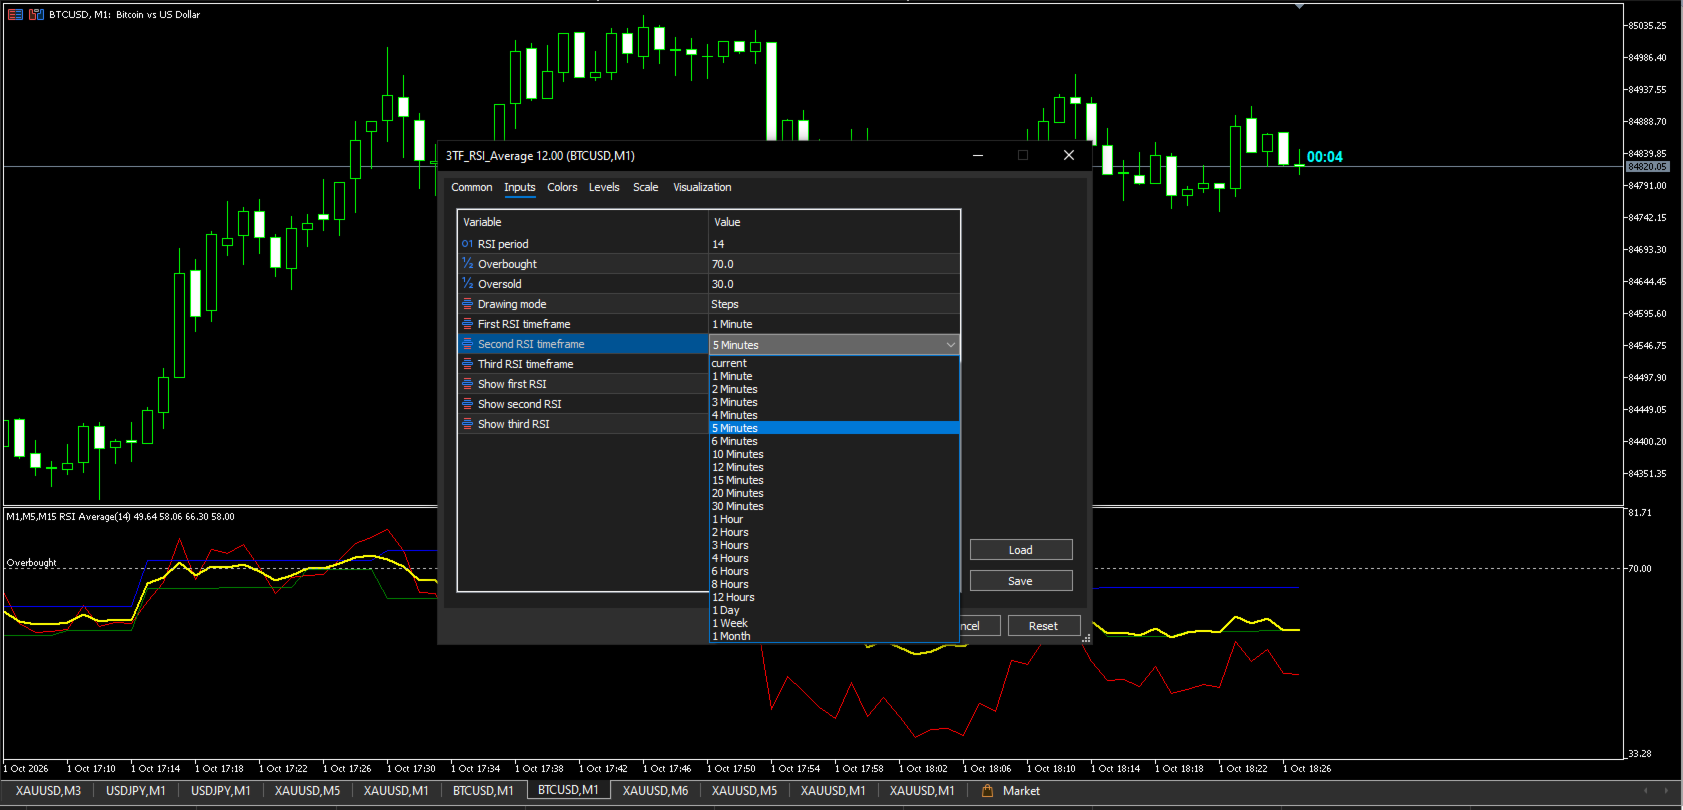
Timeframe 1, 2, & 3: Select any three preferred timeframes from M1 up to Monthly (MN1).
How It Works & Trading Benefits
-
Seamless Multi-TF Synchronization: The indicator runs background handles for all three chosen timeframes and dynamically maps the data onto your active chart bars.
-
Confluence & Confirmation: Spot powerful trend continuations and reversals when multiple timeframes align together in overbought/oversold zones.
-
Fast Decision Making: Perfect for day traders, scalpers, and algorithmic traders looking for instant multi-timeframe confirmation without cluttering workspace windows.
(You can view my seller profile on MQL5 for more trading tools and utilities).
Developer Profile & Other Tools: https://www.mql5.com/en/users/deepak89kumar/seller