Confluence Master Signal Scanner
- Indicators
- Version: 3.0
- Activations: 20

Confluence Master Signal Scanner
A Multi-Timeframe, Multi-Symbol Setup Filter for Serious Traders
Overview
Confluence Master Signal Scanner is a professional-grade market scanning tool that automatically reviews every symbol in your Market Watch across multiple timeframes and returns only the setups where independent analytical factors all point in the same direction.
It is not a signal generator in the traditional sense. It is a filter — a disciplined, tireless scanning engine that discards the vast majority of chart and timeframe combinations so you can focus your attention on the few that genuinely deserve it.
The Problem It Solves
Every trader knows the routine. Flick through dozens of pairs across multiple timeframes, squint at indicators that contradict each other, talk yourself into a trade, and then discover too late that the higher timeframe was signalling the opposite direction. By the time you have checked everything manually, the opportunity has moved on.
This scanner does that work for you — automatically, consistently, and without emotion.
The Core Logic: Triple Agreement
A signal is only allowed to appear when three independent conditions align.
The first is trend direction — a smoothed, step-based trend filter that only changes state when price has travelled far enough to be taken seriously, with a dead zone that adapts to market conditions.
The second is fair value position — a rolling volume-weighted average price line acting as the market's fair-value anchor. Price must be on the correct side of this line for a signal to qualify.
The third is a multi-factor confluence score — six independent factors vote on every candle, blended into a single score. A signal requires the score to cross a configurable trigger level and a minimum number of factors to agree.
If all three do not line up, nothing appears. Silence is a feature, not a bug.
What You See on the Dashboard
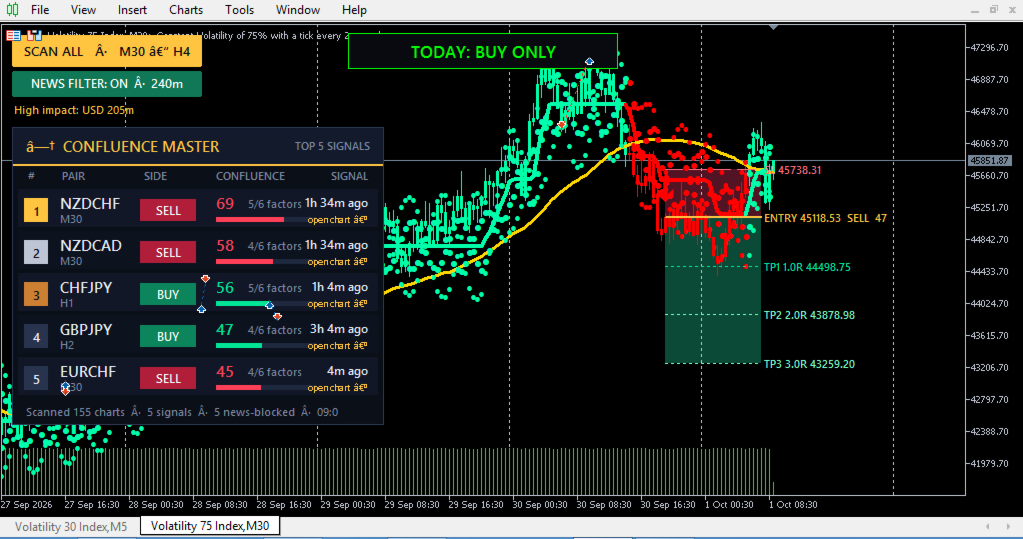
Every surviving setup is scored and ranked, with the best five displayed in a clean, dark panel. Each row shows the pair, timeframe, direction, confluence score, how many factors agree, and how old the signal is. Clicking any row opens a fully prepared chart window on that exact pair and timeframe, pre-loaded with trend line, fair-value line, signal arrow, and the complete trade ladder.
The Stop Loss and Target Logic
This is where the tool separates itself from typical scanners.
Stop loss is placed beyond the fair-value line — below it for buys, above it for sells — plus a small volatility buffer. The reasoning is simple. If price travels all the way back through the market's fair-value line, the premise behind the trade is damaged. There is no reason to remain in it.
Take profits are calculated as multiples of the entry-to-stop distance, by default 1R, 2R, and 3R, ensuring consistent reward-to-risk regardless of market conditions.
The important consequence is that because the stop is anchored to market structure rather than a fixed pip count, the stop distance changes from trade to trade. Position sizing must adapt accordingly — fixed risk, variable lot size.
The Daily Bias Banner
A plain-English read of the day's directional lean is displayed at the top of your chart: BUY ONLY, SELL ONLY, or NO CLEAR BIAS. Built from multiple daily-timeframe inputs, it serves as a compass rather than a gate, useful as a tiebreaker and a caution flag.
The Scanner Workflow
Step 1 — Prepare your Market Watch. Only symbols in your Market Watch are scanned. Keep the list tidy and relevant.
Step 2 — Scan after candle close. The scanner reads closed candles only. Right after a close is when fresh signals appear.
Step 3 — Check the news filter. A built-in high-impact calendar filter removes pairs with imminent news events, so you are not caught in a spike.
Step 4 — Review the Daily Bias. Agreement with bias is a stronger setup. Disagreement is a caution flag.
Step 5 — Click and read the chart. Every opened window arrives pre-built with the full trade ladder. Two minutes of honest reading beats ten blind entries.
Step 6 — Confirm with the higher timeframe. A signal with the tide behind it is simply a better trade.
Step 7 — Size from the stop. Fixed risk per trade, variable lot size. Every time.
Step 8 — Manage with the ladder. Scale out at predefined targets and protect the position as the trade develops.
---
Timeframe Guide
M30 is the fastest the scanner goes — more signals, more noise, and the spread matters more. Best for active intraday traders who can watch the screen.
H1 offers the balance of frequency and quality that most intraday traders find ideal — enough signals to stay busy, slow enough that the trend line means something.
H2 and H3 sit in the quiet middle — fewer signals, usually cleaner structure, ideal for traders who cannot sit at the screen all day.
H4 is the slowest. Signals are rare, stops are wide, and trades can run for days. Suited to swing traders and those who hold through the session.
The scanner ranks all timeframes together, so a strong higher-timeframe signal can outrank a mediocre lower-timeframe one.
---
Key Settings
The score trigger controls how strong the confluence must be to fire. The minimum agreeing factors setting controls how many of the six factors must vote the same way. Maximum signal age controls how old a signal can be and still appear. The trend filter preset offers balanced, fast response, or smooth trend modes. The agreement filter switches allow the trend and fair-value filters to be toggled independently. Fair-value lookback controls how many bars the reference line averages. Stop placement and buffer control how far beyond the fair-value line the stop sits. Target multipliers set the reward-to-risk ratios for the three take-profit levels. The news window controls how far ahead the calendar filter looks.
---
The Do's
Keep your Market Watch tidy — quality input, quality output. Scan right after candle closes. Leave the news filter on unless you have a deliberate plan. Read the chart every time before entering. Size your position from the stop distance. Risk a small, consistent percentage per trade. Confirm with the higher timeframe. Use the Daily Bias as a tiebreaker. Watch for correlation — five dollar-short trades are one trade. Check the spread before entering. Trade the sessions that suit your pairs. Demo test first, journal everything, and treat a no-signal result as useful information.
---
The Don'ts
Do not follow it blindly — you are still the trader. Do not take stale signals. Do not chase stretched entries. Do not use the same lot size on every trade. Do not ignore the stop. Do not stack correlated trades and call it diversification. Do not trade through high-impact news with the filter off. Do not judge the tool by scrolling back on the chart. Do not over-tune settings. Do not switch presets after every loss. Do not expect signals every day. Do not risk money you cannot afford to lose.
What Actually Affects Profitability
No indicator makes you profitable on its own. Results come from selection, risk per trade, reward-to-risk, discipline, sample size, and market conditions. The scanner helps keep you out of the worst conditions, but no filter removes them completely. When the scanner goes quiet, that is often the market telling you the same thing.
Who This Is For
Traders watching many pairs and drowning in charts. Intraday and swing traders working M30 to H4. Traders who like confluence and want the computer to do the legwork. Anyone who wants clean, pre-drawn entry, stop and target levels in seconds. Traders who respect risk and want position sizing to follow the stop, not their mood.
Who This Is Not For
Anyone looking for a guaranteed money machine. Scalpers on M1 to M15 — the scanner starts at M30. Anyone unwilling to manage risk.
Final Word
This scanner was built to be a second pair of eyes that never gets tired, never skips a pair, and never gets excited. It reads the market the way a disciplined trader would — with a trend filter, a fair-value line, and a multi-factor score — and it only speaks when they all agree.
Use it like a professional would. Scan at the right time. Read the chart. Respect the news. Size from the stop. Take the few good trades and skip the rest.
Test it on demo, learn its rhythm on your pairs, then trade it with risk you are comfortable with.
Risk Disclaimer
Trading foreign exchange, metals, and other leveraged instruments carries a high level of risk and may not be suitable for every investor. You can lose more than your initial deposit. This indicator is a technical analysis tool that displays signals and price levels. It does not execute trades, does not guarantee profits, and past performance is not indicative of future results. Always test on a demo account first and never risk money you cannot afford to lose. Nothing in this description constitutes financial advice.