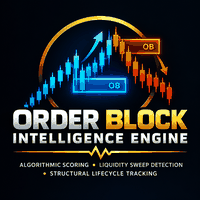
Order Block Intelligence Engine

  • Indicators
  • Ibe Hyginus Ugwoke
    Ibe Hyginus Ugwoke
    • MQL4/MQL5 Developer | Custom EAs & Indicators at  Independent / Self-employed
    • Nigeria
    • 275
    I’m an MQL4/MQL5 developer and active trader. I build and personally test the trading tools I develop, which gives me a practical understanding of edge cases, signal timing, and the differences between backtest and live behaviour.
  • Version: 1.2
  • Activations: 5
Order Block Intelligence Engine v1.02

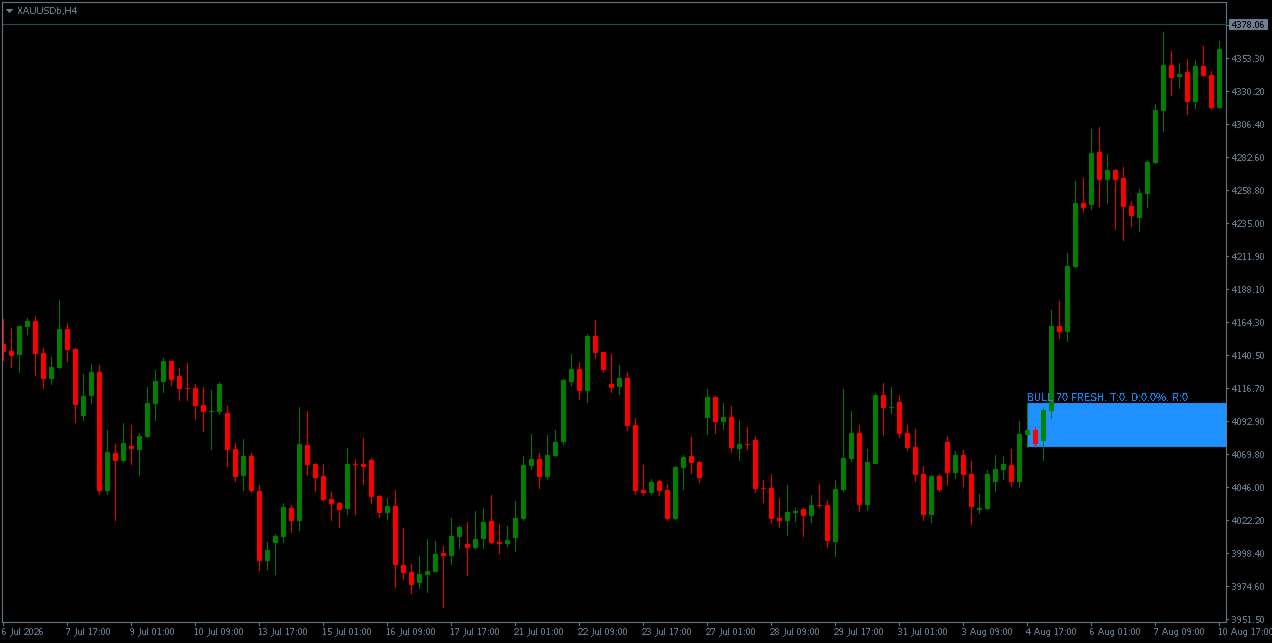
Detects order block zones using confirmed swing structure, break-of-structure with displacement, and a multi-factor quality score. Tracks each zone through a five-state lifecycle and optionally projects a next target level.

OVERVIEW

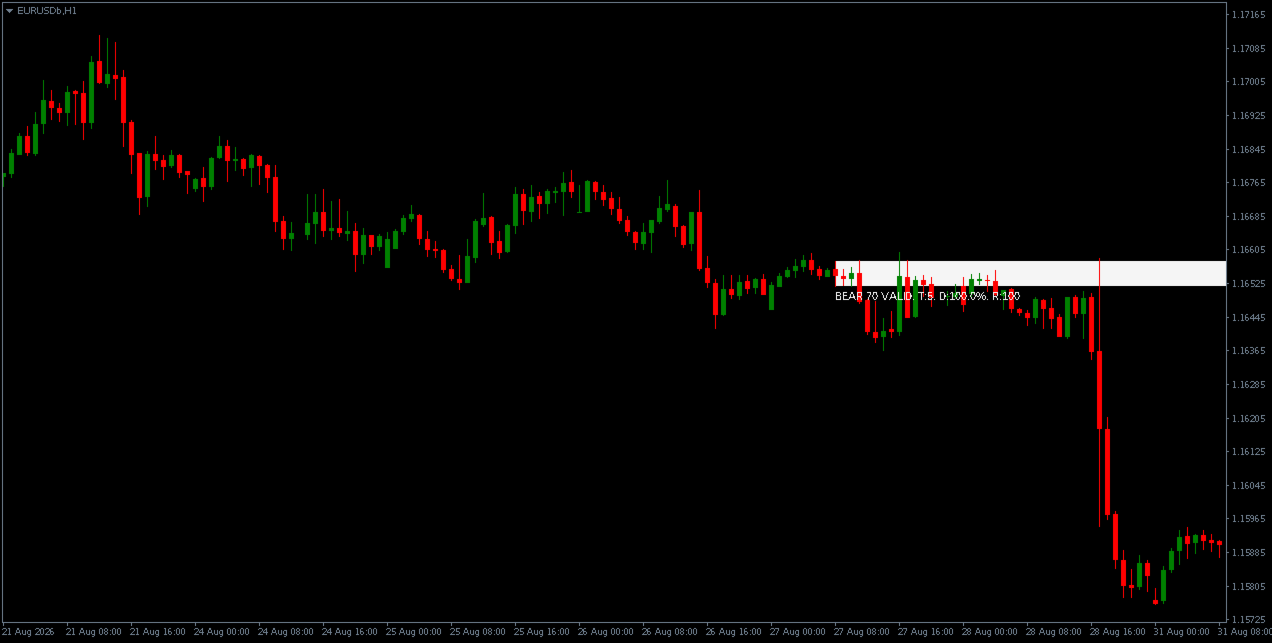
The indicator identifies order block zones on the current chart timeframe.

Each zone is defined by the origin candle (or base of consecutive candles) that preceded a break of structure, and by the swing point whose break confirmed the move.

Zones are only created after the break of structure is confirmed by a closed bar.

Each zone is evaluated by a heuristic quality score between 0 and 100, computed from six weighted components. The score is used to filter zones below a user-configurable threshold.

Each zone then transitions through a lifecycle of states as price interacts with it, and optionally projects a next target level drawn as a horizontal line.

Detection uses only OHLC prices and ATR.

It does not use volume, order flow, market profile, tick data, or any external source.

It does not identify institutional activity and does not claim to do so.

KEY FEATURES

• Dual swing detection: internal (minor) and external (major) swing points, weighted differently in the score
• Break-of-structure confirmation: zones require a closed bar that breaks the prior swing extreme with a minimum displacement body
• Multi-candle origin detection: the origin zone walks back through the base candles preceding the break, ending at the last opposite candle before the break of structure, up to a user-configurable maximum
• Multi-factor scoring: structure, displacement, liquidity sweep, origin base quality, fair value gap, and higher-timeframe alignment
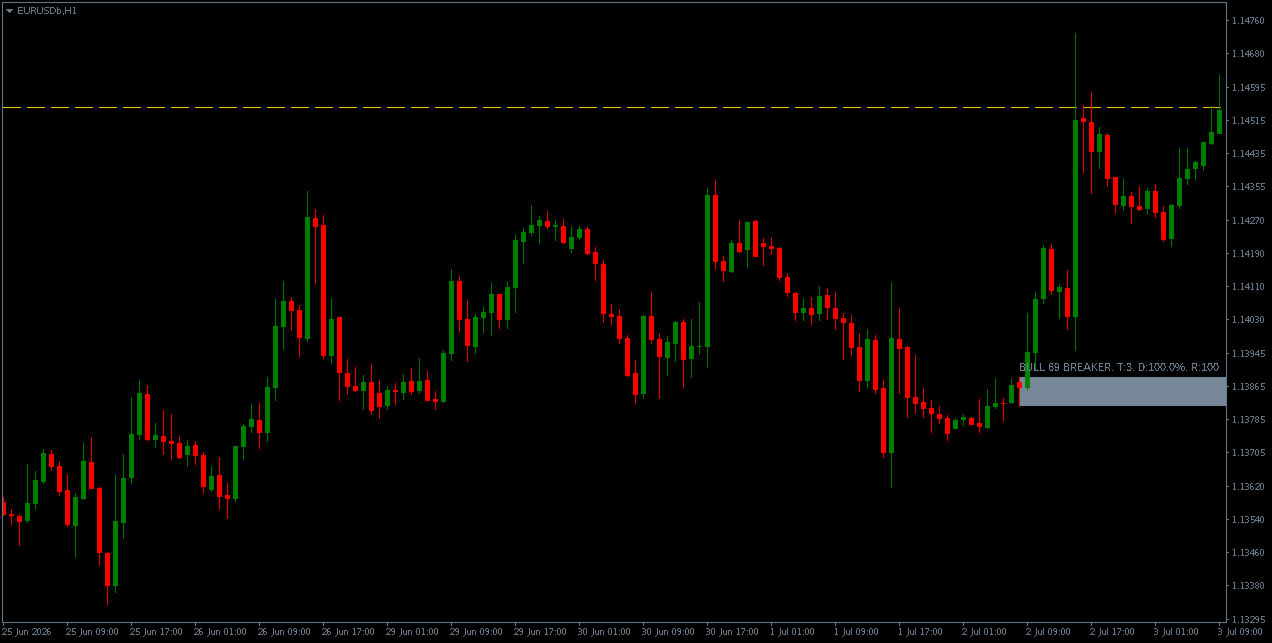
• Lifecycle state tracking: FRESH, TESTED, REACTING, VALID, BREAKER
• Optional target projection: the next opposite-type zone or unbroken swing level is drawn as a horizontal line
• Optional session filter, HTF alignment filter, and reaction timeout
• Overlap management: zones whose range overlaps an existing same-type zone by more than 50 percent are not drawn
• Alerts on new zone, first touch, reaction confirmed, and zone invalidated

ABOUT THE SCORE

Each zone produces a score between 0 and 100.

The score is a heuristic value computed from six weighted components.

The score is not:

• A probability
• A win rate
• A validated measure of trading outcome

A score of 75 does not mean the zone has a 75 percent chance of working.

It means the zone satisfied more of the six conditions that the scoring model rewards.

Every component weight is exposed as an input parameter, so users can adjust the emphasis of the model or disable components entirely.

Default minimum score for display: 67

WHAT THE SCORE EVALUATES

Structure Break

Zones derived from confirmed external swings receive more weight than zones derived from internal swings.

External swings are longer-term and structurally more significant than internal swings.

Displacement Quality

The break-of-structure candle is evaluated by:

• Body size
• Proportion of the range occupied by the body
• Location of the close within its range

A candle with a large body, small wicks, and a close at the extreme of its range receives the highest displacement credit.

Liquidity Sweep

If a bar between the break-of-structure candle and a recent opposite swing took out a prior swing level and then closed back inside, the zone receives the full liquidity credit.

This component is present or absent.

The default lookback window is configured wide enough that both internal-length and external-length sweeps are reachable under default settings.

Origin Base Quality

The origin zone is evaluated by:

• How tight its range is relative to ATR
• How many candles it contains

Tighter zones and larger bases score higher.

This component is scaled down when the break-of-structure candle's displacement falls below the configured gate, so a weakly displaced break receives only partial origin credit rather than none.

Fair Value Gap

If a three-bar imbalance exists between the origin zone and the break-of-structure candle in the direction of the move, the zone receives the full FVG credit.

This component is present or absent.

Higher-Timeframe Alignment

If enabled, the closing price of the break-of-structure bar is compared to an EMA on a user-selected higher timeframe.

If price is on the correct side of the EMA, the zone receives the full alignment credit.

This component can be disabled entirely, in which case its weight is not awarded to any zone.

The alignment uses the last fully completed higher-timeframe bar, so the score for a historical zone does not change once its break-of-structure bar has closed.

If the selected higher timeframe is not above the chart timeframe, or if insufficient higher-timeframe history is loaded, the component contributes nothing rather than awarding credit it cannot verify.

LIFECYCLE STATES

Each zone transitions through states as price evolves:

FRESH

The zone has been created and price has not returned to it.

Highest-potential state.

TESTED

Price has entered the zone at least once.

The touch count and maximum penetration percentage are updated on each touch.

REACTING

Price has tested the zone and has begun moving away, but the reversal has not yet been confirmed by a close beyond the zone boundary.

VALID

Price has closed beyond the far edge of the zone in the expected direction.

The reaction score is computed from the distance of the closing bar from the zone.

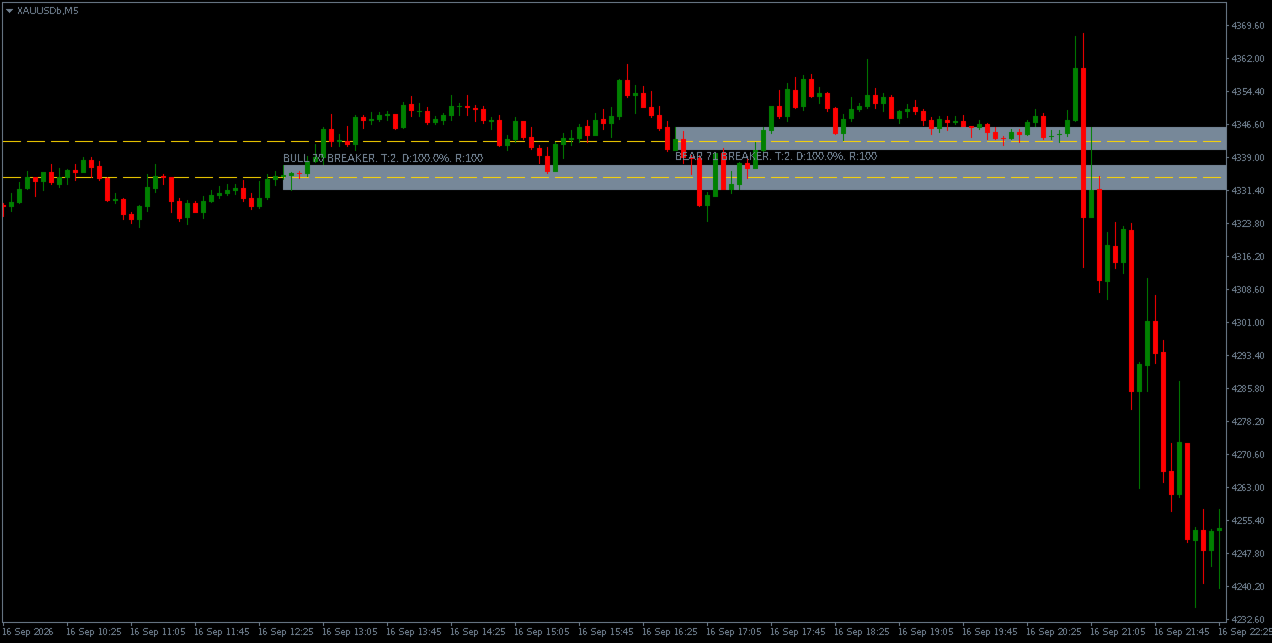
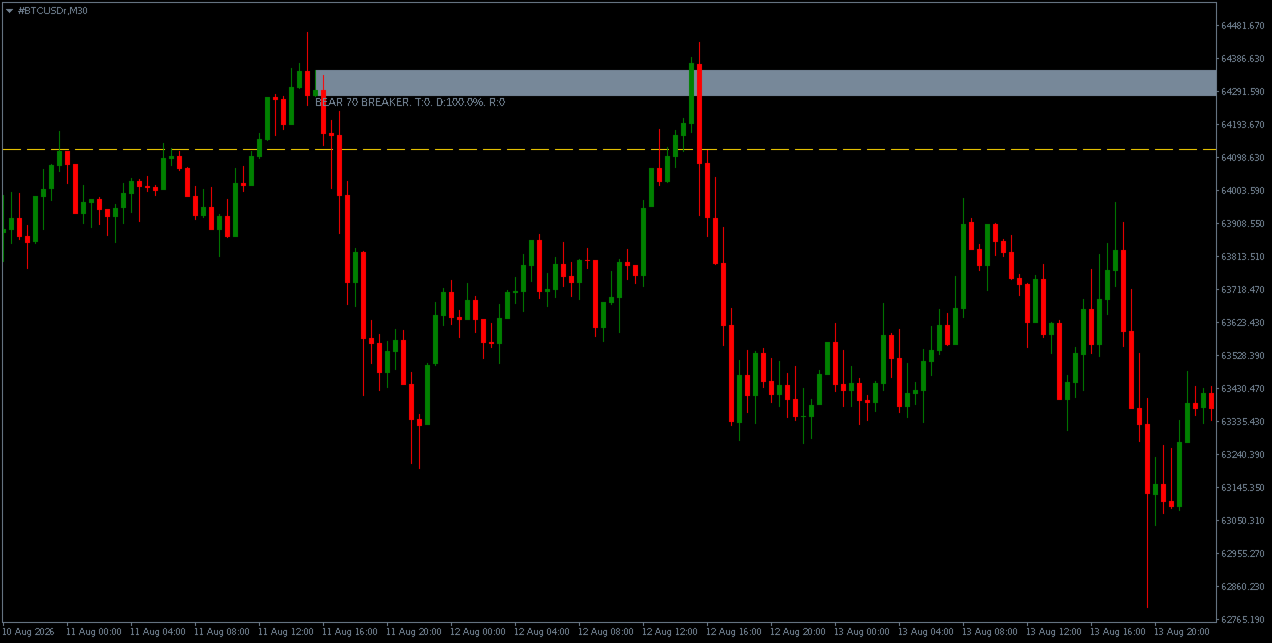
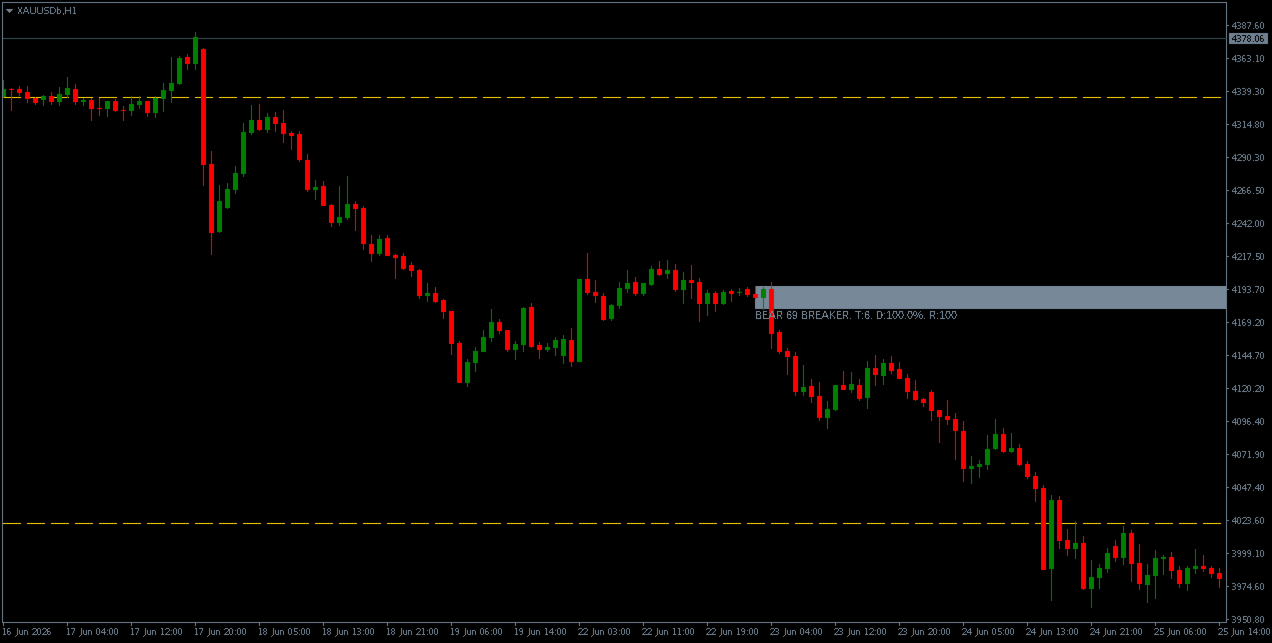
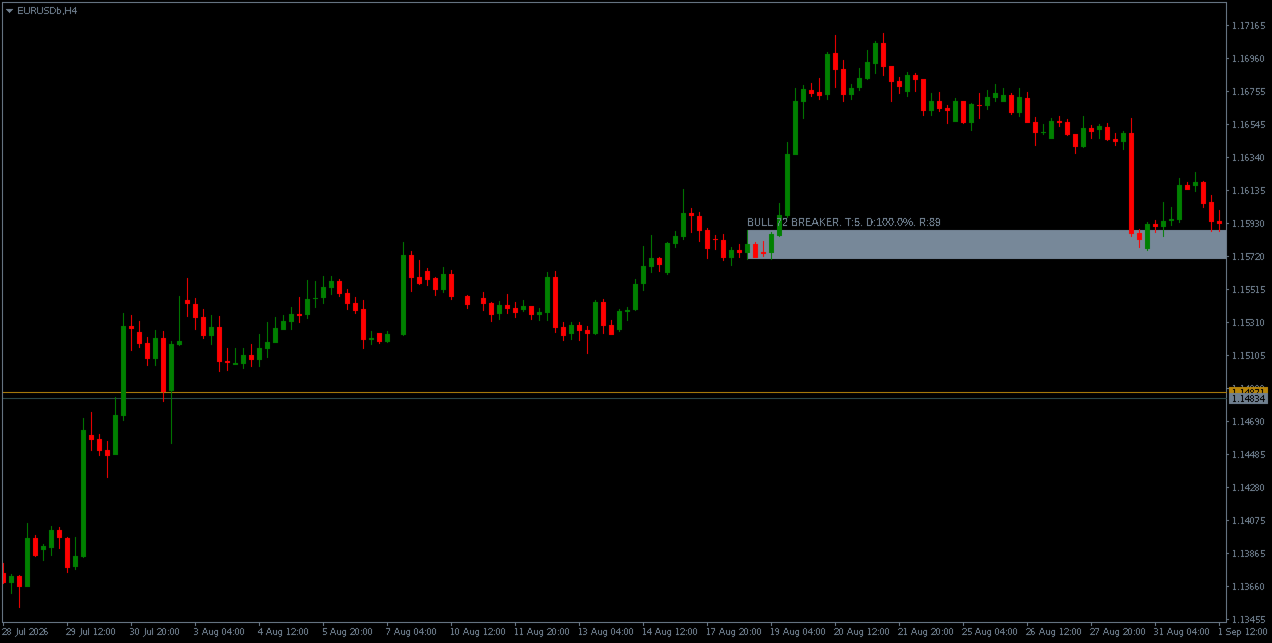
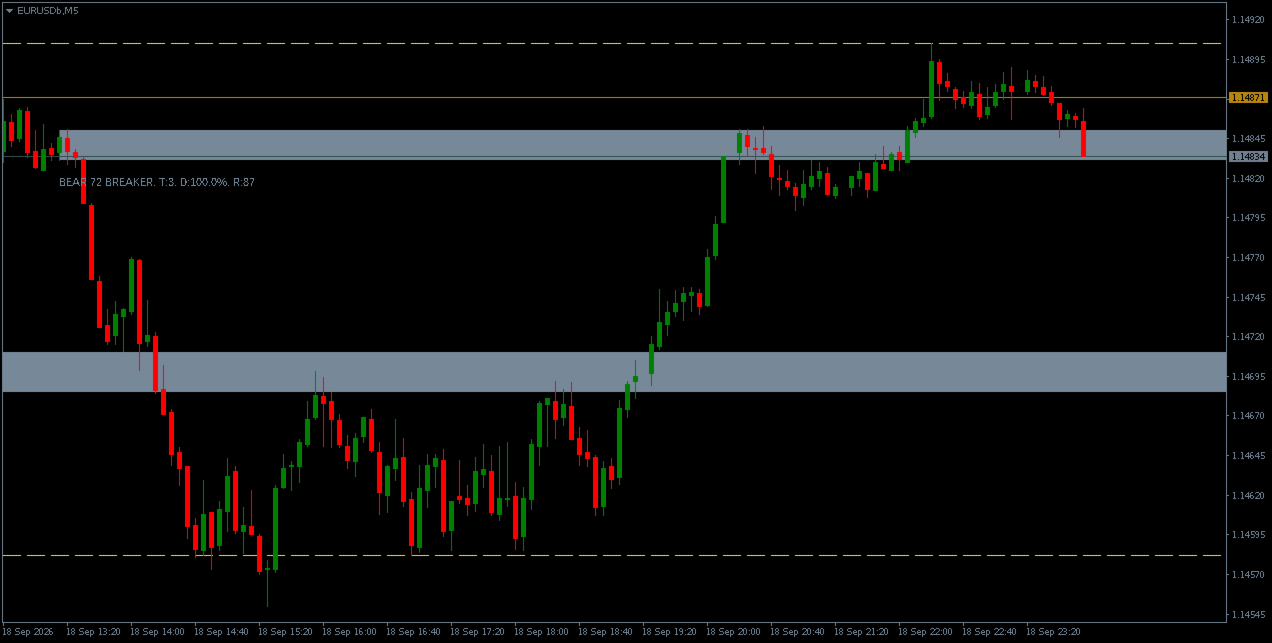
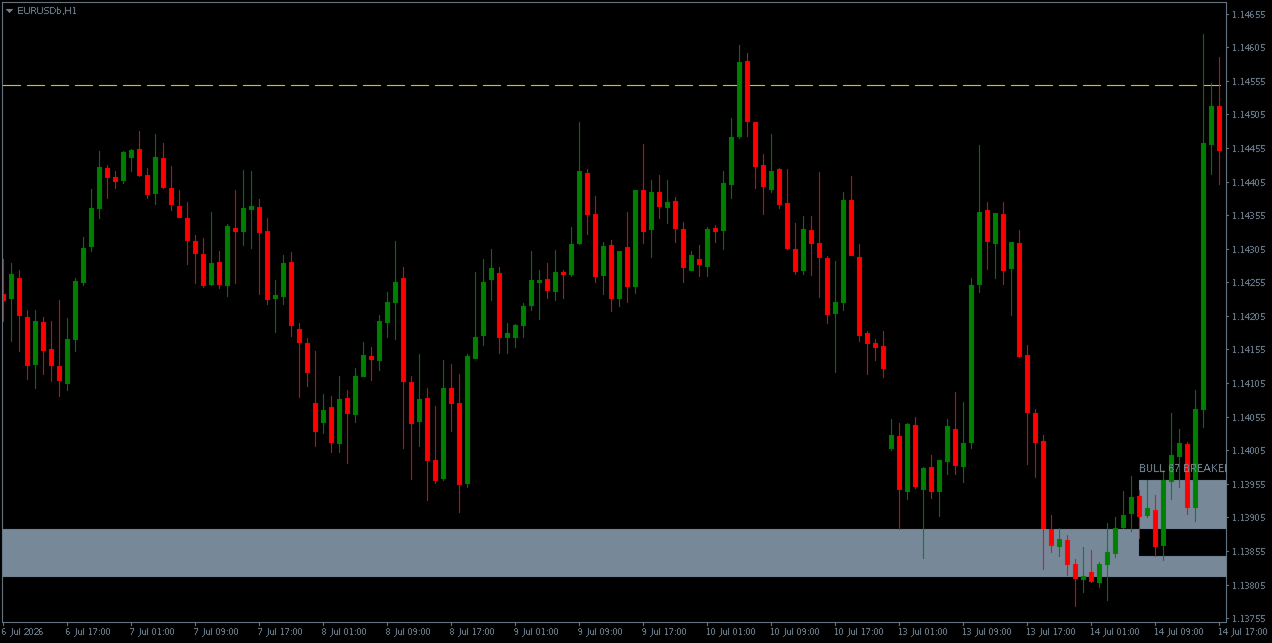
BREAKER

Price has closed through the far side of the zone in the opposite direction.

The zone is considered invalidated.

Breakers are drawn in a distinct colour and are capped at the break bar rather than extending forward.

They:

• Do not project targets
• Do not participate in same-type overlap checks
• Are not used as targets for other zones
• Are not automatically treated as an opposite-direction support or resistance level

Once a zone reaches VALID, it stays VALID until price closes through the far side of the zone and the state becomes BREAKER.

A wick or partial overlap back into a VALID zone updates the touch count and penetration percentage for descriptive purposes, but does not demote the zone to TESTED or reset the reaction score.

If a zone remains in REACTING for more than InpReactionTimeoutBars bars after the last touch without a decisive close beyond the zone boundary, it reverts to TESTED.

A zone already in TESTED is unaffected.

TARGET PROJECTION

For each displayed zone, if InpShowTargets is enabled, the indicator identifies a next logical target in the direction of the expected move.

The target is selected as follows:

1. Nearest opposite-type zone

The nearest opposite-type zone whose nearest edge lies ahead of the current zone is used.

For a bullish zone, this is the low of the nearest bearish zone above.

For a bearish zone, this is the high of the nearest bullish zone below.

2. Nearest unbroken swing

If no opposite zone exists, the nearest unbroken swing high for bullish zones or swing low for bearish zones is used.

A swing is considered broken if any close after the swing has exceeded its level.

The target is drawn as a horizontal line with user-configurable colour, width, and style.

If InpAlertOnTargetHit is enabled, an alert fires the first time the closing price of the last completed bar reaches the target.

Breaker zones do not project targets.

FILTERS

Session Filter

When enabled, zones whose break-of-structure bar falls outside the configured server-time hours are not created.

Higher-Timeframe Alignment

When enabled, zones must satisfy the EMA alignment condition described in the scoring section.

The filter has no effect if the selected higher timeframe is not above the chart timeframe.

Reaction Timeout

As described in the lifecycle section.

Overlap Management

Zones whose range overlaps an existing same-type zone by more than 50 percent are rejected.

ALERTS

Optional alerts are provided for four events:

• New qualifying zone created
• Zone touched for the first time
• Zone state transitions to VALID — reaction confirmed
• Zone state transitions to BREAKER — invalidated
• Optional: target level reached

Each event type is controlled by its own input.

Three notification channels are supported:

• Popup alert with sound
• Push notification
• Email

Alerts fire only on live bar events.

Historical replay during initial load does not produce alerts.

Any target that is already behind current price when the indicator is first attached does not fire a retrospective alert.

INPUT PARAMETERS

Swing Detection

• Internal swing length
• External swing length
• Maximum bars after swing to search for the break of structure
• Maximum candles in the origin base

Zone Validity

• Minimum zone range as ATR multiple
• Minimum break-of-structure body as ATR multiple

Scoring

• Minimum score to display
• Six component weights
• Displacement gate threshold
• Compression discount multiplier
• Maximum opposite candle body-to-range ratio for origin core

Liquidity Sweep

• Maximum bars before the break of structure to search for the sweep

Filters

• Session filter ON/OFF
• Session start and end hours
• HTF alignment ON/OFF
• HTF timeframe
• HTF EMA period

Targets

• Show targets ON/OFF
• Target line colour
• Width
• Style

Overlap

• Maximum number of zones tracked — default 80

Display

• Bullish zone colour
• Bearish zone colour
• Breaker colour
• Show zone labels ON/OFF

Alerts

• Master switch
• Per-event switches
• Popup/sound/push/email channels
• Sound file
• Message prefix

LIMITATIONS

This indicator is a visual analysis aid.

It:

• Does not generate buy or sell signals
• Does not place orders
• Does not manage positions
• Does not analyse volume
• Does not analyse order flow
• Does not analyse market profile
• Does not use any data outside OHLC prices and ATR

Order block detection depends entirely on the input thresholds and swing length settings, and different settings will produce different zones.

The quality score is a heuristic and should not be treated as a statistical probability.

The lifecycle states are descriptive classifications of how price has interacted with a zone, not predictions of future behaviour.

The target projection identifies the nearest structural level in the direction of the expected move; it does not predict that price will reach it.

Past chart patterns and past zone behaviour are not indicative of future price movement.

Recommended products
With this trading tool, you can scan 15 markets simultaneously . Introducing, new trading indicator 2024 : ️ Dashboard Multi Currency Multi Time Frame Stochastic. There are at least two reasons why I created this trading tool : First , I'm bored of only observing one market. Second , I don't want to lose the entry moment in another market. That's why I want to know other market conditions at the same time. For this reason, I need a scanner that can scan the conditions of several markets si
Product Title: BID Wave Volume 1 - Smart Institutional Liquidity Tracker Short Description: Uncover institutional footprints! A powerful dual-timeframe volume indicator that detects real market turns by checking M1 volume order flow at current timeframe reversal zones. Full Description:  BID Wave Volume 2 is a revolutionary, advanced volume indicator designed for pro-scalpers and day traders. It bridges the gap between raw price action and institutional order flow. Unlike traditional indicators,
Femade Indie
Opengates Success International
Femade Indie Vs 1.0 is a simple but multi-currency monitoring Indicator created to instantly notify the trader when an attached currency pair is ready to buy, sell or give signal when such currency pair is getting ready for a big move either up or down. It does this by visual aids on the screen charts, sound and pop-up alerts. If it shows " Medium ", this means that the so called currency signal is almost gone but can still be traded provided the trader will not need a lot of pips which can be b
Institutional Fusion Levels Institutional Fusion Levels is a professional multi-timeframe support and resistance indicator designed to identify high-probability institutional price reaction zones using Previous Day, Previous Week, and Previous Month market structure levels. The indicator automatically plots key liquidity-based support and resistance areas directly on the chart and highlights powerful confluence zones where higher timeframe levels merge together. These fused zones often act as st
Crypto_Forex Indicator "Trend Entry Histogram" for MT4, No Repaint. - Trend Entry Histogram indicator can be used for search of entry signals into the trend direction once Entry_bar appears. - This indicator has unique feature - it takes both:   price and volume   for calculations. - Trend Entry Histogram can be in 2 colors: red for bearish trend and blue for bullish one. - Once you see steady trend (minimum 10 consecutive histogram bars of the same color) - wait for Entry_bar. - Entry signal i
Institutional Volume [tambangEA] Problem Most traders use too many separate tools to read the market. One indicator for volume, another for VWAP, another for support and resistance, another for momentum, and another for trade context. The result is usually the same: a crowded chart, mixed signals, slow decision-making, and late entries. Standard volume tools also leave an important gap. They may show activity, but they do not clearly explain: where the market is accepting price, where value is
KFX Symbol Changer
Peter Kariuki Thande
4 (1)
KFX SMA: Symbol Changer + Moving Average (3x) + ATR + RSI + Candle Timer. This indicator allows you to create a Symbol list and change between symbols of the current chart or Timeframe by selecting the appropriate button. On Chart there are three(3) multi timeframe Moving Averages shown (selected by you), ATR Value MTF ( selected by you -  helps with setting SL and TP), RSI Value MTF (selected by you) and a Candle Timer.   Features: - Symbol Changer : Change Symbol and Timeframe of Chart.   (s
FREE
Mini FFMV Dashboard and CSM
Opengates Success International
1 (1)
Mini Forex Market-View Dashboard and Mini-CSM Mini Full Forex Market View Dashboard is a miniature creation of FULL FOREX MARKET_VIEW Custom indicator created to give the Traders a full view of what is going on in the market but in a partial matter to make it conscise. It is useful most especially for those who don't like bogus indicators or those who have a PC with limited screen size. It uses a real time data to access the market and display every bit of information needed to make a successful
SPECIAL INTRODUCTORY OFFER: First 5 copies available at $59! Next price will increase to $149! GSL Smart Gold & Silver PRO is an institutional-grade, rule-based technical indicator custom-engineered specifically for trading XAUUSD (Gold) and XAGUSD (Silver) . By combining advanced trend tracking with dedicated Smart Sell and Buy Cover logic, this system filters out false market noise and delivers clear, actionable market structure signals. Key Advantages & Features 100% Non-Repaint Gua
A top-quality from the famous XSuper Trend indicator. It is completely loyal to the original algorithm, and implements many useful features Which includes Trend Indicators as Filters like MACD,CCI and Alligator. The Chefs Super Trend Plus Indicator is a great way to identify the current market trend. The indicator shows a clear distinction between uptrends and downtrends. The indicators has optional filters for sound signal. Suitable for the following trending pairs: EUR/USD, GBP/USD, USD/JPY,
Wall of worry
Illia Zhavarankau
Description: The Wall of Worry indicator allows you to assess market sentiment and possible reversals. The indicator represents three lines that are displayed in a separate window. Black line (trend) - the amount of volumes in the candle body. Red line (bears) - the amount of volumes in the upper shadow of the candlestick. Blue line (bulls) - the amount of volumes in the lower shadow of the candle. The idea is based on "Wall of Worry" - this is the periodic tendency of financial markets to
Liquidity Sentinel Pro – Multi-TF Dashboard & Rejection Alerts Description: Liquidity Sentinel Pro is a powerful all-in-one MT4 indicator designed to give traders a complete view of market dynamics by combining multi-timeframe trend analysis, supply/demand strength, and precision wick rejection alerts . This tool provides actionable insights on which currency pairs or assets are trending , highlights high-probability reversal points , and helps traders filter out noise , giving them the confiden
MTF Currency Strength Panel MT4
Narayanan Mohanan Mohanan Krishnan
MTF Currency Strength Panel for MetaTrader 4 A multi timeframe currency strength meter covering all 28 major forex pairs on one chart. This currency strength panel shows where the eight major currencies stand right now, and how each of the 28 major pairs has been moving across nine timeframes at once — M1 to MN1. Both readings sit on one chart, updated on a timer. Ranking pairs on their own is misleading. When a single currency moves, every pair containing it moves with it, so the top of a pair
FREE
MA Multi-Currencies  Multi-Timeframes Histogram BUY/SELL Indicator up to 6 currencies on time  calculations based on 6 time frames : M5, M15, M30, H1, H4, D1 Trading Strategies: **TREND shifts to UP trend when Green point appears after Red and Gray points -> Close SELL positions then add new BUY positions on new Green points  **TREND shifts to DOWN trend when Red point appears after Green and Gray points -> Close BUY  positions then add new SELL positions on new Red points ** Close BUY position
Fibo Reversals is an indicator which has carefully been put together to attempt to indicate a time period in which an ongoing trend is most probably exhausted and a new trend (actually a reversal trend) inadvertently begins. At this, it should be okay for the manual trader to be on the look out for good trading opportunities. Input Settings Father Fibo  – This Input Determines The Highest Price For The Chosen Input Period. Son Fibo  - This Input Determines The Lowest Price For The Chosen Input
The  Complete Smart Market Concepts  indicator is your all-in-one institutional-grade tool designed to decode  Smart Money Concepts (SMC)  and reveal how the "big players" — banks, hedge funds, and institutions — truly move the forex markets. Built specifically for traders who want to trade like the smart money, this  indicator automatically identifies and plots the most essential SMC elements directly on your charts, giving you crystal-clear insights without manual drawing or guesswork.  
Fibo Linear Channel
Igor Semyonov
4 (1)
Colored indicator of the linear channel based on the Fibonacci sequence. It is used for making trading decisions and analyzing market sentiment. The channel boundaries represent strong support/resistance levels, as they are the Fibonacci proportion levels. Users can select the number of displayed lines of channel boundaries on the chart by means of the input parameters. Attaching multiple instances of the indicator to the chart with different calculation periods leads to displaying a system of c
Buy & Sell Levels with Alerts is a comprehensive trading indicator that combines Stochastics, Previous Day Levels, Multi-Timeframe (MTF) Trend Meter , and rejection detection into one powerful tool. It helps traders quickly spot key support/resistance zones, trend direction, and high-probability reversal signals with visual arrows and automated alerts. Key Features: Stochastic Oscillator: Displays fast (%K) and slow (%D) lines in a separate window. Helps identify overbought and oversold conditio
ZoneDominator AI
Mohammad Ziad Abdelwahed Alkahlah
ZoneDominator AI — Adaptive Multi-Timeframe Support & Resistance Indicator Overview ZoneDominator AI is an advanced analytical indicator that continuously scans all timeframes to locate the most accurate and relevant Support & Resistance zones. It uses a unique combination of ATR volatility, Moving Averages, Price Action, and higher-timeframe confirmation to adapt in real time to market structure. You can choose your preferred trading style — Scalping, Intraday, or Swing — and the indicat
Description The Triangle Breakout Retest Dashboard Pro Multi Symbol is a multi symbol institutional style trading indicator designed for structure based breakout and retest trading. It automatically scans multiple currency pairs, detects triangle consolidation patterns, identifies breakout direction, and waits for a confirmed retest before generating entry signals. This system is built to help traders avoid false breakouts by focusing on confirmation based entries aligned with market structure b
The R Var Moving Average Indicator is a trend following indicator designed for die-hard trend followers. It is a quite popular forex trading indicator among stock traders, as well as commodity traders, and its popularity stems from its ability to deliver genuine money making signals to its users. The indicator is comprised of green and red dots that are placed on a sienna line. The green dot is pointing to a bullish signal, while the red dot depicts a bearish signal. Basic Trading Signals Buy S
FREE
Jerk Indicator
Safwan Rushdi Khalil Arekat
5 (2)
In physics, "Jerk" is the third time-derivative of position, with acceleration being the second derivative and velocity the first derivative. In technical analysis, the first derivative of price is the price momentum, with the second derivative,acceleration, being seldom used and the third derivative virtually unknown. The magnitude frequency response of a digital differentiator is a positive-slope straight line passing through zero frequency. Therefore, every instance of a digital signal differ
FREE
ToolBox 360 is the swiss knife of all indicators. It is full packed with useful tools to help you with your trading. It can be used to find best entry and exit points and help you to decide if you should open a trade or not. It shows market trends, candlestick formations outside / inside bars and you can sett time based allerts. Main features: Time based Fibonacci lines Choose a start and end time and the indicator shows you Fibonacci lines within the selected time range including range high a
Holy Trinity Volatility Indicator This indicator reflects the peak time of the day wherein there's is expected to be sharp price actions. It also presents the markets as just waking up from the dull and less volatile Asian (and or London) trading sessions into a bustling time of highly liquid price flows. NOTE: This indicator informs the trader ahead of peak price movements - one bar just before the real actions starts. Enter when the volatility line falls below the Tripple Exponential Moving Av
Top Gun Oscillators
Safwan Rushdi Khalil Arekat
5 (2)
Note : New in 1.6: the indicator now exports the trade signal (but not displayed). Go long with light blue. Go short with red. Exit otherwise. Signal to be imported to your EA using iCustom. This indicator provides Best of the Best linear filter momentum oscillators that I am aware of (Low Pass Differentiators, LPD's) . All of them are  recent developments by this developer, or other researchers. The oscillator line is the first buffer of the indicator, and can be called  in other indicators or
FREE
Smart Trend Forecasting Slope-Based Trend Analysis Indicator with Alert Support Overview Smart Trend Forecasting is a slope-based trend analysis indicator derived from a classic moving average trend model originally developed by Wizard Serg and referenced in Forex Magazine #104. The indicator is designed to monitor: Trend direction Momentum shifts Trend transition conditions Moving average slope behavior It includes visual markers and configurable alert notifications for trend state changes. Ma
Quantum Enigma
Yonny Pascal Ekwa Mezui
Quantum Enigma Quantum Enigma is a technical analysis indicator based on market structure and price action. It is designed to identify potential Bullish and Bearish setups around established price ranges. The indicator analyses market conditions and can apply several configurable confirmation and filtering conditions before displaying a signal. This allows traders to adjust the balance between signal frequency and selectivity according to their preferred trading approach. How It Works Quantum En
The arrow indicator "Cool volumes" is based on tick volumes on Mt4. The indicator itself tracks the number of volumes to buy or sell in a certain period of time (timeframe selection). And when there is an abnormal excess of the volume of sellers or buyers, it gives a signal to sell or buy. Colored histograms are drawn in the lower window, where the green color shows the predominance of buyers at the moment, which means a potential immediate reversal to increase in this price range. The red co
Oscillator helps determine the direction of the market Shows the direction of the price movement and is painted in the appropriate color. Allows you to conduct trend and counter trend trading It works on all timeframes, on any currency pairs, metals and cryptocurrency Can be used when working with binary options Distinctive features Does not redraw; Simple and clear settings; It works on all timeframes and on all symbols; Suitable for trading currencies, metals, options and cryptocurrency (Bitco
XP Speed Meter MT4: Measure True Market Momentum Description The XP Speed Meter MT4 is a unique and powerful custom indicator designed to reveal the true speed and momentum of price movement. Unlike standard indicators that rely on chart-bar closing prices, the Speed Meter dynamically calculates the volume of bullish and bearish ticks, and the resulting price movement, over a specific, user-defined time period. This innovative approach allows you to cut through the noise of standard timef
Buyers of this product also purchase
Trend SniperX MT4
Sarvarbek Abduvoxobov
5 (5)
Trend Sniper X is a multi-timeframe trend-following indicator for MetaTrader 5 that helps traders identify trend direction and potential reversal points with clarity and precision. For MT5: https://www.mql5.com/en/market/product/181101 Price Information: The current price is promotional and is subject to change as upcoming updates and new features are released. Code2Profit Channel Master the Market with Multi-Timeframe Analysis! How to Maximize Your Win Rate with Trend Sniper X: Key Rules & Sess
Scalper Vault
Oleg Rodin
5 (40)
Scalper Vault is a powerful, fully-equipped trading system designed for traders who want to achieve consistency in intraday trading . This high-precision indicator serves as a complete, standalone trading system that delivers institutional-grade analysis for both Forex and Binary Options traders. PLEASE CONTACT ME AFTER PURCHASE TO GET MY TRADING TIPS PLUS A GREAT BONUS! By eliminating the guesswork and complex manual analysis, Scalper Vault allows you to focus purely on execution using easy t
Currency Strength Wizard is a very powerful indicator that provides you with all-in-one solution for successful trading. The indicator calculates the power of this or that forex pair using the data of all currencies on multiple time frames. This data is represented in a form of easy to use currency index and currency power lines which you can use to see the power of this or that currency. All you need is attach the indicator to the chart you want to trade and the indicator will show you real str
PRO Renko System
Oleg Rodin
5 (31)
PRO Renko System is a highly accurate trading system specially designed for trading RENKO charts. The ARROWS and Trend Indicators DO NOT REPAINT! The system effectively neutralizes so called market noise giving you access to accurate reversal signals. The indicator is very easy to use and has only one parameter responsible for signal generation. You can easily adapt the tool to any trading instrument of your choice and the size of the renko bar. I am always ready to provide extra support to help
SR Liquidity
Oleg Rodin
5 (2)
SR Liquidity is a trading indicator designed to reveal the hidden zones where market liquidity concentrates and price reacts most strongly. These special liquidity areas act as powerful support and resistance levels, giving you a clear map of where the market is most likely to reverse. Instead of drawing ordinary Support/Resistance lines, SR Liquidity analyzes real price behavior to detect the zones where buying and selling pressure accumulate. These are actually the pools of liquidity that driv
Atomic Analyst
Issam Kassas
5 (14)
Atomic Analyst — MetaTrader 4 For product questions, setup guidance, or technical support, message me directly here on MQL5. The indicator turns complex market calculations into simple visual signals, color-coded candles, trend readings, stop-loss levels, and multiple take-profit zones that traders can understand quickly and use in real market conditions. Main Trading Uses: Scalping and intraday trading: Designed for fast decision-making, clear arrows, alerts, candle colors, and structured entry
Smart Trend Trading System is a chart indicator for MetaTrader 4 that brings trend information, entry and exit signals, and price levels into one workspace. It combines 10+ trading tools into one system, including trend detection, reversal zones, smart cloud, trailing stop logic, support and resistance, candle coloring, alerts, and multi-timeframe analysis. The system is designed to help you trade different market conditions: Trending markets: Identify the main trend, detect pullbacks, follow mo
SIO Oscillator: Self-Optimizing Semivariance Imbalance Oscillator Buy the indicator and get the Expert Advisor based on it for FREE. Most oscillators treat all price movement the same. SIO separates upside and downside market pressure and measures the imbalance between them, showing which side is really in control: buyers or sellers. When the imbalance reaches an extreme, SIO prints a clear signal with entry, Stop Loss and Take Profit levels. What makes SIO different is that it doesn’t rely on f
Quant Direction
Georgios Kalomoiropoulos
Quant Direction is a 3 dimensional market analysis tool. It provides a purely objective, algorithmic view of the market by calculating exact percentage-based biases across multiple dimensions simultaneously. Developed utilizing advanced AI modeling tools and subjected to thorough testing, this algorithm is engineered to read the market with unique precision. It can analyze any currency pair or financial instrument available on your platform.  Quant Direction is the ideal tool whether you are a S
Trend Lines PRO
Roman Podpora
5 (2)
TREND LINES PRO    helps understand where the market is truly changing direction. The indicator shows real trend reversals and points where major players re-enter. You see   BOS lines   Trend changes and key levels on higher timeframes — without complex settings or unnecessary noise. Signals don't repaint and remain on the chart after the bar closes. VERSION MT 5     -     Reveals its maximum potential when paired with the   RFI LEVELS PRO  indicator What the indicator shows: Real shifts   tren
AW Prime Oscillator
AW Trading Software Limited
5 (1)
A combination of two oscillators. The first one displays the entry points, the second shows the current trend . The indicator can display oscillator signals by arrows in two modes, all fast oscillator signals or signals only in the direction of the current trend. It has a multi-timeframe panel and three types of signal notifications. Benefits: Suitable for day and scalping trading Trend filtering Simple and sensitive setup Multi-timeframe panel Suitable for integration into an advisor. Works on
M1 Sniper
Oleg Rodin
4.97 (30)
M1 SNIPER  is an easy to use trading indicator system. It is an arrow indicator which is designed for M1 time frame. The indicator can be used as a standalone system for scalping on M1 time frame and it can be used as a part of your existing trading system. Though this trading system was designed specifically for short-term trading, it still can be helpful for all traders. This trading system can be used with any forex pair and time frame, though lower time frames are recommended from M1 up to M
Hidden Cycles
Lev Vladimirovic Marushkin
5 (1)
The Only 100% Universal Tool! Stop trading against nature! This is your chance to secure the only indicator rooted in the absolute laws that govern the entire universe. Most tools guess—this one reveals the truth. Buy another toy or buy the truth. Your choice... Based on Universal Laws — NOT Some Guy’s Algorithm: Let the market adjust to the Hidden Cycles Geometry — not the other way around. Most indicators are based on a man-made formula. They often lag, fail over time, or need constant re-o
Neo Wave PRO
Nikolay Raykov
5 (1)
Price & Time Market Structure Indicator A professional market structure tool that analyzes waves through both price and time — not price alone. Main Description NeoWave PRO is a professional market structure indicator for MetaTrader 4 designed for traders who want to move beyond traditional one-dimensional wave tools such as ZigZag, swing indicators, and basic high/low systems. Most wave indicators analyze only one thing: Price. But a real market wave is not only a price movement. A true wave de
PZ Turning Points MT4
PZ TRADING SLU
1 (1)
Identify key turning points with reliable fractal analysis This indicator examines the price structure of fractals of different periods to determine possible reversal points in the market, providing timing to positional traders that already have a fundamental or technical valuation model. Unlike its younger brother, Reversal Fractals , this indicator won't miss reversals because of the period selected, and will find reversal fractals on a zig-zag fashion, ignoring those reversals which do not
CRT Multi-Timeframe Market Structure & Liquidity Sweep Indicator Non-Repainting | Multi-Asset | MT5 Version Available MT5 Version:   https://www.mql5.com/en/market/product/162075 Full User Guide — explains what each feature does and why:   https://www.mql5.com/en/blogs/post/767525 Quick Start User Guide  — explains how to configure and in what order:  https://www.mql5.com/en/blogs/post/767540 Indicator Overview CRT Ghost Candle HTF Fractal is a complete institutional-grade market structure too
Gann Time Clusters
Martin Eshleman
2.5 (2)
Gann Time Clusters Indicator This indicator is based on W. D. Gann's Square of 9 method for the time axis. It uses past market reversal points and applies the mathematical formula for Gann's Square of 9 and then makes projections into the future. A date/time where future projections line up is called a 'time cluster'. These time clusters are drawn as vertical lines on the right side of the chart where the market has not advanced to yet. A time cluster will result in a market reversal point (ex.
Neuro Poseidon MT4
Daria Rezueva
4.74 (46)
Neuro Poseidon is a new indicator by Daria Rezueva. It combines precise trading signals with adaptive TP/SL levels - creating best possible trades as a result! Message me and get  Neuro Poseidon Assistant  as a gift to automize your trading process! What makes it stand out? 1. Proven profitability on all assets and timeframes 2. Only confirmed BUY and SELL signals present on the chart 3. Adaptive TP & SL levels generated by the software for each trade 4. Easy to understand - suitable for all
Non repaint MT4
Yan Zhen Du
5 (1)
This is a professional chart indicator designed for traders focused on stability and clear price action. It helps filter market noise and provides clear visual entry and exit zones for your trading decisions. Core Features: Strictly Non-Repainting: The system is built with strict non-repaint logic. What you see on the chart is the true historical performance. Confirmed Signals: Signals are triggered and confirmed only after the candle closes . Once a trading arrow appears on a closed candle, it
Forex Breath System is a trend based trading system which can be used with any market. You can use this system with currencies, metals, commodities, indices, crypto and even stocks. It can also be used with any time frame. The system is universal. It shows trend and provides arrow signals with the trend. The indicator can also provide you with a special type of alerts when the signals appear in the direction of the trend which makes trend trading an easy task. The indicator is very easy to use a
Advanced Supply Demand
Bernhard Schweigert
4.91 (302)
Trading Special – 30% OFF Best Solution for any Newbie or Expert Trader! This indicator is a unique, high quality and affordable trading tool because we have incorporated a number of proprietary features and a new formula. With this update, you will be able to show double timeframe zones. You will not only be able to show a higher TF but to show both, the chart TF, PLUS the higher TF: SHOWING NESTED ZONES. All Supply Demand traders will love it. :) Important Information Revealed Maximize the pot
Super Signal – Skyblade Edition Professional No-Repaint / No-Lag Trend Signal System with Exceptional Win Rate | For MT4 / MT5 It works best on lower timeframes, such as 1-minute, 5-minute, and 15-minute charts. Core Features: Super Signal – Skyblade Edition is a smart signal system designed specifically for trend trading. It applies a multi-layered confirmation mechanism to detect only strong, directional moves supported by real momentum. This system does not attempt to predict tops or bottoms
Liquidity Scalper System: a liquidity-based trading system in indicator form. Most indicators only show an arrow, and the trader then has to decide where the stop goes, where the target is and whether the signal can be trusted at all. Liquidity Scalper System covers the full trade cycle: it finds liquidity pools, gives a signal when they are broken, immediately calculates Entry, Stop Loss and three targets, and shows statistics and out-of-sample test results on the panel. The system picks its o
Gann Made Easy
Oleg Rodin
4.84 (174)
Gann Made Easy is a professional and easy to use Forex trading system which is based on the best principles of trading using the theory of W.D. Gann. The indicator provides accurate BUY and SELL signals including Stop Loss and Take Profit levels. You can trade even on the go using PUSH notifications. PLEASE CONTACT ME AFTER PURCHASE TO GET TRADING  INSTRUCTIONS   AND GREAT EXTRA INDICATORS  FOR FREE! Probably you already heard about the Gann trading methods before. Usually the Gann theory is a
Trading Special –40% OFF Best Solution for any Newbie or Expert Trader! This Indicator is a unique, high quality and affordable trading tool because we have incorporated a number of proprietary features and a new formula. With only ONE chart you can read Currency Strength for 28 Forex pairs! Imagine how your trading will improve because you are able to pinpoint the exact trigger point of a new trend or scalping opportunity? User manual: click here Looking for the MT5 version? Click here: https:/
Gold Channel is a volatility-based indicator, developed with a specific timing algorithm for the XAUUSD pair, which consists of finding possible corrections in the market. This indicator shows two outer lines, an inner line (retracement line) and an arrow sign, where the theory of the channel is to help identify overbought and oversold conditions in the market. The market price will generally fall between the boundaries of the channel. If prices touch or move outside the channel it is a tradi
Trading Special – 30% OFF Best Solution for any Newbie or Expert Trader! This dashboard software is working on 28 currency pairs plus one. It is based on 2 of our main indicators (Advanced Currency Strength 28 and Advanced Currency Impulse). It gives a great overview of the entire Forex market plus Gold or 1 indices. It shows Advanced Currency Strength values, currency speed of movement and signals for 28 Forex pairs in all (9) timeframes. Imagine how your trading will improve when you can watch
TDI Multi Timeframe Scanner: This Dashboard indicator uses the TDI (Trader's Dynamic Index) Indicator to find best trades. Read detailed How to Use Guide: https://www.mql5.com/en/blogs/post/758252 Extra indicators also available in above post. Checks for: - SharkFin Pattern Free indicator for SharkFin: https://www.mql5.com/en/market/product/42405/ - TDI Trend: Strong/Weak Trend Up/Down - TDI Signal: Strong/Medium/Weak Signal for Buy/Sell - Consolidation - Overbought/Oversold - Volatility Ban
Italo Trend Indicator
Italo Santana Gomes
4.74 (34)
BUY INDICATOR AND GET EA FOR FREE AS A BONUS + SOME OTHER GIFTS! ITALO TREND INDICATOR  is the best trend indicator on the market, the Indicator works on all time-frames and assets, indicator built after 7 years of experience on forex and many other markets. You know many trend indicators around the internet are not complete, does not help, and it's difficult to trade, but the Italo Trend Indicator is different , the Italo Trend Indicator shows the signal to buy or sell, to confirm the signal t
Top Bottom Tracker is an indicator based on sophisticated algorithms that analyse the market trend and can detect the highs and lows of the trend / MT5 version . The price will progressively increase until it reaches 500$. Next price --> $99 Features No repainting This indicator does not change its values when new data arrives Trading pairs All forex pairs Timeframe     All timeframes Parameters ==== Indicator configuration ==== Configuration parameter // 40 (The higher the value, the
More from author
Candlestick Confluence Detector Candlestick Confluence Detector scores candlestick confluence across your chart and up to three higher timeframes — without manually cross-checking each one. It detects 16 classic price-action patterns, grouped into three dedicated engines: Rejection Continuation Warning Each pattern receives a 0–100 confluence score. Every label is traceable to a documented, user-adjustable rule set. KEY FEATURES • 16 candlestick patterns across 3 purpose-built engines: Rejecti
StructuraX
Ibe Hyginus Ugwoke
StructuraX Non-repainting market structure analysis with a mechanical bias score, optional higher-timeframe context, key levels, and risk-based reference calculations. Overview StructuraX is a rule-based market structure indicator designed to turn price action into a structured analytical framework. It analyses the current chart timeframe for: Market structure: HH/HL and LH/LL Confirmed Break of Structure (BOS) Dominant impulse and retracement depth Momentum thrust Compression Key structural zon
Filter:
No reviews
Reply to review