Order Block Intelligence Engine

  • Göstergeler
  • Ibe Hyginus Ugwoke
    Ibe Hyginus Ugwoke
    • MQL4/MQL5 Developer | Custom EAs & Indicators at  Independent / Self-employed
    • Nijerya
    • 275
    I’m an MQL4/MQL5 developer and active trader. I build and personally test the trading tools I develop, which gives me a practical understanding of edge cases, signal timing, and the differences between backtest and live behaviour.
  • Sürüm: 1.2
  • Etkinleştirmeler: 5
Order Block Intelligence Engine v1.02

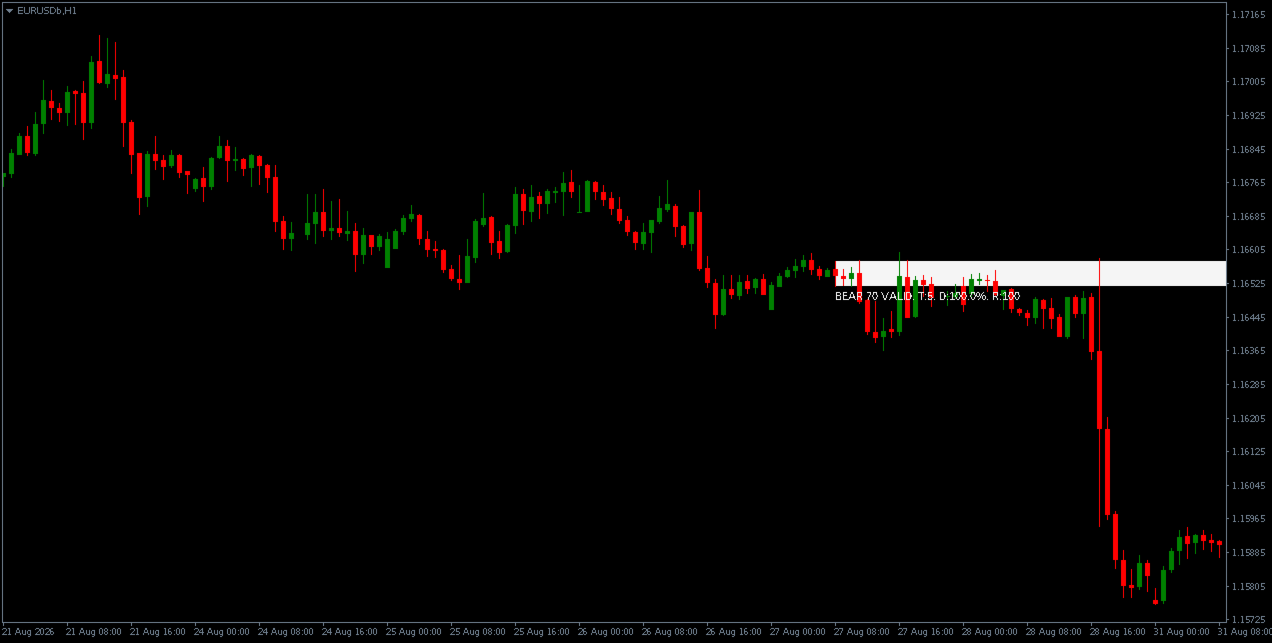
Detects order block zones using confirmed swing structure, break-of-structure with displacement, and a multi-factor quality score. Tracks each zone through a five-state lifecycle and optionally projects a next target level.

OVERVIEW

The indicator identifies order block zones on the current chart timeframe.

Each zone is defined by the origin candle (or base of consecutive candles) that preceded a break of structure, and by the swing point whose break confirmed the move.

Zones are only created after the break of structure is confirmed by a closed bar.

Each zone is evaluated by a heuristic quality score between 0 and 100, computed from six weighted components. The score is used to filter zones below a user-configurable threshold.

Each zone then transitions through a lifecycle of states as price interacts with it, and optionally projects a next target level drawn as a horizontal line.

Detection uses only OHLC prices and ATR.

It does not use volume, order flow, market profile, tick data, or any external source.

It does not identify institutional activity and does not claim to do so.

KEY FEATURES

• Dual swing detection: internal (minor) and external (major) swing points, weighted differently in the score
• Break-of-structure confirmation: zones require a closed bar that breaks the prior swing extreme with a minimum displacement body
• Multi-candle origin detection: the origin zone walks back through the base candles preceding the break, ending at the last opposite candle before the break of structure, up to a user-configurable maximum
• Multi-factor scoring: structure, displacement, liquidity sweep, origin base quality, fair value gap, and higher-timeframe alignment
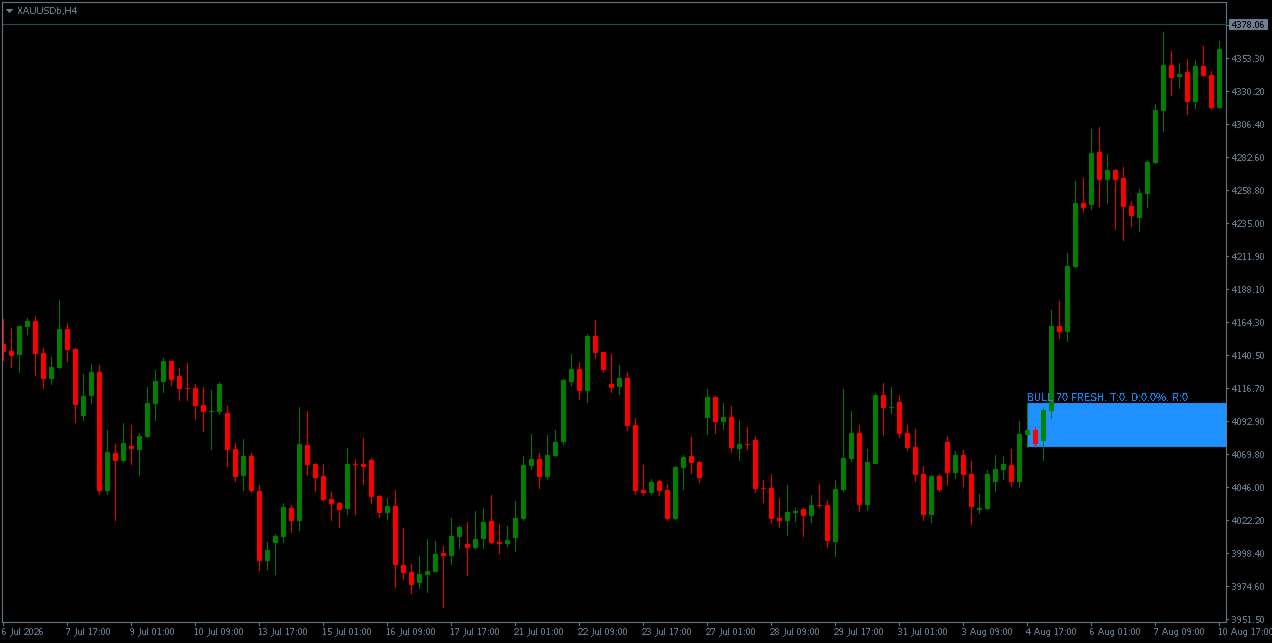
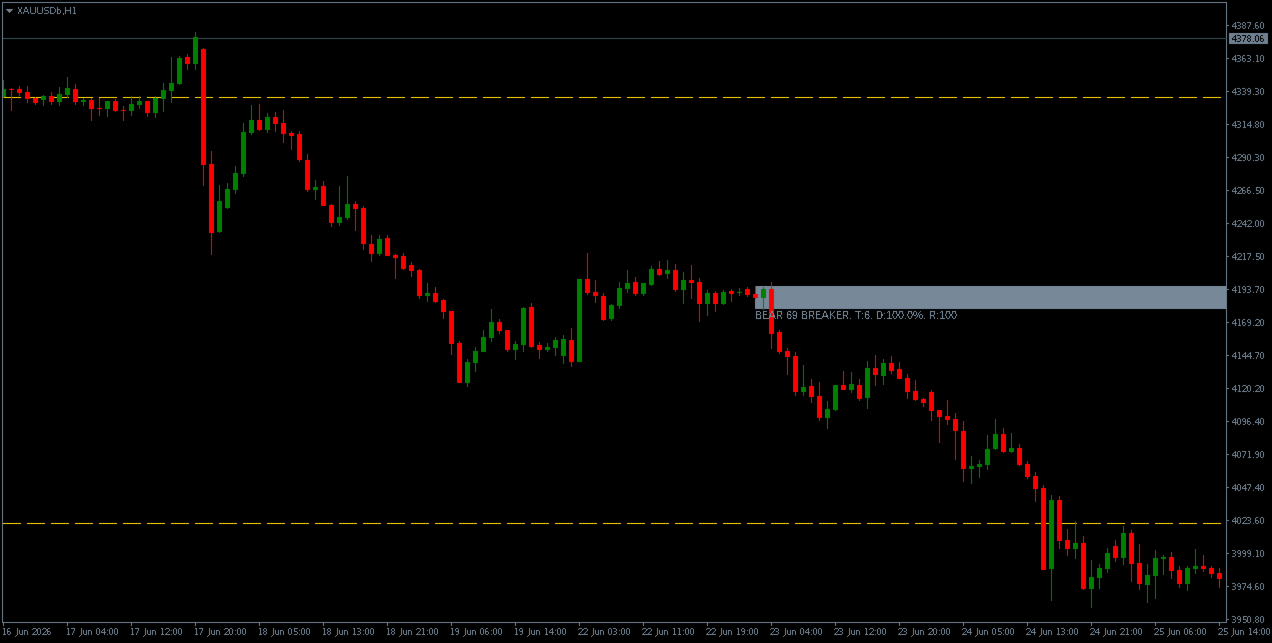
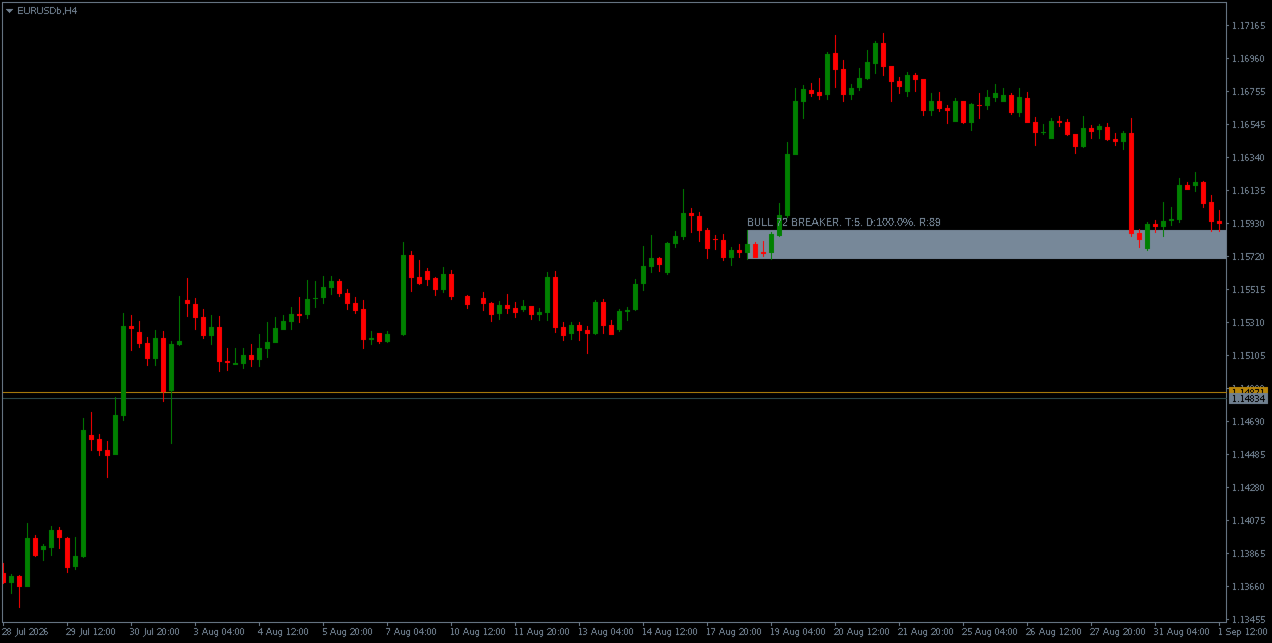
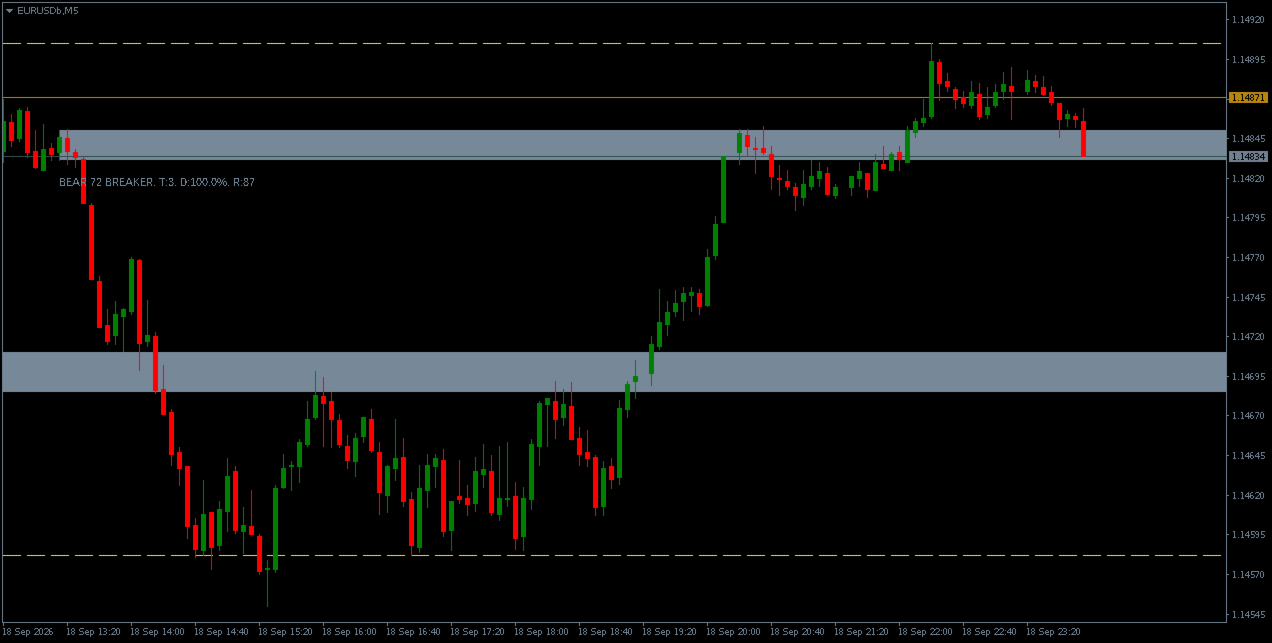
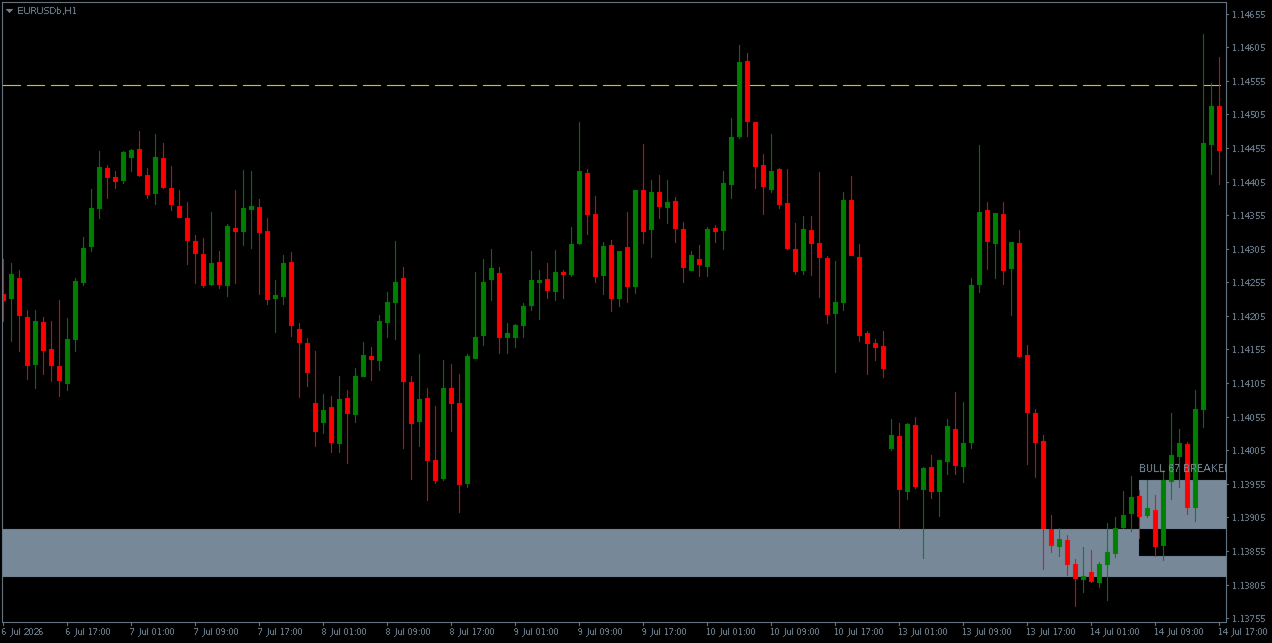
• Lifecycle state tracking: FRESH, TESTED, REACTING, VALID, BREAKER
• Optional target projection: the next opposite-type zone or unbroken swing level is drawn as a horizontal line
• Optional session filter, HTF alignment filter, and reaction timeout
• Overlap management: zones whose range overlaps an existing same-type zone by more than 50 percent are not drawn
• Alerts on new zone, first touch, reaction confirmed, and zone invalidated

ABOUT THE SCORE

Each zone produces a score between 0 and 100.

The score is a heuristic value computed from six weighted components.

The score is not:

• A probability
• A win rate
• A validated measure of trading outcome

A score of 75 does not mean the zone has a 75 percent chance of working.

It means the zone satisfied more of the six conditions that the scoring model rewards.

Every component weight is exposed as an input parameter, so users can adjust the emphasis of the model or disable components entirely.

Default minimum score for display: 67

WHAT THE SCORE EVALUATES

Structure Break

Zones derived from confirmed external swings receive more weight than zones derived from internal swings.

External swings are longer-term and structurally more significant than internal swings.

Displacement Quality

The break-of-structure candle is evaluated by:

• Body size
• Proportion of the range occupied by the body
• Location of the close within its range

A candle with a large body, small wicks, and a close at the extreme of its range receives the highest displacement credit.

Liquidity Sweep

If a bar between the break-of-structure candle and a recent opposite swing took out a prior swing level and then closed back inside, the zone receives the full liquidity credit.

This component is present or absent.

The default lookback window is configured wide enough that both internal-length and external-length sweeps are reachable under default settings.

Origin Base Quality

The origin zone is evaluated by:

• How tight its range is relative to ATR
• How many candles it contains

Tighter zones and larger bases score higher.

This component is scaled down when the break-of-structure candle's displacement falls below the configured gate, so a weakly displaced break receives only partial origin credit rather than none.

Fair Value Gap

If a three-bar imbalance exists between the origin zone and the break-of-structure candle in the direction of the move, the zone receives the full FVG credit.

This component is present or absent.

Higher-Timeframe Alignment

If enabled, the closing price of the break-of-structure bar is compared to an EMA on a user-selected higher timeframe.

If price is on the correct side of the EMA, the zone receives the full alignment credit.

This component can be disabled entirely, in which case its weight is not awarded to any zone.

The alignment uses the last fully completed higher-timeframe bar, so the score for a historical zone does not change once its break-of-structure bar has closed.

If the selected higher timeframe is not above the chart timeframe, or if insufficient higher-timeframe history is loaded, the component contributes nothing rather than awarding credit it cannot verify.

LIFECYCLE STATES

Each zone transitions through states as price evolves:

FRESH

The zone has been created and price has not returned to it.

Highest-potential state.

TESTED

Price has entered the zone at least once.

The touch count and maximum penetration percentage are updated on each touch.

REACTING

Price has tested the zone and has begun moving away, but the reversal has not yet been confirmed by a close beyond the zone boundary.

VALID

Price has closed beyond the far edge of the zone in the expected direction.

The reaction score is computed from the distance of the closing bar from the zone.

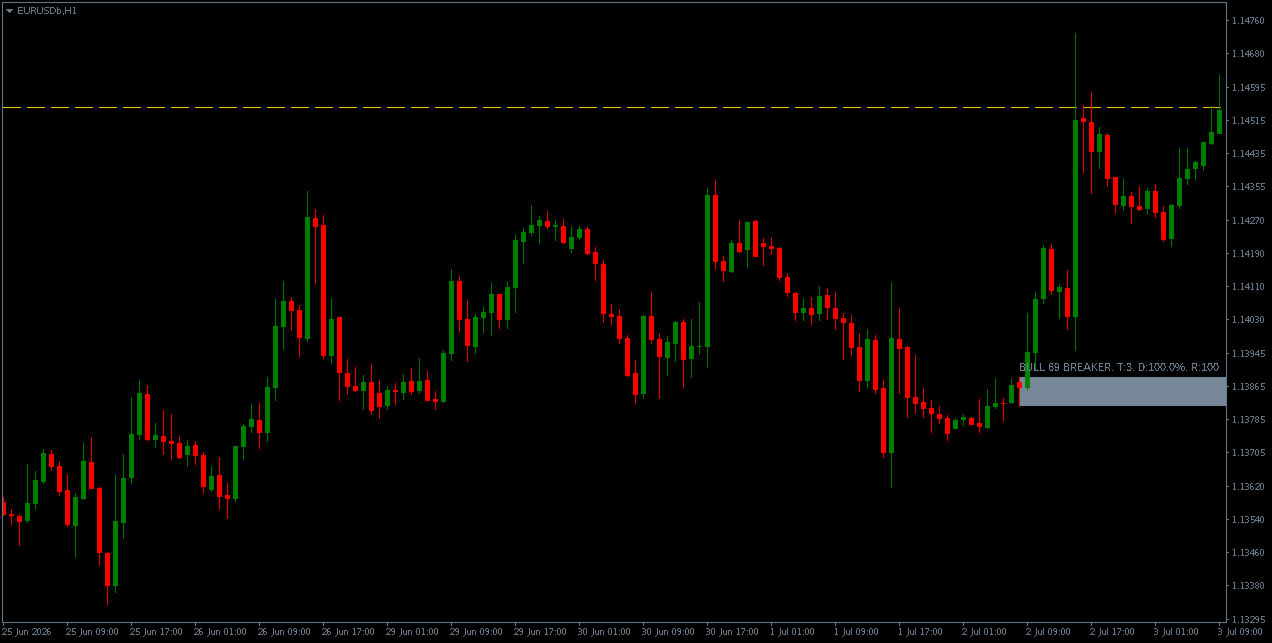
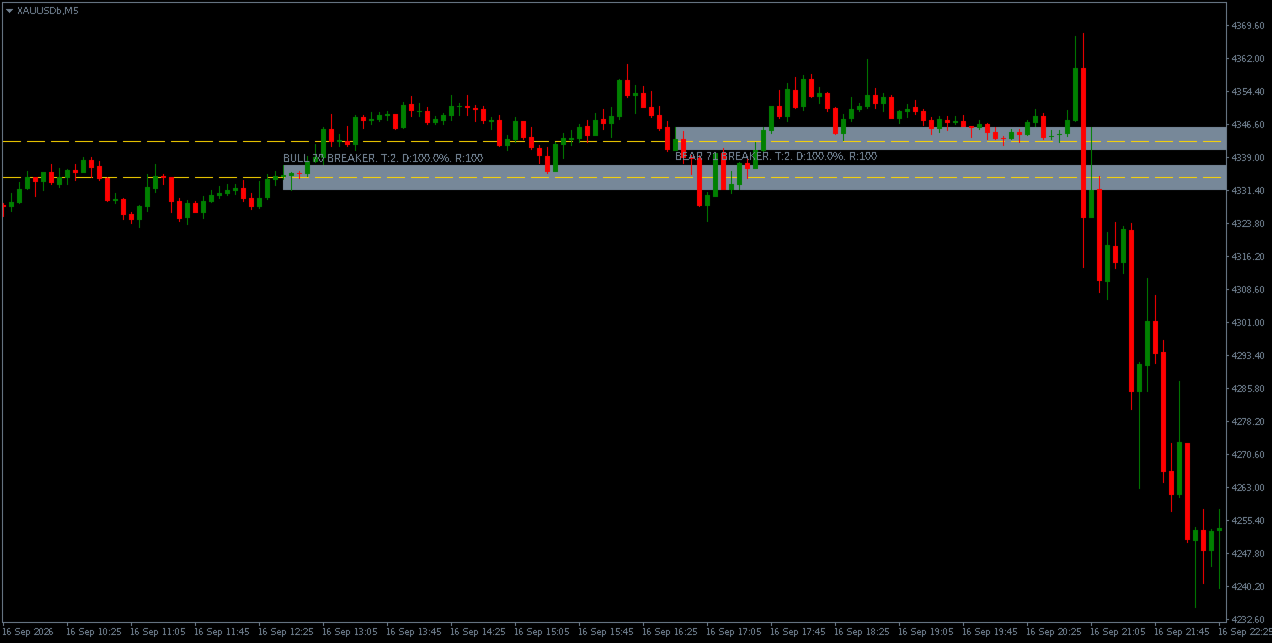
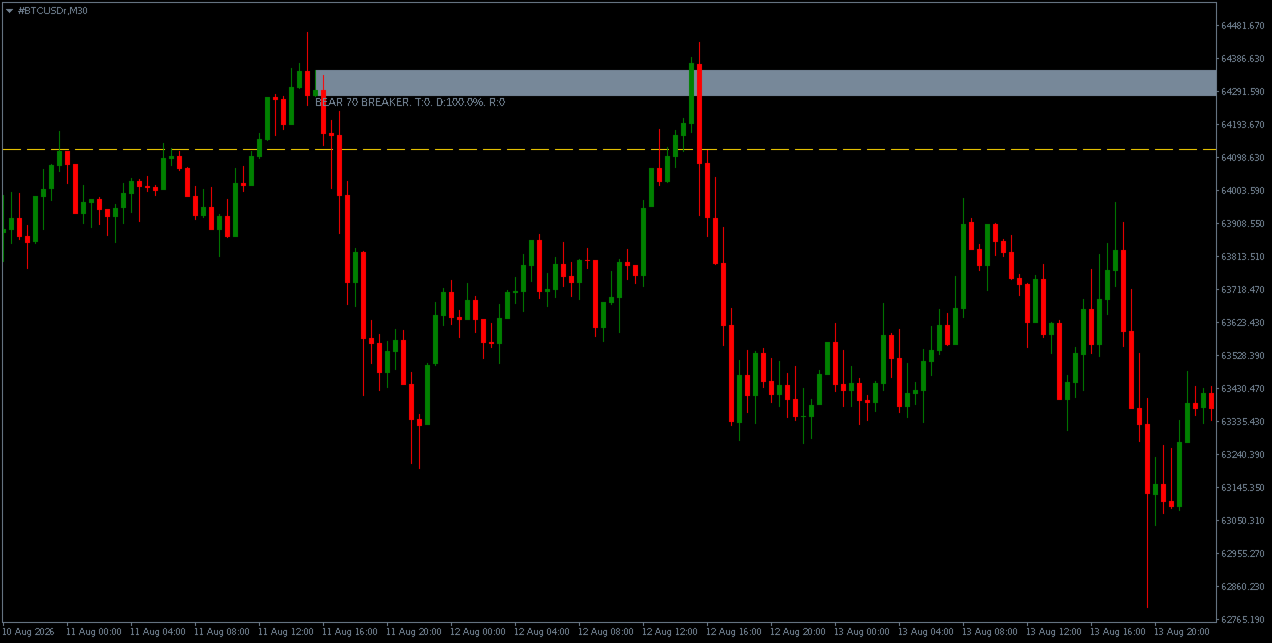
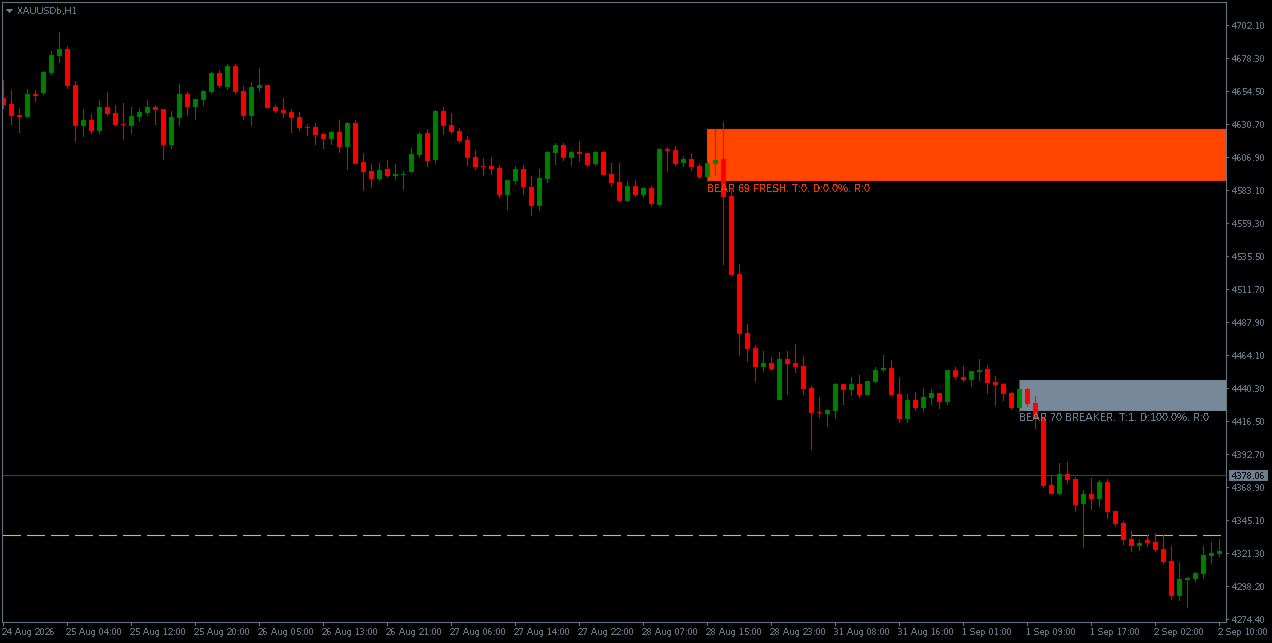
BREAKER

Price has closed through the far side of the zone in the opposite direction.

The zone is considered invalidated.

Breakers are drawn in a distinct colour and are capped at the break bar rather than extending forward.

They:

• Do not project targets
• Do not participate in same-type overlap checks
• Are not used as targets for other zones
• Are not automatically treated as an opposite-direction support or resistance level

Once a zone reaches VALID, it stays VALID until price closes through the far side of the zone and the state becomes BREAKER.

A wick or partial overlap back into a VALID zone updates the touch count and penetration percentage for descriptive purposes, but does not demote the zone to TESTED or reset the reaction score.

If a zone remains in REACTING for more than InpReactionTimeoutBars bars after the last touch without a decisive close beyond the zone boundary, it reverts to TESTED.

A zone already in TESTED is unaffected.

TARGET PROJECTION

For each displayed zone, if InpShowTargets is enabled, the indicator identifies a next logical target in the direction of the expected move.

The target is selected as follows:

1. Nearest opposite-type zone

The nearest opposite-type zone whose nearest edge lies ahead of the current zone is used.

For a bullish zone, this is the low of the nearest bearish zone above.

For a bearish zone, this is the high of the nearest bullish zone below.

2. Nearest unbroken swing

If no opposite zone exists, the nearest unbroken swing high for bullish zones or swing low for bearish zones is used.

A swing is considered broken if any close after the swing has exceeded its level.

The target is drawn as a horizontal line with user-configurable colour, width, and style.

If InpAlertOnTargetHit is enabled, an alert fires the first time the closing price of the last completed bar reaches the target.

Breaker zones do not project targets.

FILTERS

Session Filter

When enabled, zones whose break-of-structure bar falls outside the configured server-time hours are not created.

Higher-Timeframe Alignment

When enabled, zones must satisfy the EMA alignment condition described in the scoring section.

The filter has no effect if the selected higher timeframe is not above the chart timeframe.

Reaction Timeout

As described in the lifecycle section.

Overlap Management

Zones whose range overlaps an existing same-type zone by more than 50 percent are rejected.

ALERTS

Optional alerts are provided for four events:

• New qualifying zone created
• Zone touched for the first time
• Zone state transitions to VALID — reaction confirmed
• Zone state transitions to BREAKER — invalidated
• Optional: target level reached

Each event type is controlled by its own input.

Three notification channels are supported:

• Popup alert with sound
• Push notification
• Email

Alerts fire only on live bar events.

Historical replay during initial load does not produce alerts.

Any target that is already behind current price when the indicator is first attached does not fire a retrospective alert.

INPUT PARAMETERS

Swing Detection

• Internal swing length
• External swing length
• Maximum bars after swing to search for the break of structure
• Maximum candles in the origin base

Zone Validity

• Minimum zone range as ATR multiple
• Minimum break-of-structure body as ATR multiple

Scoring

• Minimum score to display
• Six component weights
• Displacement gate threshold
• Compression discount multiplier
• Maximum opposite candle body-to-range ratio for origin core

Liquidity Sweep

• Maximum bars before the break of structure to search for the sweep

Filters

• Session filter ON/OFF
• Session start and end hours
• HTF alignment ON/OFF
• HTF timeframe
• HTF EMA period

Targets

• Show targets ON/OFF
• Target line colour
• Width
• Style

Overlap

• Maximum number of zones tracked — default 80

Display

• Bullish zone colour
• Bearish zone colour
• Breaker colour
• Show zone labels ON/OFF

Alerts

• Master switch
• Per-event switches
• Popup/sound/push/email channels
• Sound file
• Message prefix

LIMITATIONS

This indicator is a visual analysis aid.

It:

• Does not generate buy or sell signals
• Does not place orders
• Does not manage positions
• Does not analyse volume
• Does not analyse order flow
• Does not analyse market profile
• Does not use any data outside OHLC prices and ATR

Order block detection depends entirely on the input thresholds and swing length settings, and different settings will produce different zones.

The quality score is a heuristic and should not be treated as a statistical probability.

The lifecycle states are descriptive classifications of how price has interacted with a zone, not predictions of future behaviour.

The target projection identifies the nearest structural level in the direction of the expected move; it does not predict that price will reach it.

Past chart patterns and past zone behaviour are not indicative of future price movement.

Önerilen ürünler
Bu işlem aracıyla aynı anda 15 piyasayı tarayabilirsiniz. Karşınızda yeni ticaret göstergesi 2024: ️ Kontrol Paneli Çoklu Para Birimi Çoklu Zaman Çerçevesi Stokastik. Bu ticaret aracını oluşturmamın en az iki nedeni var: Öncelikle tek piyasayı gözlemlemekten sıkıldım. İkincisi, başka bir pazara giriş anını kaybetmek istemiyorum. Bu yüzden aynı zamanda diğer piyasa koşullarını da bilmek istiyorum. Bu nedenle birden fazla piyasanın koşullarını aynı anda tarayabilecek bir tarayıcıya ihtiyac
Product Title: BID Wave Volume 1 - Smart Institutional Liquidity Tracker Short Description: Uncover institutional footprints! A powerful dual-timeframe volume indicator that detects real market turns by checking M1 volume order flow at current timeframe reversal zones. Full Description:  BID Wave Volume 2 is a revolutionary, advanced volume indicator designed for pro-scalpers and day traders. It bridges the gap between raw price action and institutional order flow. Unlike traditional indicators,
Femade Indie
Opengates Success International
Femade Indie Vs 1.0 is a simple but multi-currency monitoring Indicator created to instantly notify the trader when an attached currency pair is ready to buy, sell or give signal when such currency pair is getting ready for a big move either up or down. It does this by visual aids on the screen charts, sound and pop-up alerts. If it shows " Medium ", this means that the so called currency signal is almost gone but can still be traded provided the trader will not need a lot of pips which can be b
Institutional Fusion Levels (Kurumsal Füzyon Seviyeleri) Institutional Fusion Levels, önceki gün, önceki hafta ve önceki ay piyasa yapısı seviyelerini kullanarak yüksek olasılıklı kurumsal fiyat reaksiyon bölgelerini belirlemek için tasarlanmış profesyonel bir çoklu zaman dilimi destek ve direnç göstergesidir. Gösterge, likiditeye dayalı önemli destek ve direnç alanlarını otomatik olarak grafikte çizer ve daha yüksek zaman dilimi seviyelerinin birleştiği güçlü konfluans bölgelerini vurgular. Bu
MT4 için "Trend Giriş Histogramı" Crypto_Forex Göstergesi, Yeniden Boyama Yok. - Trend Giriş Histogramı göstergesi, Entry_bar (Giriş Çubuğu) görüntülendiğinde trend yönüne giriş sinyallerini aramak için kullanılabilir. - Bu göstergenin benzersiz bir özelliği vardır - hesaplamalar için hem fiyatı hem de hacmi kullanır. - Trend Giriş Histogramı 2 renkte olabilir: düşüş trendi için kırmızı, yükseliş trendi için mavi. - Sabit trendi gördüğünüzde (aynı renkte en az 10 ardışık histogram çubuğu) - Ent
Kurumsal Hacim [tambangEA] Sorun Çoğu yatırımcı piyasayı okumak için çok fazla ayrı araç kullanıyor. Hacim için bir gösterge, VWAP için bir başka gösterge, destek ve direnç için bir başka gösterge, momentum için bir başka gösterge ve işlem bağlamı için bir başka gösterge. Sonuç genellikle aynı: kalabalık bir grafik, karışık sinyaller, yavaş karar verme ve geç girişler. Standart hacim araçları ayrıca önemli bir boşluk bırakıyor. Aktiviteyi gösterebilirler, ancak şunları açıkça açıklamazlar: pi
KFX Symbol Changer
Peter Kariuki Thande
4 (1)
KFX SMA: Symbol Changer + Moving Average (3x) + ATR + RSI + Candle Timer. This indicator allows you to create a Symbol list and change between symbols of the current chart or Timeframe by selecting the appropriate button. On Chart there are three(3) multi timeframe Moving Averages shown (selected by you), ATR Value MTF ( selected by you -  helps with setting SL and TP), RSI Value MTF (selected by you) and a Candle Timer.   Features: - Symbol Changer : Change Symbol and Timeframe of Chart.   (s
FREE
Mini FFMV Dashboard and CSM
Opengates Success International
1 (1)
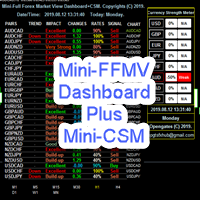
Mini Forex Market-View Dashboard and Mini-CSM Mini Full Forex Market View Dashboard is a miniature creation of FULL FOREX MARKET_VIEW Custom indicator created to give the Traders a full view of what is going on in the market but in a partial matter to make it conscise. It is useful most especially for those who don't like bogus indicators or those who have a PC with limited screen size. It uses a real time data to access the market and display every bit of information needed to make a successful
SPECIAL INTRODUCTORY OFFER: First 5 copies available at $59! Next price will increase to $149! GSL Smart Gold & Silver PRO is an institutional-grade, rule-based technical indicator custom-engineered specifically for trading XAUUSD (Gold) and XAGUSD (Silver) . By combining advanced trend tracking with dedicated Smart Sell and Buy Cover logic, this system filters out false market noise and delivers clear, actionable market structure signals. Key Advantages & Features 100% Non-Repaint Gua
A top-quality from the famous XSuper Trend indicator. It is completely loyal to the original algorithm, and implements many useful features Which includes Trend Indicators as Filters like MACD,CCI and Alligator. The Chefs Super Trend Plus Indicator is a great way to identify the current market trend. The indicator shows a clear distinction between uptrends and downtrends. The indicators has optional filters for sound signal. Suitable for the following trending pairs: EUR/USD, GBP/USD, USD/JPY,
Wall of worry
Illia Zhavarankau
Description: The Wall of Worry indicator allows you to assess market sentiment and possible reversals. The indicator represents three lines that are displayed in a separate window. Black line (trend) - the amount of volumes in the candle body. Red line (bears) - the amount of volumes in the upper shadow of the candlestick. Blue line (bulls) - the amount of volumes in the lower shadow of the candle. The idea is based on "Wall of Worry" - this is the periodic tendency of financial markets to
Liquidity Sentinel Pro – Çok Zamanlı Gösterge Paneli & Mum Ret Uyarıları Açıklama: Liquidity Sentinel Pro, trader’lara piyasa dinamiklerini tam olarak görme imkanı sağlayan güçlü bir MT4 göstergesidir. Çok zamanlı trend analizi, arz/talep gücü ve hassas mum fitili (wick) ret uyarılarını birleştirir. Bu araç, hangi döviz çiftleri veya varlıkların trendde olduğunu gösterir, yüksek olasılıklı dönüş noktalarını vurgular ve trader’ların gürültüyü filtrelemesine yardımcı olarak piyasa momentumuna uygu
MTF Currency Strength Panel MT4
Narayanan Mohanan Mohanan Krishnan
MTF Currency Strength Panel for MetaTrader 4 Çoklu zaman dilimli döviz gücü göstergesi: 28 ana paritenin tamamı tek bir grafikte. Bu döviz gücü paneli, sekiz ana para biriminin şu anda nerede durduğunu ve 28 ana paritenin her birinin M1'den MN1'e dokuz zaman diliminde nasıl hareket ettiğini birlikte gösterir. Her iki okuma tek bir grafikte yer alır ve bir zamanlayıcıyla güncellenir. Çiftleri kendi başlarına sıralamak yanıltıcıdır. Tek bir para birimi hareket ettiğinde, onu içeren her çift onunla
FREE
MA Multi-Currencies  Multi-Timeframes Histogram BUY/SELL Indicator up to 6 currencies on time  calculations based on 6 time frames : M5, M15, M30, H1, H4, D1 Trading Strategies: **TREND shifts to UP trend when Green point appears after Red and Gray points -> Close SELL positions then add new BUY positions on new Green points  **TREND shifts to DOWN trend when Red point appears after Green and Gray points -> Close BUY  positions then add new SELL positions on new Red points ** Close BUY position
Fibo Reversals is an indicator which has carefully been put together to attempt to indicate a time period in which an ongoing trend is most probably exhausted and a new trend (actually a reversal trend) inadvertently begins. At this, it should be okay for the manual trader to be on the look out for good trading opportunities. Input Settings Father Fibo  – This Input Determines The Highest Price For The Chosen Input Period. Son Fibo  - This Input Determines The Lowest Price For The Chosen Input
The  Complete Smart Market Concepts  indicator is your all-in-one institutional-grade tool designed to decode  Smart Money Concepts (SMC)  and reveal how the "big players" — banks, hedge funds, and institutions — truly move the forex markets. Built specifically for traders who want to trade like the smart money, this  indicator automatically identifies and plots the most essential SMC elements directly on your charts, giving you crystal-clear insights without manual drawing or guesswork.  
Colored indicator of the linear channel based on the Fibonacci sequence. It is used for making trading decisions and analyzing market sentiment. The channel boundaries represent strong support/resistance levels, as they are the Fibonacci proportion levels. Users can select the number of displayed lines of channel boundaries on the chart by means of the input parameters. Attaching multiple instances of the indicator to the chart with different calculation periods leads to displaying a system of c
Buy & Sell Levels with Alerts is a comprehensive trading indicator that combines Stochastics, Previous Day Levels, Multi-Timeframe (MTF) Trend Meter , and rejection detection into one powerful tool. It helps traders quickly spot key support/resistance zones, trend direction, and high-probability reversal signals with visual arrows and automated alerts. Key Features: Stochastic Oscillator: Displays fast (%K) and slow (%D) lines in a separate window. Helps identify overbought and oversold conditio
ZoneDominator AI
Mohammad Ziad Abdelwahed Alkahlah
ZoneDominator AI — Adaptive Multi-Timeframe Support & Resistance Indicator Overview ZoneDominator AI is an advanced analytical indicator that continuously scans all timeframes to locate the most accurate and relevant Support & Resistance zones. It uses a unique combination of ATR volatility, Moving Averages, Price Action, and higher-timeframe confirmation to adapt in real time to market structure. You can choose your preferred trading style — Scalping, Intraday, or Swing — and the indicat
Açıklama Triangle Breakout Retest Dashboard Pro Multi Symbol, piyasa yapısına dayalı breakout ve retest işlemleri için tasarlanmış çoklu parite destekli kurumsal tarz bir işlem göstergesidir. Birden fazla döviz çiftini otomatik olarak tarar, üçgen konsolidasyon formasyonlarını tespit eder, kırılım yönünü belirler ve giriş sinyali üretmeden önce onaylı bir retest bekler. Bu araç, sahte kırılımları azaltmak için piyasa yapısına dayalı onaylı girişlere odaklanacak şekilde tasarlanmıştır. Temel Özel
R Var Hareketli Ortalama Göstergesi, zorlu trend takipçileri için tasarlanmış bir trend takip göstergesidir. Hisse senedi tüccarları ve emtia tüccarları arasında oldukça popüler bir forex ticaret göstergesidir ve popülaritesi, kullanıcılarına gerçek para kazanma sinyalleri verme yeteneğinden kaynaklanmaktadır. Gösterge, bir sienna çizgisi üzerine yerleştirilmiş yeşil ve kırmızı noktalardan oluşur. Yeşil nokta yükseliş sinyalini, kırmızı nokta ise düşüş sinyalini gösteriyor. Temel Ticaret Sin
FREE
Jerk Indicator
Safwan Rushdi Khalil Arekat
5 (2)
In physics, "Jerk" is the third time-derivative of position, with acceleration being the second derivative and velocity the first derivative. In technical analysis, the first derivative of price is the price momentum, with the second derivative,acceleration, being seldom used and the third derivative virtually unknown. The magnitude frequency response of a digital differentiator is a positive-slope straight line passing through zero frequency. Therefore, every instance of a digital signal differ
FREE
ToolBox 360 is the swiss knife of all indicators. It is full packed with useful tools to help you with your trading. It can be used to find best entry and exit points and help you to decide if you should open a trade or not. It shows market trends, candlestick formations outside / inside bars and you can sett time based allerts. Main features: Time based Fibonacci lines Choose a start and end time and the indicator shows you Fibonacci lines within the selected time range including range high a
Holy Trinity Volatility Indicator This indicator reflects the peak time of the day wherein there's is expected to be sharp price actions. It also presents the markets as just waking up from the dull and less volatile Asian (and or London) trading sessions into a bustling time of highly liquid price flows. NOTE: This indicator informs the trader ahead of peak price movements - one bar just before the real actions starts. Enter when the volatility line falls below the Tripple Exponential Moving Av
Top Gun Oscillators
Safwan Rushdi Khalil Arekat
5 (2)
Note : New in 1.6: the indicator now exports the trade signal (but not displayed). Go long with light blue. Go short with red. Exit otherwise. Signal to be imported to your EA using iCustom. This indicator provides Best of the Best linear filter momentum oscillators that I am aware of (Low Pass Differentiators, LPD's) . All of them are  recent developments by this developer, or other researchers. The oscillator line is the first buffer of the indicator, and can be called  in other indicators or
FREE
Smart Trend Forecasting Slope-Based Trend Analysis Indicator with Alert Support Overview Smart Trend Forecasting is a slope-based trend analysis indicator derived from a classic moving average trend model originally developed by Wizard Serg and referenced in Forex Magazine #104. The indicator is designed to monitor: Trend direction Momentum shifts Trend transition conditions Moving average slope behavior It includes visual markers and configurable alert notifications for trend state changes. Ma
Quantum Enigma
Yonny Pascal Ekwa Mezui
Quantum Enigma Quantum Enigma is a technical analysis indicator based on market structure and price action. It is designed to identify potential Bullish and Bearish setups around established price ranges. The indicator analyses market conditions and can apply several configurable confirmation and filtering conditions before displaying a signal. This allows traders to adjust the balance between signal frequency and selectivity according to their preferred trading approach. How It Works Quantum En
"Cool volumes" arama göstergesi, Mt4'teki kene hacimlerine dayanarak oluşturulmuştur. Göstergenin kendisi belirli bir zaman diliminde (zaman diliminin seçimi) satın alınacak veya satılacak hacimlerin sayısını izler. Ve satıcıların veya alıcıların hacimlerinde anormal bir fazlalık olduğunda, bir satış veya satın alma sinyali verir. Alt pencerede renkli histogramlar çizilir, burada yeşil renk şu anda alıcıların üstünlüğünü gösterir, bu da belirli bir fiyat aralığındaki artışın potansiyel olarak
Oscillator helps determine the direction of the market Shows the direction of the price movement and is painted in the appropriate color. Allows you to conduct trend and counter trend trading It works on all timeframes, on any currency pairs, metals and cryptocurrency Can be used when working with binary options Distinctive features Does not redraw; Simple and clear settings; It works on all timeframes and on all symbols; Suitable for trading currencies, metals, options and cryptocurrency (Bitco
XP Speed Meter MT4: Measure True Market Momentum Description The XP Speed Meter MT4 is a unique and powerful custom indicator designed to reveal the true speed and momentum of price movement. Unlike standard indicators that rely on chart-bar closing prices, the Speed Meter dynamically calculates the volume of bullish and bearish ticks, and the resulting price movement, over a specific, user-defined time period. This innovative approach allows you to cut through the noise of standard timef
Bu ürünün alıcıları ayrıca şunları da satın alıyor
Trend SniperX MT4
Sarvarbek Abduvoxobov
5 (5)
Trend Sniper X , işlemcilerin trend yönünü ve olası dönüş noktalarını netlik ve hassasiyetle belirlemelerine yardımcı olan MetaTrader 5 için çoklu zaman dilimli bir trend takip göstergesidir. MT5 İçin: https://www.mql5.com/en/market/product/181101 Fiyat Bilgisi: Mevcut fiyat tanıtım amaçlıdır ve gelecek güncellemeler ile yeni özellikler eklendikçe değişebilir. Code2Profit Kanalı Çoklu Zaman Dilimi Analizi ile Piyasaya Hakim Olun! Trend Sniper X ile Kazanma Oranınızı Nasıl En Üst Düzeye Çıkarırsı
Scalper Vault
Oleg Rodin
5 (40)
Scalper Vault, gün içi işlemlerde istikrar yakalamak isteyen yatırımcılar için tasarlanmış, güçlü ve tam donanımlı bir alım satım sistemidir. Bu yüksek hassasiyetli gösterge; hem Forex hem de İkili Opsiyon yatırımcıları için kurumsal düzeyde analizler sunan, bağımsız ve eksiksiz bir alım satım sistemi işlevi görür. SATIN ALIM İŞLEMİNDEN SONRA BENİMLE İLETİŞİME GEÇİN; ALIM SATIM İPUÇLARIMI VE HARİKA BİR BONUSU ALIN! Tahmin yürütme zorunluluğunu ve karmaşık manuel analiz süreçlerini ortadan kaldır
SR Liquidity
Oleg Rodin
5 (2)
SR Liquidity , piyasa likiditesinin yoğunlaştığı ve fiyatın en güçlü tepkiyi verdiği gizli bölgeleri ortaya çıkarmak için tasarlanmış bir alım-satım göstergesidir. Bu özel likidite alanları güçlü destek ve direnç seviyeleri işlevi görerek, piyasanın yön değiştirme ihtimalinin en yüksek olduğu yerlere dair size net bir harita sunar. SR Liquidity, sıradan Destek/Direnç çizgileri çizmek yerine, alım ve satım baskısının yoğunlaştığı bölgeleri tespit etmek için gerçek fiyat hareketlerini analiz eder.
M1 Sniper
Oleg Rodin
4.97 (30)
M1 SNIPER kullanımı kolay bir işlem göstergesi sistemidir. M1 zaman dilimi için tasarlanmış bir ok göstergesidir. Gösterge, M1 zaman diliminde scalping için bağımsız bir sistem olarak kullanılabilir ve mevcut işlem sisteminizin bir parçası olarak kullanılabilir. Bu işlem sistemi özellikle M1'de işlem yapmak için tasarlanmış olsa da, diğer zaman dilimleriyle de kullanılabilir. Başlangıçta bu yöntemi XAUUSD ve BTCUSD ticareti için tasarladım. Ancak bu yöntemi diğer piyasalarda işlem yaparken de ya
Atomic Analyst
Issam Kassas
5 (14)
Atomic Analyst — MetaTrader 4 Ürün soruları, kurulum rehberliği veya teknik destek için bana doğrudan MQL5 üzerinden mesaj gönderin. İndikatör, karmaşık piyasa hesaplamalarını basit görsel sinyallere, renk kodlu mumlara, trend okumalarına, stop-loss seviyelerine ve traderların hızlıca anlayıp gerçek piyasa koşullarında kullanabileceği çoklu take-profit bölgelerine dönüştürür. Ana trading kullanım alanları: Scalping ve gün içi işlem: Hızlı karar alma, net oklar, uyarılar, mum renkleri ve yapılan
Currency Strength Wizard , başarılı ticaret için size hepsi bir arada çözüm sağlayan çok güçlü bir göstergedir. Gösterge, birden çok zaman dilimindeki tüm para birimlerinin verilerini kullanarak şu veya bu forex çiftinin gücünü hesaplar. Bu veriler, şu veya bu para biriminin gücünü görmek için kullanabileceğiniz, kullanımı kolay para birimi endeksi ve para birimi güç hatları biçiminde temsil edilir. İhtiyacınız olan tek şey, işlem yapmak istediğiniz tabloya göstergeyi eklemektir ve gösterge size
PRO Renko Sistemi, RENKO grafikleri ticareti için özel olarak tasarlanmış son derece hassas bir ticaret sistemidir. Bu, çeşitli ticaret araçlarına uygulanabilen evrensel bir sistemdir. Sistemi etkin piyasa sana doğru ters sinyallerine erişim hakkı denilen ses nötralize eder. Göstergenin kullanımı çok kolaydır ve sinyal üretiminden sorumlu tek bir parametreye sahiptir. Aracı, seçtiğiniz herhangi bir ticaret aracına ve renko çubuğunun boyutuna kolayca uyarlayabilirsiniz. Yazılımımla karlı bir
Neuro Poseidon MT4
Daria Rezueva
4.74 (46)
Neuro Poseidon is a new indicator by Daria Rezueva. It combines precise trading signals with adaptive TP/SL levels - creating best possible trades as a result! Message me and get  Neuro Poseidon Assistant  as a gift to automize your trading process! What makes it stand out? 1. Proven profitability on all assets and timeframes 2. Only confirmed BUY and SELL signals present on the chart 3. Adaptive TP & SL levels generated by the software for each trade 4. Easy to understand - suitable for all
Gann Made Easy
Oleg Rodin
4.84 (173)
Gann Made Easy , bay teorisini kullanarak ticaretin en iyi ilkelerine dayanan, profesyonel ve kullanımı kolay bir Forex ticaret sistemidir. WD Gann. Gösterge, Zararı Durdur ve Kâr Al Seviyeleri dahil olmak üzere doğru SATIN AL ve SAT sinyalleri sağlar. PUSH bildirimlerini kullanarak hareket halindeyken bile işlem yapabilirsiniz. Satın alma işleminden sonra, alım satım talimatlarını ve harika ek göstergeleri ücretsiz olarak almak için lütfen benimle iletişime geçin! Muhtemelen Gann ticaret yöntem
AW Prime Oscillator
AW Trading Software Limited
5 (1)
İki osilatörün birleşimi. Birincisi giriş noktalarını, ikincisi ise mevcut trendi gösterir. Gösterge, osilatör sinyallerini iki modda oklarla görüntüleyebilir; tüm hızlı osilatör sinyalleri veya yalnızca mevcut trend yönündeki sinyaller. Çok zaman dilimli bir panele ve üç tür sinyal bildirimine sahiptir. Faydalar: Günlük ve scalping ticaretine uygundur Trend filtreleme Basit ve hassas kurulum Çoklu zaman dilimi paneli Bir danışmana entegrasyona uygundur. Herhangi bir sembol ve herhangi bir zaman
Tokyo mt4 Indicator
Vasiliy Strukov
5 (9)
Tokyo Indicator; trend yönü, potansiyel işlem sinyalleri ve piyasa koşulları hakkında net ve görsel bir genel bakış sunar. Renk kodlu ve kademeli trend çizgisi, yükseliş evrelerini (mavi) düşüş evrelerinden (macenta) ayırt eder. Trend değiştiğinde, buna karşılık gelen yön okları potansiyel alım ve satım fırsatlarını vurgular. Entegre bir panel; mevcut sinyali, piyasa eğilimini, momentumu, volatiliteyi ve sinyal kalitesini tek bir kullanışlı görünümde bir araya getirir. Bu sayede yatırımcılar, f
PZ Harmonacci Patterns
PZ TRADING SLU
3.17 (6)
Trade smarter, not harder: Empower your trading with Harmonacci Patterns This is arguably the most complete harmonic price formation auto-recognition indicator you can find for the MetaTrader Platform. It detects 19 different patterns, takes fibonacci projections as seriously as you do, displays the Potential Reversal Zone (PRZ) and finds suitable stop-loss and take-profit levels. [ Installation Guide | Update Guide | Troubleshooting | FAQ | All Products  ] It detects 19 different harmonic pric
Liquidity Scalper System: gösterge formatında likiditeye dayalı bir işlem sistemi. Çoğu gösterge yalnızca bir ok gösterir; sonrasında stopun nereye konacağına, hedefin nerede olduğuna ve sinyale güvenilip güvenilmeyeceğine trader kendisi karar verir. Liquidity Scalper System işlemin tüm döngüsünü kapsar: likidite havuzlarını bulur, kırılımlarında sinyal verir, Entry, Stop Loss ve üç hedefi anında hesaplar, panelde ise istatistikleri ve yeni veriler üzerindeki doğrulama sonuçlarını gösterir. Sis
Smart Trend Trading System, trend bilgilerini, giriş ve çıkış sinyallerini ve fiyat seviyelerini tek bir grafikte birleştiren bir MetaTrader 4 göstergesidir. Trend tespiti, dönüş bölgeleri, Smart Cloud, trailing stop mantığı, destek ve direnç, mum renklendirme, uyarılar ve çoklu zaman dilimi analizi dahil olmak üzere 10’dan fazla trading aracını tek bir sistemde birleştirir. Sistem, farklı piyasa koşullarında işlem yapmanıza yardımcı olmak için tasarlanmıştır: Trend piyasaları: Ana trendi belir
Hidden Cycles
Lev Vladimirovic Marushkin
5 (1)
The Only 100% Universal Tool! Stop trading against nature! This is your chance to secure the only indicator rooted in the absolute laws that govern the entire universe. Most tools guess—this one reveals the truth. Buy another toy or buy the truth. Your choice... Based on Universal Laws — NOT Some Guy’s Algorithm: Let the market adjust to the Hidden Cycles Geometry — not the other way around. Most indicators are based on a man-made formula. They often lag, fail over time, or need constant re-o
CRT Multi-Timeframe Market Structure & Liquidity Sweep Indicator Non-Repainting | Multi-Asset | MT5 Version Available MT5 Version:   https://www.mql5.com/en/market/product/162075 Full User Guide — explains what each feature does and why:   https://www.mql5.com/en/blogs/post/767525 Quick Start User Guide  — explains how to configure and in what order:  https://www.mql5.com/en/blogs/post/767540 Indicator Overview CRT Ghost Candle HTF Fractal is a complete institutional-grade market structure too
This is a professional chart indicator designed for traders focused on stability and clear price action. It helps filter market noise and provides clear visual entry and exit zones for your trading decisions. Core Features: Strictly Non-Repainting: The system is built with strict non-repaint logic. What you see on the chart is the true historical performance. Confirmed Signals: Signals are triggered and confirmed only after the candle closes . Once a trading arrow appears on a closed candle, it
SIO Oscillator: Kendi Kendini Optimize Eden Yarı Varyans Dengesizlik Osilatörü İndikatörü satın alın, ona dayalı Uzman Danışmanı (EA) ÜCRETSİZ edinin. Çoğu osilatör, tüm fiyat hareketlerini aynı şekilde değerlendirir. SIO ise yükseliş ve düşüş baskısını birbirinden ayırır ve aralarındaki dengesizliği ölçerek piyasayı gerçekte kimin kontrol ettiğini gösterir: alıcılar mı, satıcılar mı. Dengesizlik bir uç noktaya ulaştığında SIO, giriş, Stop Loss ve Take Profit seviyeleriyle birlikte net bir sinya
GoldRush Trend Ok Sinyali GoldRush Trend Ok Sinyali göstergesi, XAU/USD'de yüksek hızlı, kısa vadeli scalperlar için özel olarak tasarlanmış hassas, gerçek zamanlı trend analizi sağlar. 1 dakikalık zaman dilimi için özel olarak tasarlanan bu araç, net giriş noktaları için yön okları gösterir ve scalper'ların değişken piyasa koşullarında güvenle hareket etmelerini sağlar. Gösterge, PRIMARY ve SECONDARY uyarı oklarından oluşur. PRIMARY sinyalleri, trend yönündeki değişikliği gösteren Beyaz ve
CRT Candle Range Theory HTF MT4 - Ultimate CRT Indicator: Gelişmiş ICT Konseptleri ve Malaysian SnR Ticaret Sistemi En gelişmiş Candle Range Theory göstergesi ile Piyasa Yapıcıların ayak izlerinde ustalaşın. Smart Money Concepts (SMC) gücünü açığa çıkarın ve Ultimate CRT Indicator ile tıpkı kurumlar gibi hassas bir şekilde ticaret yapın. Sadece ciddi yatırımcılar için özel olarak oluşturulan bu gösterge, ICT Konseptlerinin (Inner Circle Trader) temel direği olan oldukça etkili CRT (Candle Range
ForexTrendMT4
Andriy Sydoruk
5 (1)
ForexTrendMT4 Indicator: A Reliable Tool for Market Tracking The ForexTrendMT4 indicator offers reliable market trend tracking, filtering out sudden fluctuations and market noise. This tool helps identify trends and signals favorable entry points into the market using arrows. It is suitable for both scalping on shorter timeframes and long-term trading strategies. Based on the principles of technical analysis, ForexTrendMT4 takes into account the cyclical nature of the market. Key Features and A
Advanced Supply Demand
Bernhard Schweigert
4.91 (302)
Özel Ticaret –%30 İndirim Yeni Başlayanlar veya Uzman Yatırımcılar İçin En İyi Çözüm! Bu gösterge, bir dizi özel özellik ve yeni bir formül içerdiği için benzersiz, yüksek kaliteli ve uygun fiyatlı bir işlem aracıdır. Bu güncelleme ile çift zaman dilimi bölgeleri gösterebileceksiniz. Sadece daha yüksek bir zaman dilimini değil, hem grafik zaman dilimini hem de daha yüksek zaman dilimini gösterebileceksiniz: İÇ İÇE GEÇMİŞ BÖLGELER GÖSTERİYOR. Tüm Arz Talep yatırımcıları buna bayılacak. :) Önem
Super Signal – Skyblade Edition Profesyonel No-Repaint / Gecikmesiz Trend Sinyal Sistemi, Olağanüstü Kazanma Oranı ile | MT4 / MT5 için 1 dakika, 5 dakika ve 15 dakika gibi daha düşük zaman dilimlerinde en iyi şekilde çalışır. Temel Özellikler: Super Signal – Skyblade Edition, özellikle trend bazlı işlemler için geliştirilmiş akıllı bir sinyal sistemidir. Yalnızca güçlü, yönlü ve gerçek momentum destekli piyasa hareketlerini tespit etmek amacıyla çok katmanlı bir filtreleme yapısı kullanır. Bu s
True Direction Oscillator
Muhammad Elbermawi
4.85 (364)
Veya "Saf Momentum " ilkesini kullanarak fiyat değişim oranını ölçen bir endeks olan (TDO). Bir menkul kıymet fiyatı 10'dan 15'e yükseldiğinde, fiyat değişim oranı %150'dir, ancak 15'ten 10'a düştüğünde, fiyat değişim oranı sadece %33.3'tür. Bu nedenle, "Fiyat Değişim Oranı" (ROC) veya "Momentum" gibi teknik analiz göstergeleri, artan fiyat hareketleri için azalan hareketlere göre daha yüksek değerler verir. TDO, yatırımcıların momentumu doğru okumalarına yardımcı olmak için bu sorunu düzeltir.
ŞU ANDA %40INDIRIMLI Yeni Başlayanlar veya Uzman Tüccarlar için En İyi Çözüm! Bu Gösterge benzersiz, yüksek kaliteli ve uygun fiyatlı bir ticaret aracıdır çünkü bir dizi tescilli özellik ve yeni bir formül ekledik. Sadece BİR grafik ile 28 Forex çifti için Döviz Gücünü okuyabilirsiniz! Yeni bir trendin veya scalping fırsatının tam tetik noktasını belirleyebildiğiniz için ticaretinizin nasıl gelişeceğini hayal edin? Kullanım kılavuzu: buraya tıklayın Bu ilk olan, orijinal! Değersiz bir özent
Trend Lines PRO
Roman Podpora
5 (2)
TREND ÇİZGİLERİ PRO     Piyasanın gerçek yön değişimini anlamaya yardımcı olur. Gösterge, gerçek trend dönüşlerini ve büyük oyuncuların piyasaya yeniden girdiği noktaları gösterir. Anlıyorsun     BOS hatları  Daha yüksek zaman dilimlerindeki trend değişiklikleri ve önemli seviyeler, karmaşık ayarlar veya gereksiz gürültü olmadan gösterilir. Sinyaller yeniden çizilmez ve çubuk kapandıktan sonra grafikte kalır. VERSION MT 5     -    RFI LEVELS PRO  göstergesiyle birlikte kullanıldığında maksimum p
Top Bottom Tracker , piyasa trendini analiz eden ve trendin en yüksek ve en düşük seviyelerini tespit edebilen sofistike algoritmalara dayanan bir göstergedir / MT5 sürümü . Fiyat 500$'a ulaşana kadar kademeli olarak artacaktır. Sonraki fiyat --> $99 Özellikler Yeniden boyama yok Bu gösterge, yeni veriler geldiğinde değerlerini değiştirmez İşlem çiftleri Tüm forex çiftleri Zaman Dilimi Tüm zaman dilimleri Parametreler ==== Gösterge yapılandırması ==== Konfigürasyon parametresi // 40
Şu anda %30 İNDİRİMLİ! Herhangi bir Acemi veya Uzman Tüccar için En İyi Çözüm! Bu gösterge paneli yazılımı 28 döviz çifti üzerinde çalışıyor. Ana göstergelerimizden 2'sine (Gelişmiş Para Birimi Gücü 28 ve Gelişmiş Para Birimi Dürtüsü) dayanmaktadır. Tüm Forex piyasasına harika bir genel bakış sağlar. Gelişmiş Para Birimi Gücü değerlerini, para birimi hareket hızını ve tüm (9) zaman dilimlerinde 28 Forex çifti için sinyalleri gösterir. Trendleri ve / veya scalping fırsatlarını belirlemek için
DayTrader PRO MT4
Davit Beridze
4.6 (10)
DayTrader PRO MT5:  https://www.mql5.com/en/market/product/186222 DayTrader PRO, John Ehlers'in Laguerre filtresini güçlü bir otomatik optimizasyon motoruyla birleştiren gelişmiş bir alım satım indikatörüdür. Sabit parametreler kullanmak yerine, indikatör yakın piyasa koşullarına göre en iyi ayarları otomatik olarak arar ve sürekli manuel ayarlamalar yapmadan değişen piyasa volatilitesine uyum sağlamanıza yardımcı olur. İndikatör, net ALIM (BUY) ve SATIM (SELL) sinyallerinin yanı sıra mevcut piy
Indicator plots price cycle blocks and sends signals with smart volume confirmation. Price cycles and fractals are combined to determine the demand/supply blocks. The indicator can be used alone or combined with other Cycle Indicators Inputs: Period: Recommended value is between 35 and 55( Which are Set 1 and Set 2 periods of cycle sniper ) Engulfing: If true, you will be able to see the engulfing bar confirmation. Volume Filter: True (The  arrow comes with volume confirmation ) Videos with dif
Yazarın diğer ürünleri
Candlestick Confluence Detector Candlestick Confluence Detector scores candlestick confluence across your chart and up to three higher timeframes — without manually cross-checking each one. It detects 16 classic price-action patterns, grouped into three dedicated engines: Rejection Continuation Warning Each pattern receives a 0–100 confluence score. Every label is traceable to a documented, user-adjustable rule set. KEY FEATURES • 16 candlestick patterns across 3 purpose-built engines: Rejecti
StructuraX
Ibe Hyginus Ugwoke
StructuraX Non-repainting market structure analysis with a mechanical bias score, optional higher-timeframe context, key levels, and risk-based reference calculations. Overview StructuraX is a rule-based market structure indicator designed to turn price action into a structured analytical framework. It analyses the current chart timeframe for: Market structure: HH/HL and LH/LL Confirmed Break of Structure (BOS) Dominant impulse and retracement depth Momentum thrust Compression Key structural zon
Filtrele:
Değerlendirme yok
Değerlendirmeye yanıt