Order Block Intelligence Engine

  • 指标
  • Ibe Hyginus Ugwoke
    Ibe Hyginus Ugwoke
    • MQL4/MQL5 Developer | Custom EAs & Indicators 在  Independent / Self-employed
    • 尼日利亚
    • 275
    I’m an MQL4/MQL5 developer and active trader. I build and personally test the trading tools I develop, which gives me a practical understanding of edge cases, signal timing, and the differences between backtest and live behaviour.
  • 版本: 1.2
  • 激活: 5
Order Block Intelligence Engine v1.02

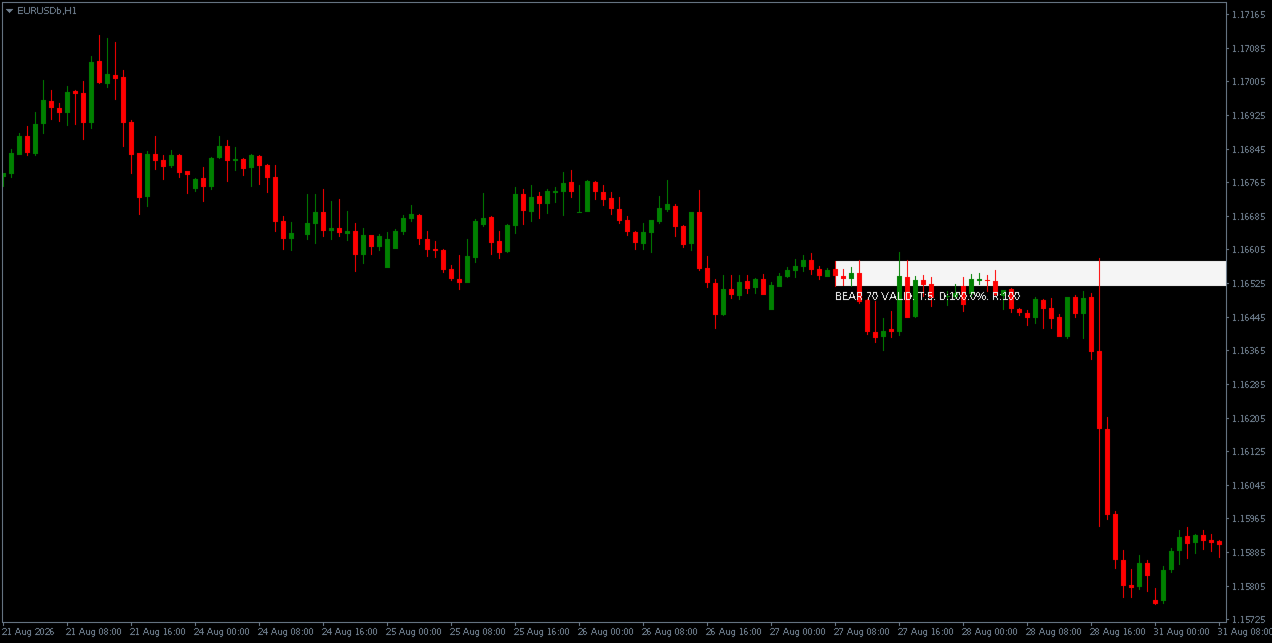
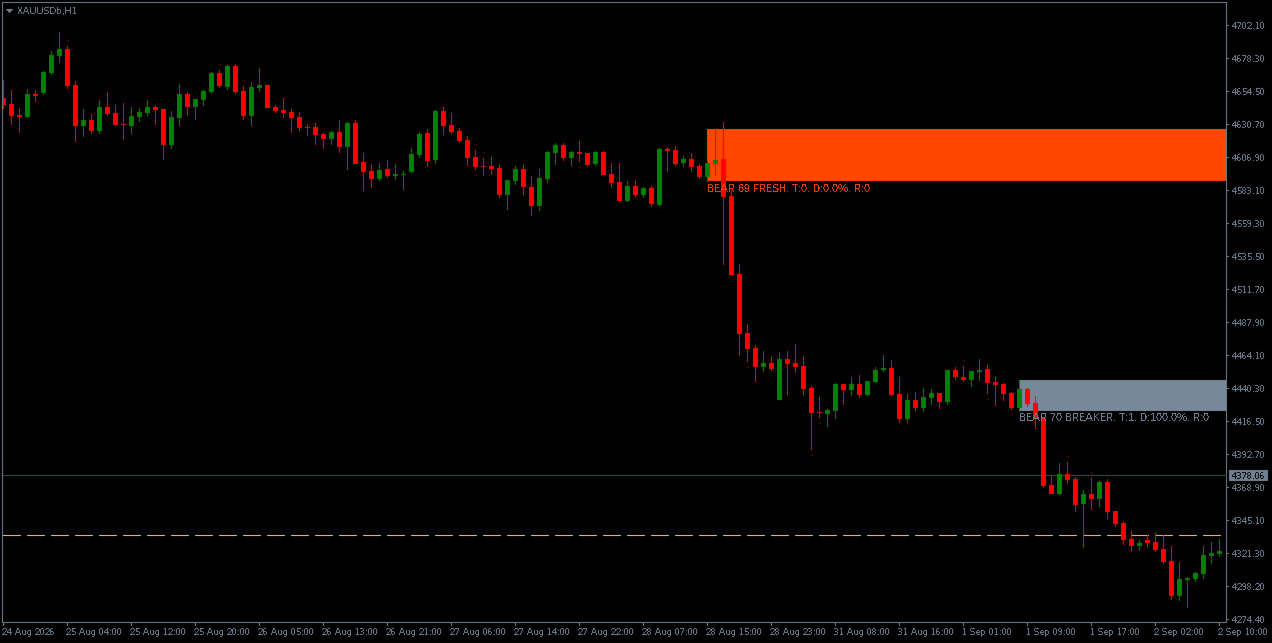
Detects order block zones using confirmed swing structure, break-of-structure with displacement, and a multi-factor quality score. Tracks each zone through a five-state lifecycle and optionally projects a next target level.

OVERVIEW

The indicator identifies order block zones on the current chart timeframe.

Each zone is defined by the origin candle (or base of consecutive candles) that preceded a break of structure, and by the swing point whose break confirmed the move.

Zones are only created after the break of structure is confirmed by a closed bar.

Each zone is evaluated by a heuristic quality score between 0 and 100, computed from six weighted components. The score is used to filter zones below a user-configurable threshold.

Each zone then transitions through a lifecycle of states as price interacts with it, and optionally projects a next target level drawn as a horizontal line.

Detection uses only OHLC prices and ATR.

It does not use volume, order flow, market profile, tick data, or any external source.

It does not identify institutional activity and does not claim to do so.

KEY FEATURES

• Dual swing detection: internal (minor) and external (major) swing points, weighted differently in the score
• Break-of-structure confirmation: zones require a closed bar that breaks the prior swing extreme with a minimum displacement body
• Multi-candle origin detection: the origin zone walks back through the base candles preceding the break, ending at the last opposite candle before the break of structure, up to a user-configurable maximum
• Multi-factor scoring: structure, displacement, liquidity sweep, origin base quality, fair value gap, and higher-timeframe alignment
• Lifecycle state tracking: FRESH, TESTED, REACTING, VALID, BREAKER
• Optional target projection: the next opposite-type zone or unbroken swing level is drawn as a horizontal line
• Optional session filter, HTF alignment filter, and reaction timeout
• Overlap management: zones whose range overlaps an existing same-type zone by more than 50 percent are not drawn
• Alerts on new zone, first touch, reaction confirmed, and zone invalidated

ABOUT THE SCORE

Each zone produces a score between 0 and 100.

The score is a heuristic value computed from six weighted components.

The score is not:

• A probability
• A win rate
• A validated measure of trading outcome

A score of 75 does not mean the zone has a 75 percent chance of working.

It means the zone satisfied more of the six conditions that the scoring model rewards.

Every component weight is exposed as an input parameter, so users can adjust the emphasis of the model or disable components entirely.

Default minimum score for display: 67

WHAT THE SCORE EVALUATES

Structure Break

Zones derived from confirmed external swings receive more weight than zones derived from internal swings.

External swings are longer-term and structurally more significant than internal swings.

Displacement Quality

The break-of-structure candle is evaluated by:

• Body size
• Proportion of the range occupied by the body
• Location of the close within its range

A candle with a large body, small wicks, and a close at the extreme of its range receives the highest displacement credit.

Liquidity Sweep

If a bar between the break-of-structure candle and a recent opposite swing took out a prior swing level and then closed back inside, the zone receives the full liquidity credit.

This component is present or absent.

The default lookback window is configured wide enough that both internal-length and external-length sweeps are reachable under default settings.

Origin Base Quality

The origin zone is evaluated by:

• How tight its range is relative to ATR
• How many candles it contains

Tighter zones and larger bases score higher.

This component is scaled down when the break-of-structure candle's displacement falls below the configured gate, so a weakly displaced break receives only partial origin credit rather than none.

Fair Value Gap

If a three-bar imbalance exists between the origin zone and the break-of-structure candle in the direction of the move, the zone receives the full FVG credit.

This component is present or absent.

Higher-Timeframe Alignment

If enabled, the closing price of the break-of-structure bar is compared to an EMA on a user-selected higher timeframe.

If price is on the correct side of the EMA, the zone receives the full alignment credit.

This component can be disabled entirely, in which case its weight is not awarded to any zone.

The alignment uses the last fully completed higher-timeframe bar, so the score for a historical zone does not change once its break-of-structure bar has closed.

If the selected higher timeframe is not above the chart timeframe, or if insufficient higher-timeframe history is loaded, the component contributes nothing rather than awarding credit it cannot verify.

LIFECYCLE STATES

Each zone transitions through states as price evolves:

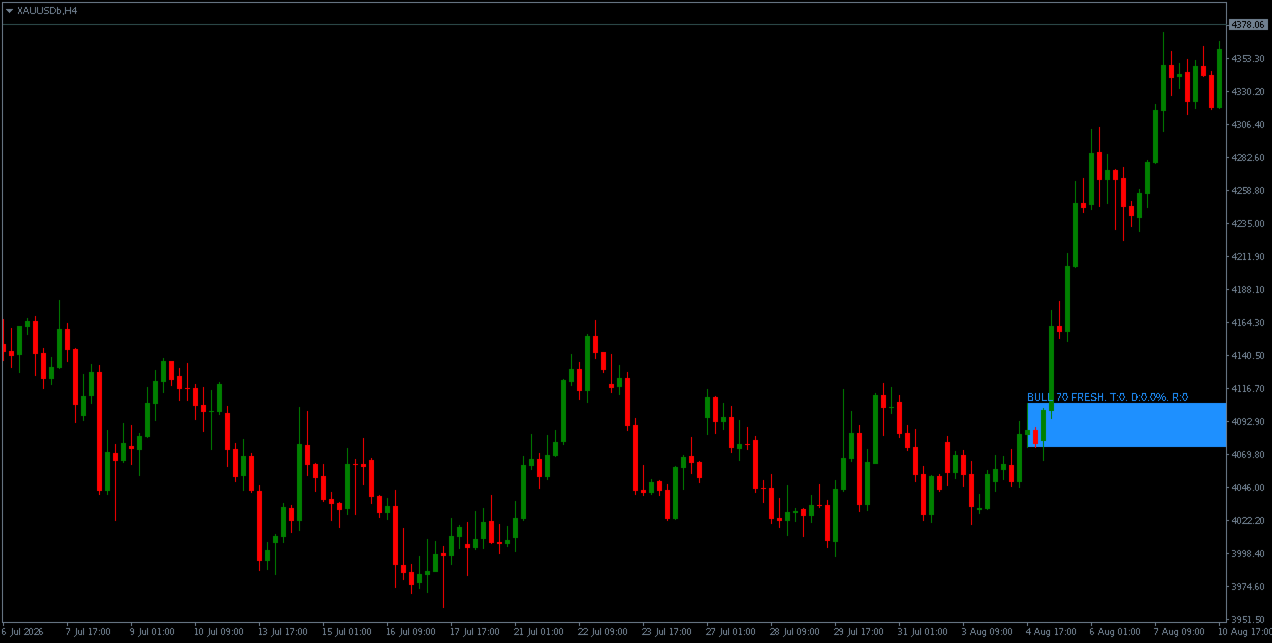
FRESH

The zone has been created and price has not returned to it.

Highest-potential state.

TESTED

Price has entered the zone at least once.

The touch count and maximum penetration percentage are updated on each touch.

REACTING

Price has tested the zone and has begun moving away, but the reversal has not yet been confirmed by a close beyond the zone boundary.

VALID

Price has closed beyond the far edge of the zone in the expected direction.

The reaction score is computed from the distance of the closing bar from the zone.

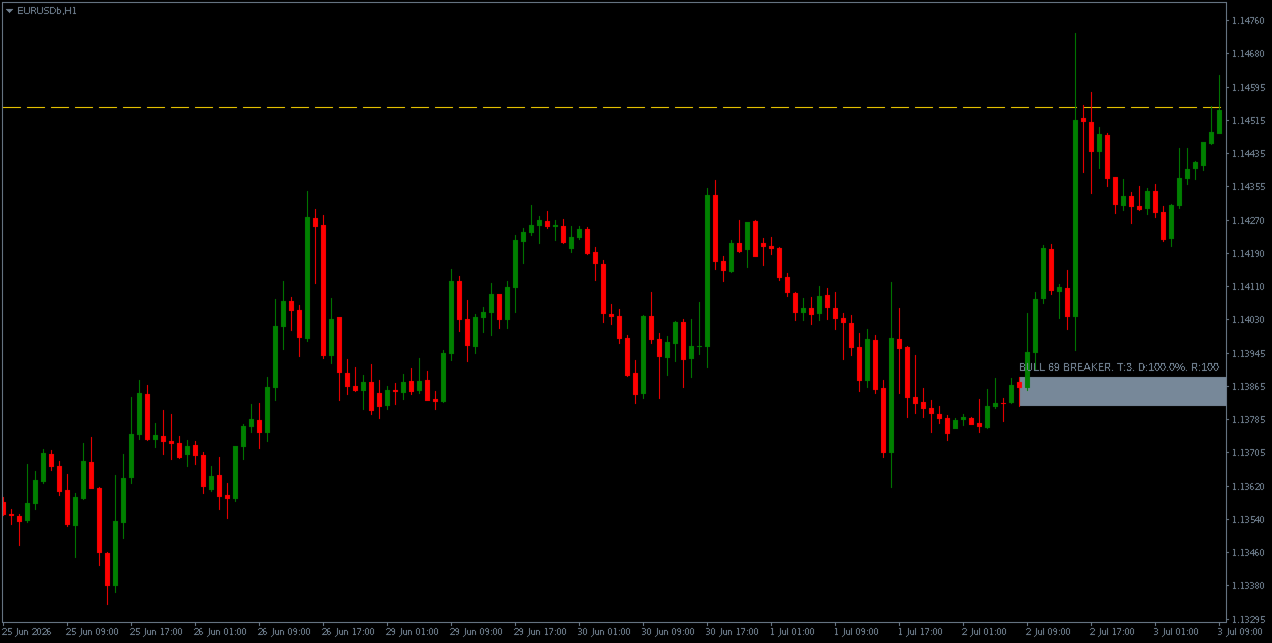
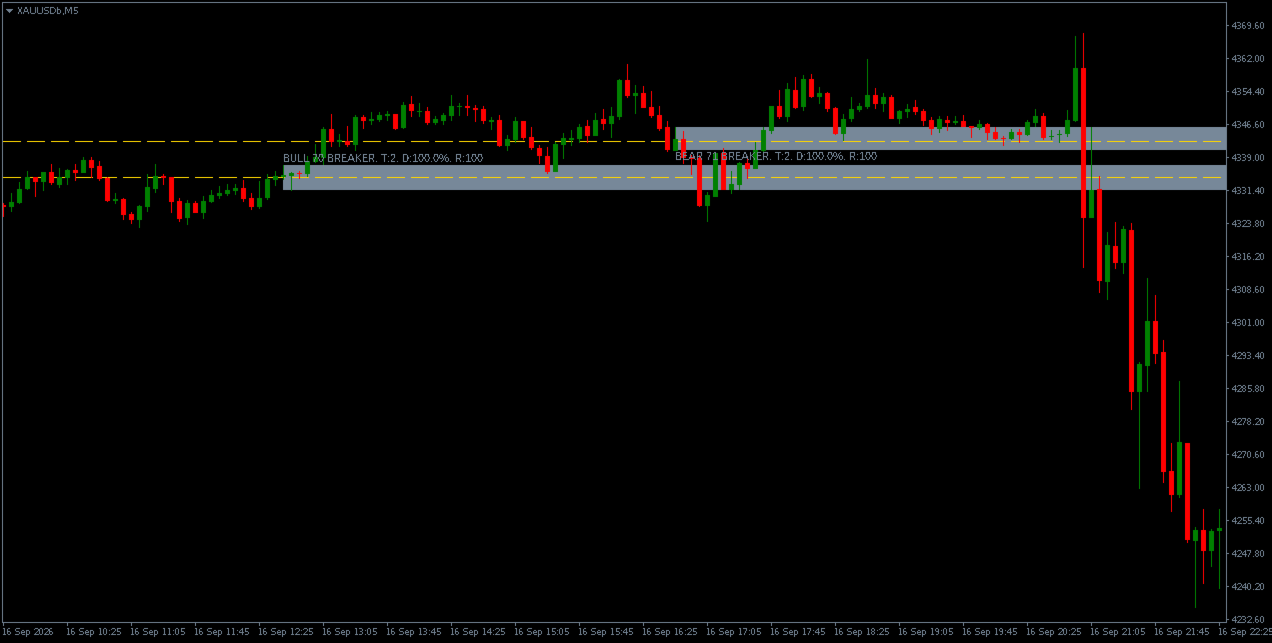
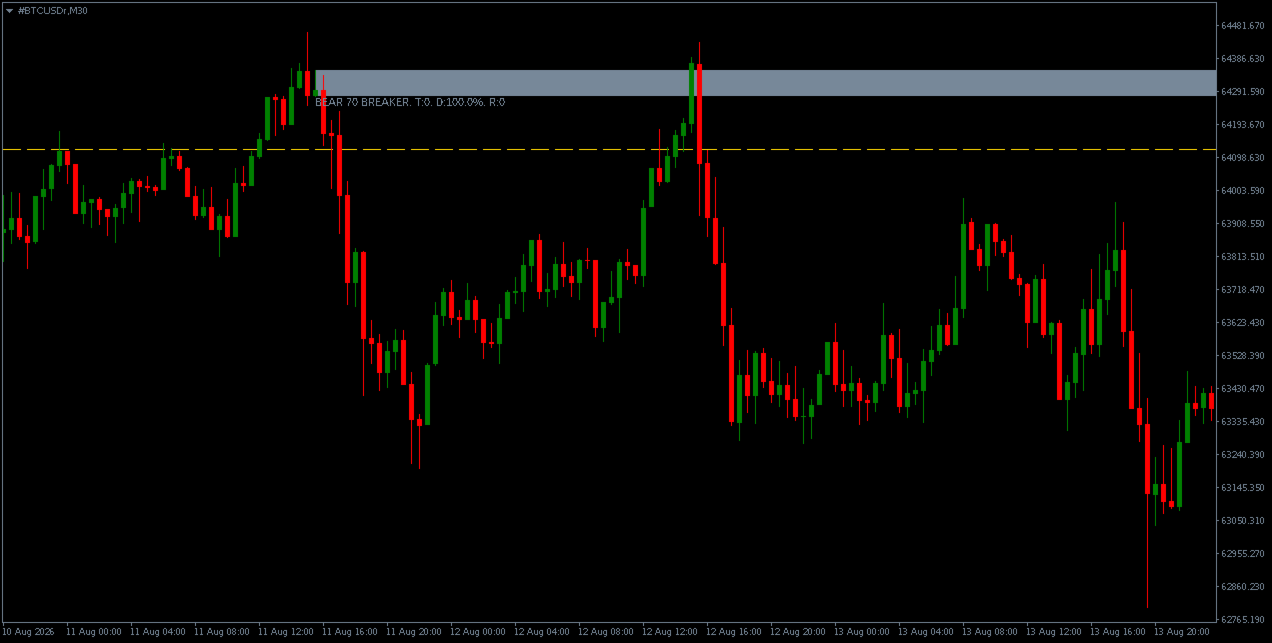
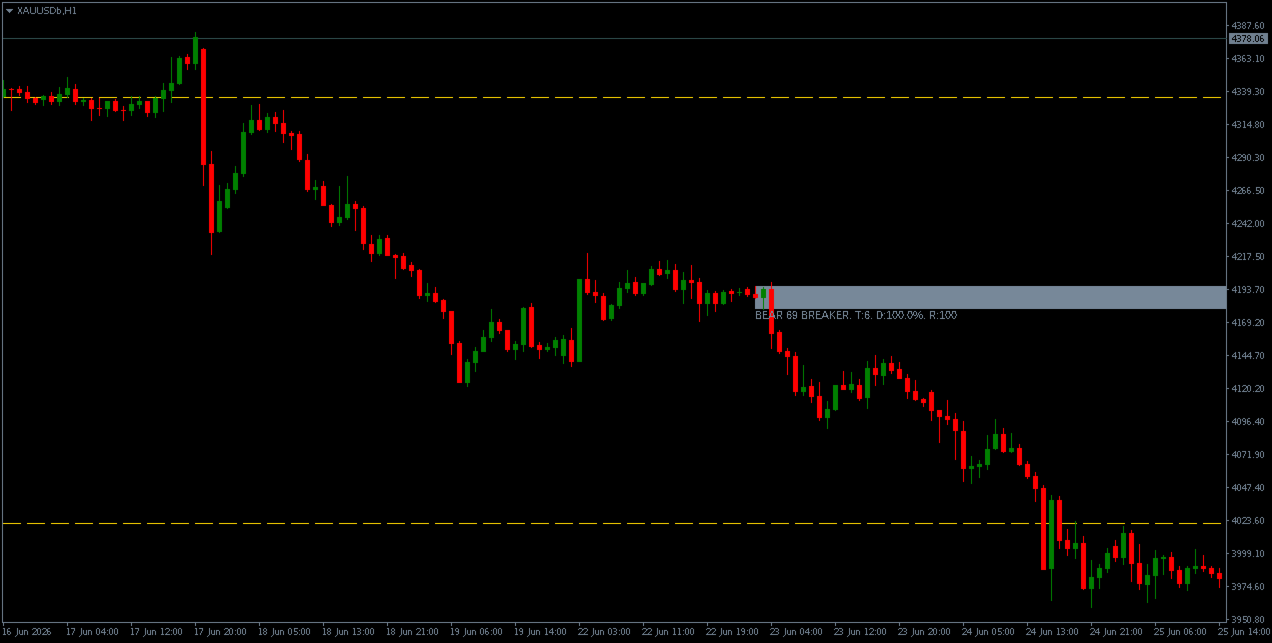
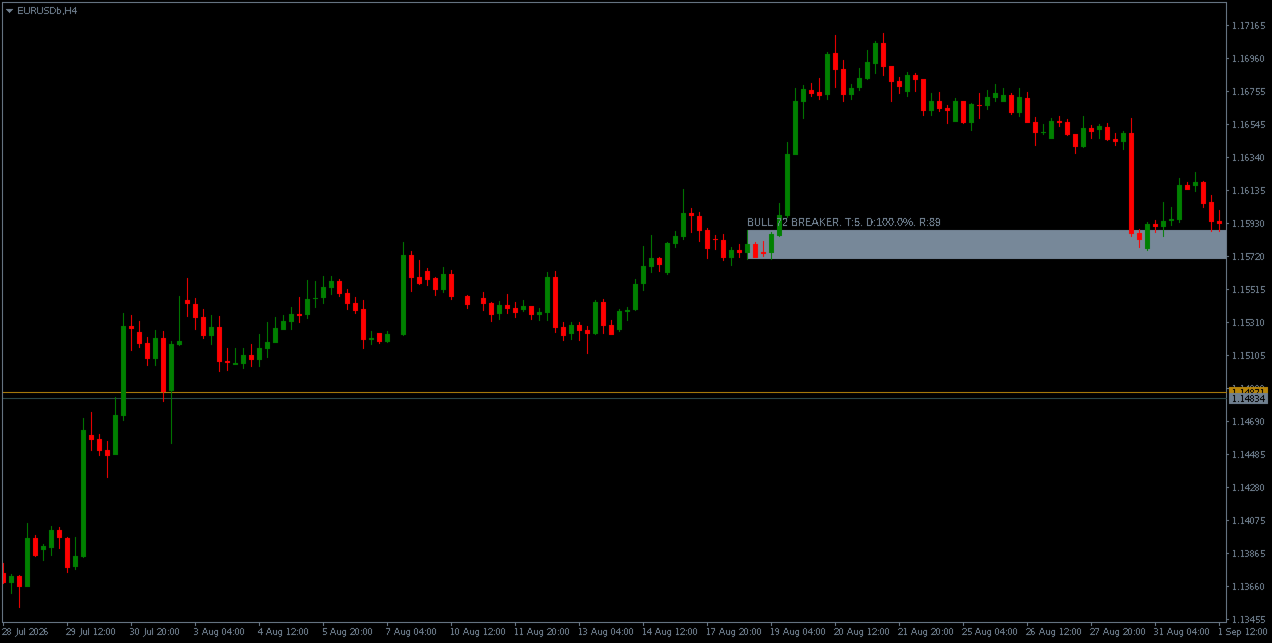
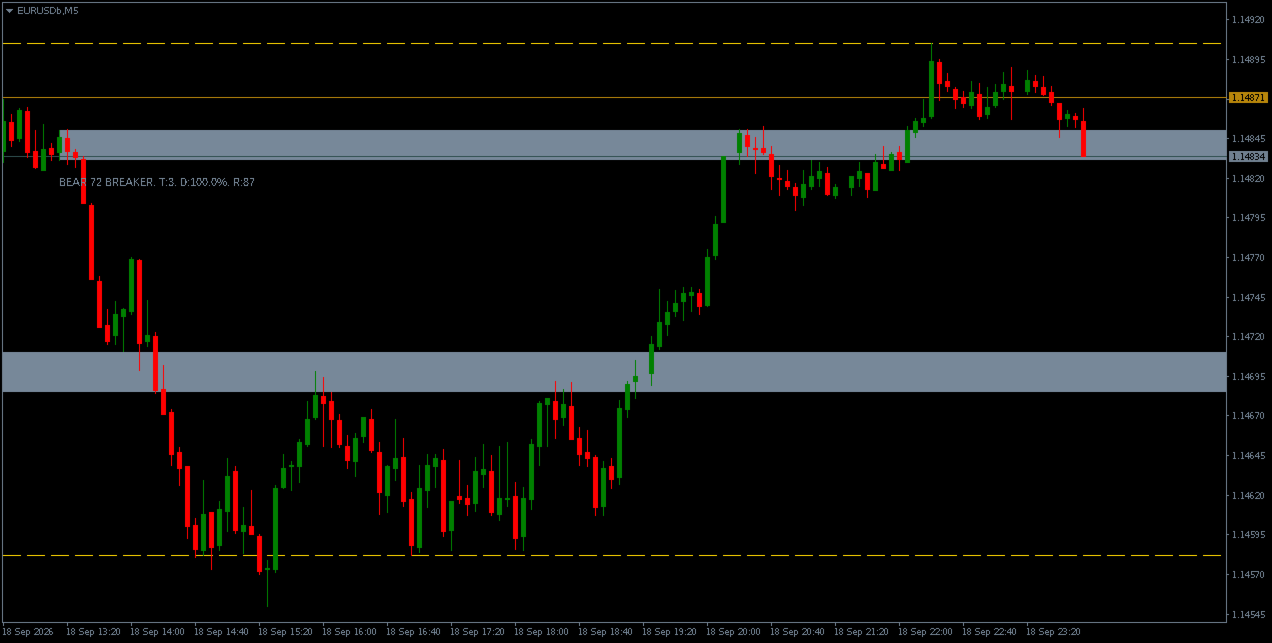
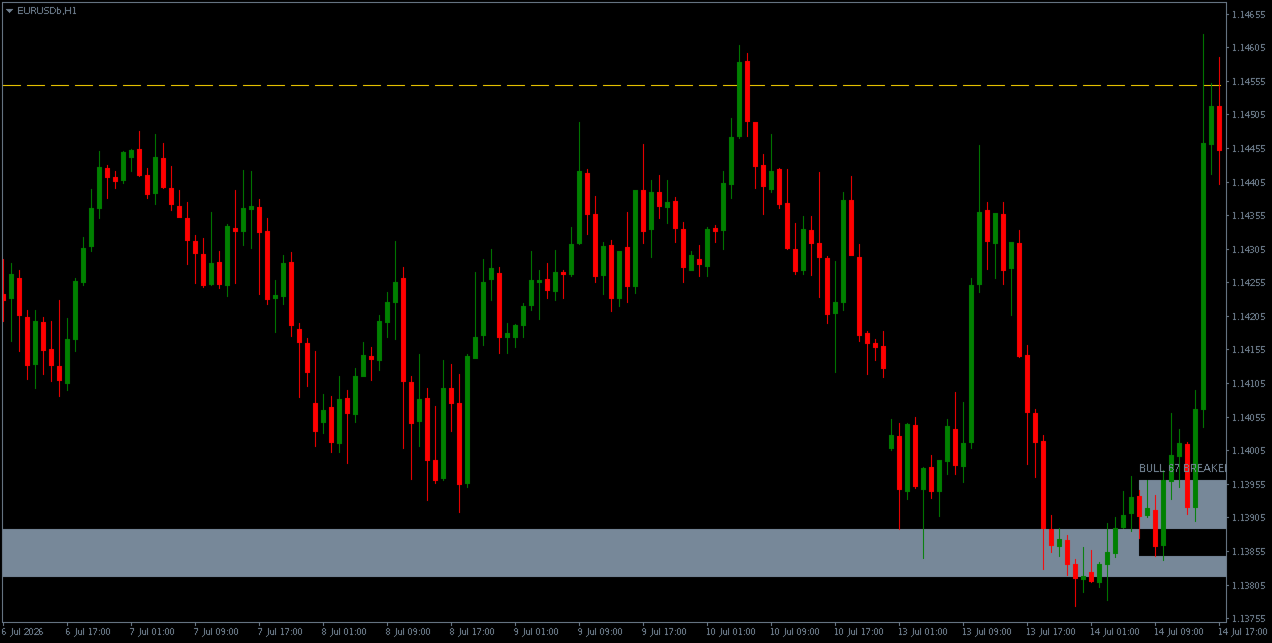
BREAKER

Price has closed through the far side of the zone in the opposite direction.

The zone is considered invalidated.

Breakers are drawn in a distinct colour and are capped at the break bar rather than extending forward.

They:

• Do not project targets
• Do not participate in same-type overlap checks
• Are not used as targets for other zones
• Are not automatically treated as an opposite-direction support or resistance level

Once a zone reaches VALID, it stays VALID until price closes through the far side of the zone and the state becomes BREAKER.

A wick or partial overlap back into a VALID zone updates the touch count and penetration percentage for descriptive purposes, but does not demote the zone to TESTED or reset the reaction score.

If a zone remains in REACTING for more than InpReactionTimeoutBars bars after the last touch without a decisive close beyond the zone boundary, it reverts to TESTED.

A zone already in TESTED is unaffected.

TARGET PROJECTION

For each displayed zone, if InpShowTargets is enabled, the indicator identifies a next logical target in the direction of the expected move.

The target is selected as follows:

1. Nearest opposite-type zone

The nearest opposite-type zone whose nearest edge lies ahead of the current zone is used.

For a bullish zone, this is the low of the nearest bearish zone above.

For a bearish zone, this is the high of the nearest bullish zone below.

2. Nearest unbroken swing

If no opposite zone exists, the nearest unbroken swing high for bullish zones or swing low for bearish zones is used.

A swing is considered broken if any close after the swing has exceeded its level.

The target is drawn as a horizontal line with user-configurable colour, width, and style.

If InpAlertOnTargetHit is enabled, an alert fires the first time the closing price of the last completed bar reaches the target.

Breaker zones do not project targets.

FILTERS

Session Filter

When enabled, zones whose break-of-structure bar falls outside the configured server-time hours are not created.

Higher-Timeframe Alignment

When enabled, zones must satisfy the EMA alignment condition described in the scoring section.

The filter has no effect if the selected higher timeframe is not above the chart timeframe.

Reaction Timeout

As described in the lifecycle section.

Overlap Management

Zones whose range overlaps an existing same-type zone by more than 50 percent are rejected.

ALERTS

Optional alerts are provided for four events:

• New qualifying zone created
• Zone touched for the first time
• Zone state transitions to VALID — reaction confirmed
• Zone state transitions to BREAKER — invalidated
• Optional: target level reached

Each event type is controlled by its own input.

Three notification channels are supported:

• Popup alert with sound
• Push notification
• Email

Alerts fire only on live bar events.

Historical replay during initial load does not produce alerts.

Any target that is already behind current price when the indicator is first attached does not fire a retrospective alert.

INPUT PARAMETERS

Swing Detection

• Internal swing length
• External swing length
• Maximum bars after swing to search for the break of structure
• Maximum candles in the origin base

Zone Validity

• Minimum zone range as ATR multiple
• Minimum break-of-structure body as ATR multiple

Scoring

• Minimum score to display
• Six component weights
• Displacement gate threshold
• Compression discount multiplier
• Maximum opposite candle body-to-range ratio for origin core

Liquidity Sweep

• Maximum bars before the break of structure to search for the sweep

Filters

• Session filter ON/OFF
• Session start and end hours
• HTF alignment ON/OFF
• HTF timeframe
• HTF EMA period

Targets

• Show targets ON/OFF
• Target line colour
• Width
• Style

Overlap

• Maximum number of zones tracked — default 80

Display

• Bullish zone colour
• Bearish zone colour
• Breaker colour
• Show zone labels ON/OFF

Alerts

• Master switch
• Per-event switches
• Popup/sound/push/email channels
• Sound file
• Message prefix

LIMITATIONS

This indicator is a visual analysis aid.

It:

• Does not generate buy or sell signals
• Does not place orders
• Does not manage positions
• Does not analyse volume
• Does not analyse order flow
• Does not analyse market profile
• Does not use any data outside OHLC prices and ATR

Order block detection depends entirely on the input thresholds and swing length settings, and different settings will produce different zones.

The quality score is a heuristic and should not be treated as a statistical probability.

The lifecycle states are descriptive classifications of how price has interacted with a zone, not predictions of future behaviour.

The target projection identifies the nearest structural level in the direction of the expected move; it does not predict that price will reach it.

Past chart patterns and past zone behaviour are not indicative of future price movement.

推荐产品
BID Wave Volume 2
Mostefa Mammeri
Product Title: BID Wave Volume 1 - Smart Institutional Liquidity Tracker Short Description: Uncover institutional footprints! A powerful dual-timeframe volume indicator that detects real market turns by checking M1 volume order flow at current timeframe reversal zones. Full Description:  BID Wave Volume 2 is a revolutionary, advanced volume indicator designed for pro-scalpers and day traders. It bridges the gap between raw price action and institutional order flow. Unlike traditional indicators,
Femade Indie
Opengates Success International
Femade Indie Vs 1.0 is a simple but multi-currency monitoring Indicator created to instantly notify the trader when an attached currency pair is ready to buy, sell or give signal when such currency pair is getting ready for a big move either up or down. It does this by visual aids on the screen charts, sound and pop-up alerts. If it shows " Medium ", this means that the so called currency signal is almost gone but can still be traded provided the trader will not need a lot of pips which can be b
Institutional Fusion Levels(机构融合水平指标) Institutional Fusion Levels 是一款专业的多时间框架支撑与阻力指标,旨在通过前一日、前一周和前一月的市场结构水平,识别高概率的机构价格反应区域。 该指标会自动在图表上绘制基于流动性的关键支撑与阻力区域,并标记出多个高时间框架水平相互融合的强共振区域。这些融合区域通常是重要的机构反应区,价格在这些位置可能出现拒绝、反转或强势延续。 Institutional Fusion Levels 帮助交易者无需手动绘制水平线即可快速识别重要市场结构水平,非常适合日内交易者、波段交易者、聪明资金交易者以及机构风格交易策略使用。 功能特点 • 自动绘制以下关键水平: 前一日最高价(PDH) 前一日最低价(PDL) 前一周最高价(PWH) 前一周最低价(PWL) 前一月最高价(PMH) 前一月最低价(PML) • 识别强机构融合区域: PML + PWL = 最强支撑区域 PMH + PWH = 最强阻力区域 • 多时间框架机构共振分析 • 可自定义显示选项: 显示/隐藏日线水平 显示/隐藏周线水平 显
Crypto_Forex MT4 版“趋势入场柱状图”指标,无需重绘。 - 趋势入场柱状图指标可用于在 Entry_bar 出现后搜索趋势方向的入场信号。 - 该指标的独特之处在于它同时考虑价格和交易量进行计算。 - 趋势入场柱状图有两种颜色:红色表示看跌趋势,蓝色表示看涨趋势。 - 一旦趋势稳定(至少 10 个连续的相同颜色柱状图),请等待 Entry_bar。 - 入场信号是柱状图中第一列颜色与第一列相反,第二列颜色为初始趋势颜色(参见图片)。 - 使用短线目标 - 根据当前趋势,选择图表上最接近的高点/低点。 - 指标内置移动端和 PC 端警报。 指标使用方法: - 买入信号:稳定的看涨趋势(蓝色柱状图柱状图)+ 柱状图上的 1 个红色柱状图 + 1 个蓝色柱状图(在此开多头仓位)。 - 卖出信号:持续看跌趋势(红色柱状图)+ 1 条蓝色柱状图 + 1 条红色柱状图(在此开空头仓位)。 点击这里查看高质量的交易机器人和指标! 这是仅在 MQL5 网站上提供的原创产品。
机构成交量 [tambangEA] 问题 大多数交易者使用过多不同的工具来解读市场。 一个指标用于成交量,一个用于成交量加权平均价格 (VWAP),一个用于支撑位和阻力位,一个用于动量,还有一个用于交易情境。结果通常都是一样的:图表拥挤、信号混乱、决策缓慢、入场时机过晚。 标准的成交量工具也存在一个重要的缺陷。它们或许能显示市场活跃度,但却无法清晰地解释: 市场价格的接受点, 价值集中点, 失衡正在形成的地方, 突破压力是否真实存在, 以及当前的风险状况是支持趋势延续还是预示着反转。 对于认真的交易者来说,这会造成一个实际问题:信息过多,但结构不够清晰。 解决方案 机构成交量 [tambangEA] 的设计初衷是将市场结构转化为清晰的可视化决策框架。 它不仅提供直方图,还整合了以下指标: 成交量分布图 合成Delta分布图 POC / VAH / VAL HVN / LVN 锚定VWAP 市场机制检测 突破情境 风险状态 交互式仪表盘 集成交易品种和时间框架切换器 所有信息都集中在一个高级图表窗口工作区中,让您可以通过单一界面读取市场倾
KFX Symbol Changer
Peter Kariuki Thande
4 (1)
KFX SMA: Symbol Changer + Moving Average (3x) + ATR + RSI + Candle Timer. This indicator allows you to create a Symbol list and change between symbols of the current chart or Timeframe by selecting the appropriate button. On Chart there are three(3) multi timeframe Moving Averages shown (selected by you), ATR Value MTF ( selected by you -  helps with setting SL and TP), RSI Value MTF (selected by you) and a Candle Timer.   Features: - Symbol Changer : Change Symbol and Timeframe of Chart.   (s
FREE
Mini FFMV Dashboard and CSM
Opengates Success International
1 (1)
Mini Forex Market-View Dashboard and Mini-CSM Mini Full Forex Market View Dashboard is a miniature creation of FULL FOREX MARKET_VIEW Custom indicator created to give the Traders a full view of what is going on in the market but in a partial matter to make it conscise. It is useful most especially for those who don't like bogus indicators or those who have a PC with limited screen size. It uses a real time data to access the market and display every bit of information needed to make a successful
SPECIAL INTRODUCTORY OFFER: First 5 copies available at $59! Next price will increase to $149! GSL Smart Gold & Silver PRO is an institutional-grade, rule-based technical indicator custom-engineered specifically for trading XAUUSD (Gold) and XAGUSD (Silver) . By combining advanced trend tracking with dedicated Smart Sell and Buy Cover logic, this system filters out false market noise and delivers clear, actionable market structure signals. Key Advantages & Features 100% Non-Repaint Gua
A top-quality from the famous XSuper Trend indicator. It is completely loyal to the original algorithm, and implements many useful features Which includes Trend Indicators as Filters like MACD,CCI and Alligator. The Chefs Super Trend Plus Indicator is a great way to identify the current market trend. The indicator shows a clear distinction between uptrends and downtrends. The indicators has optional filters for sound signal. Suitable for the following trending pairs: EUR/USD, GBP/USD, USD/JPY,
Wall of worry
Illia Zhavarankau
Description: The Wall of Worry indicator allows you to assess market sentiment and possible reversals. The indicator represents three lines that are displayed in a separate window. Black line (trend) - the amount of volumes in the candle body. Red line (bears) - the amount of volumes in the upper shadow of the candlestick. Blue line (bulls) - the amount of volumes in the lower shadow of the candle. The idea is based on "Wall of Worry" - this is the periodic tendency of financial markets to
Liquidity Sentinel Pro – 多时间框架仪表盘与烛芯反转警报 描述: Liquidity Sentinel Pro 是一款功能强大的 MT4 综合指标,能够为交易者提供完整的市场动态视图,通过结合多时间框架趋势分析、供需强度和精确的烛芯反转警报。 该工具可提供可操作的见解,帮助识别哪些货币对或资产处于趋势中,高概率反转点,以及过滤市场噪音,让交易者在顺应市场动量的情况下自信下单。 主要功能: 多时间框架趋势仪表盘 显示两个可选时间框架(例如 H4 和 M30)的趋势方向。 根据强势信号快速识别买入(BUY)或卖出(SELL)机会。 仪表盘警报提示交易对何时准备好潜在交易。 供需柱状图 可视化买盘(需求)和卖盘(供给)力量。 跟踪两个独立时间框架的市场动量,清晰呈现市场概况。 帮助识别超买/超卖走势及潜在反转区域。 智能烛芯反转警报 检测当日的看涨和看跌烛芯反转。 仅在仪表盘趋势一致时发出警报,避免误报。 支持声音、手机和电子邮件通知,及时更新。 可自定义警报与可视化 可更改箭头颜色、烛芯阈值和警报偏好,适应您的交易风格。 高亮关键市场时刻,同时保持图表整洁。 自信交
MTF Currency Strength Panel MT4
Narayanan Mohanan Mohanan Krishnan
MTF Currency Strength Panel for MetaTrader 4 多时间框架货币强度指标:全部 28 个主要货币对集中显示在一张图表上。 这款货币强度面板显示八大货币当前的相对位置,以及 28 个主要货币对在九个时间框架(M1 至 MN1)上的走势。两组读数同处一张图表,并按计时器刷新。 单独对对进行排名是有误导性的。当单一货币移动时,包含该货币的每对货币都会随之移动,因此货币对排名的顶部通常是重复七次的同一种货币。该面板通过将整个矩阵分解为单独的货币强度,将驱动因素与重复因素分开。 分解如何进行 八种货币中的每一种都出现在二十八对中的七对中。它的强度是这七个读数的平均值,无论报价货币是什么,符号都是倒置的——澳元兑日元下跌意味着日元走强,而不是走弱。 每对货币对两种货币都有贡献——对其基础货币为正值,对其报价为负值——因此在全部 28 种货币中,这些贡献相互抵消,八种货币的优势之和为零。专家组将其用作内部检查:如果数值不平衡,分解就会错误。这也意味着读数是相对的而不是绝对的。一种货币本身并不坚挺,只是相对于其他货币坚挺。 实际效果是八个干净的数字取代了二十八个
FREE
Coral Multi TF Meter
D Armond Lee Speers
Coral Multi TF Meter allows you to quickly see how price is moving on a single currency pair across multiple timeframes at once.  You can select which timeframes to display; the size, position, colors of cells; whether to display values or not; and how often the meter is updated. The calculation is based on ATR distance for each displayed timeframe.  Hover over the header cell for the row (with the currency name in it) to see the current ATR value (in pips) for that period.  When "Display Values
MA Multi-Currencies  Multi-Timeframes Histogram BUY/SELL Indicator up to 6 currencies on time  calculations based on 6 time frames : M5, M15, M30, H1, H4, D1 Trading Strategies: **TREND shifts to UP trend when Green point appears after Red and Gray points -> Close SELL positions then add new BUY positions on new Green points  **TREND shifts to DOWN trend when Red point appears after Green and Gray points -> Close BUY  positions then add new SELL positions on new Red points ** Close BUY position
Fibo Reversals
Adeniyi Adedipe
Fibo Reversals is an indicator which has carefully been put together to attempt to indicate a time period in which an ongoing trend is most probably exhausted and a new trend (actually a reversal trend) inadvertently begins. At this, it should be okay for the manual trader to be on the look out for good trading opportunities. Input Settings Father Fibo  – This Input Determines The Highest Price For The Chosen Input Period. Son Fibo  - This Input Determines The Lowest Price For The Chosen Input
The  Complete Smart Market Concepts  indicator is your all-in-one institutional-grade tool designed to decode  Smart Money Concepts (SMC)  and reveal how the "big players" — banks, hedge funds, and institutions — truly move the forex markets. Built specifically for traders who want to trade like the smart money, this  indicator automatically identifies and plots the most essential SMC elements directly on your charts, giving you crystal-clear insights without manual drawing or guesswork.  
使用此交易工具,您可以同时扫描 15 个市场。 介绍新的交易指标 2024: ️ 仪表板多货币多时间框架随机。 我创建这个交易工具至少有两个原因: 首先,我厌倦了只观察一个市场。 其次,我不想失去进入另一个市场的时机。 这就是为什么我想同时了解其他市场状况。 因此,我需要一台可以同时扫描多个市场状况的扫描仪。 我经常寻找随机主线>(或<=)随机信号线从M1到H4(或只是M1到M30)的市场。 如果您同意我的分析,那么这就是您一直在寻找的交易指标。 不要错过市场状况满足上述要求的时刻。 这是一个随机扫描仪或仪表板,具有许多出色的功能: 可显示随机主线数据 可显示随机信号线数据 可以显示随机主线和信号线的位置(信号线上方主线或信号线下方主线) 可以显示随机主线和信号线的数据水平(看涨、看跌、趋势向上、趋势向下、超买但仍向上、超卖但仍向下) 可显示从M1到MN1的实时数据 可显示15种货币对的数据(多币种外汇/商品/加密货币/股票) 可定制参数 可定制颜色 OBOS 级别 漂亮的20仪表板配色方案 配备开/关货币对转换器 配备蜡烛高时间框架 配备时间点差利润信息 配
Fibo Linear Channel
Igor Semyonov
4 (1)
Colored indicator of the linear channel based on the Fibonacci sequence. It is used for making trading decisions and analyzing market sentiment. The channel boundaries represent strong support/resistance levels, as they are the Fibonacci proportion levels. Users can select the number of displayed lines of channel boundaries on the chart by means of the input parameters. Attaching multiple instances of the indicator to the chart with different calculation periods leads to displaying a system of c
Buy & Sell Levels with Alerts 是一款强大的综合交易指标,将随机指标(Stochastics)、前一天关键价格水平、多周期趋势仪表(MTF Trend Meter)以及蜡烛反转检测整合在一起。它帮助交易者快速识别重要支撑/阻力区域、市场趋势方向以及高概率反转信号,并通过可视化箭头和自动提醒提供辅助。 主要功能: 随机指标(Stochastic Oscillator): 在独立窗口中显示快速线 (%K) 和慢速线 (%D) 帮助识别超买与超卖行情区域 前一天价格水平(Previous Day Levels): 在图表上绘制前一天的最高价、最低价和中间线 当价格突破、回测或接近关键水平时给出提醒 反转信号箭头(Rejection Arrows): 利用影线长度、实体大小和 Pin Bar(针形线)形态检测买卖反转 绘制买/卖箭头并发送提醒,提示潜在反转机会 多周期趋势仪表(MTF Trend Meter): 使用 LWMA 显示 M5、M15、M30 周期的趋势方向 快速判断市场是偏多还是偏空 自定义提醒与通知: 当价格触达关键水平或反转区域时自动通知 可开启或
ZoneDominator AI
Mohammad Ziad Abdelwahed Alkahlah
ZoneDominator AI — Adaptive Multi-Timeframe Support & Resistance Indicator Overview ZoneDominator AI is an advanced analytical indicator that continuously scans all timeframes to locate the most accurate and relevant Support & Resistance zones. It uses a unique combination of ATR volatility, Moving Averages, Price Action, and higher-timeframe confirmation to adapt in real time to market structure. You can choose your preferred trading style — Scalping, Intraday, or Swing — and the indicat
描述 Triangle Breakout Retest Dashboard Pro Multi Symbol 是一款多品种机构级交易指标,专为基于市场结构的突破与回测交易设计。 它可以自动扫描多个货币对,识别三角形整理形态,判断突破方向,并在价格回测确认后才生成交易信号。 该工具旨在帮助交易者减少假突破,通过基于市场结构的确认入场来提高交易质量。 核心功能 三角形形态识别 自动识别上升三角形 自动识别下降三角形 自动识别对称三角形 在图表上绘制趋势线以进行可视化确认 突破检测系统 检测真实的结构突破 确定市场方向(看涨或看跌) 标记突破水平以便后续分析 回测确认系统 等待价格回到突破水平 确认价格反应后才给出入场信号 显著减少假信号 生成买入回测确认信号 生成卖出回测确认信号 多品种仪表盘 显示多个交易品种 显示当前形态 显示市场状态 显示突破或回测状态 所有品种实时更新 可点击面板 每个交易品种均可点击 快速切换图表 提高交易操作效率 报警系统 弹窗提醒 手机推送通知 图表箭头信号提示 交易逻辑 市场形成三角形整理结构 突破决定方向 回测确认入场机会 只有在价格确认反应后才执行入场
R Var 移动平均线指标是为顽固的趋势追随者设计的趋势跟踪指标。 它是股票交易者和商品交易者中非常流行的外汇交易指标,它的流行源于它能够向用户提供真正的赚钱信号。 该指标由放置在黄褐色线上的绿色和红色点组成。 绿点指向看涨信号,而红点表示看跌信号。 基本交易信号 买入信号:当指标的黄褐色线上的点变为绿色时,做多。 卖出信号:当指标的黄褐色线上的点变为红色时做空。 退出买入交易:如果在看涨趋势持续期间,指标的西耶娜线上出现红点,则关闭所有买入订单。 退出卖出交易:如果在看跌趋势持续期间,R Var 移动平均线指标的西耶纳线上显示绿点,则关闭所有卖出订单。 尖端 在使用 R Var 移动平均线指标时,利用适度的止损来防止错误信号。 将其用于各种交易方式,包括剥头皮交易和日间交易。 特征 平台:MetaTrader 4 货币对:任何 自定义选项:变量(periodAMA、nfast、nslow、G、dK、UseSound、SoundFile)、宽度和样式。 时间范围:1 分钟、5 分钟、15 分钟、30 分钟、1 小时、4 小时、1 天、1 周、1 个月 类型:趋势
FREE
Jerk Indicator
Safwan Rushdi Khalil Arekat
5 (2)
In physics, "Jerk" is the third time-derivative of position, with acceleration being the second derivative and velocity the first derivative. In technical analysis, the first derivative of price is the price momentum, with the second derivative,acceleration, being seldom used and the third derivative virtually unknown. The magnitude frequency response of a digital differentiator is a positive-slope straight line passing through zero frequency. Therefore, every instance of a digital signal differ
FREE
ToolBox 360 is the swiss knife of all indicators. It is full packed with useful tools to help you with your trading. It can be used to find best entry and exit points and help you to decide if you should open a trade or not. It shows market trends, candlestick formations outside / inside bars and you can sett time based allerts. Main features: Time based Fibonacci lines Choose a start and end time and the indicator shows you Fibonacci lines within the selected time range including range high a
Holy Trinity Volatility Indicator This indicator reflects the peak time of the day wherein there's is expected to be sharp price actions. It also presents the markets as just waking up from the dull and less volatile Asian (and or London) trading sessions into a bustling time of highly liquid price flows. NOTE: This indicator informs the trader ahead of peak price movements - one bar just before the real actions starts. Enter when the volatility line falls below the Tripple Exponential Moving Av
Top Gun Oscillators
Safwan Rushdi Khalil Arekat
5 (2)
Note : New in 1.6: the indicator now exports the trade signal (but not displayed). Go long with light blue. Go short with red. Exit otherwise. Signal to be imported to your EA using iCustom. This indicator provides Best of the Best linear filter momentum oscillators that I am aware of (Low Pass Differentiators, LPD's) . All of them are  recent developments by this developer, or other researchers. The oscillator line is the first buffer of the indicator, and can be called  in other indicators or
FREE
Smart Trend Forecasting Slope-Based Trend Analysis Indicator with Alert Support Overview Smart Trend Forecasting is a slope-based trend analysis indicator derived from a classic moving average trend model originally developed by Wizard Serg and referenced in Forex Magazine #104. The indicator is designed to monitor: Trend direction Momentum shifts Trend transition conditions Moving average slope behavior It includes visual markers and configurable alert notifications for trend state changes. Ma
交互式结构仪表盘 (Interactive Structure Dashboard): 终极多时间框架聪明的钱概念 (SMC) 指标 聪明的钱概念 (Smart Money Concepts, SMC)、结构突破 (Break of Structure, BOS) 和合理价值缺口 (Fair Value Gaps, FVG) 彻底改变了现代散户与机构交易者看待市场机制的方式。依靠传统散户支撑位和阻力位交易的时代已经过去,现代交易优势依赖于追踪银行足迹、机构流动性以及结构性转变。 InteractiveStructureDashboard MQL4 指标打破了手动多时间框架看图与全自动机构追踪之间的壁垒。它在您的 MetaTrader 4 终端内部构建了一个一体化指挥中心,能够同时扫描多个资产和时间框架,以捕捉高概率交易机会。 核心架构机制与 SMC 引擎 在其技术与数学核心中,该指标通过两个主要的运行循环来执行机构价格行为分析: 主图表引擎 (Part A): 局部运行于当前资产,使用可配置的波段周期 ( SwingPeriod ) 扫描历史价格 K 线,以识别有效的波段高点
Cool volumes
Yerzhan Satov
箭头指示器"冷量"是基于mt4上的滴答量。 指标本身跟踪在一段时间内买入或卖出的数量(时间框架选择)。 当卖家或买家的交易量出现异常过剩时,它会发出卖出或买入的信号。 在较低的窗口中绘制彩色直方图,其中绿色显示了当时买家的主导地位,这意味着在这个价格范围内可能立即逆转增加。 相反,红色表示卖方的优势,这意味着潜在的立即向下逆转。 此外,为了方便视觉感知,箭头已直接添加到主图表窗口。 为了方便用户,外部变量包含信号频率及其在历史记录(HistoryBars)上的编号的设置变量。 但不建议将值设置为1000以上。 更多的这将减慢您的终端的性能。 同样在"===<<箭头设置>>>==="部分中,您可以自己设置任何箭头和直方图参数。 直方图的厚度,箭头与蜡烛的距离,箭头代码及其颜色。 或者您可以完全禁用主图表窗口上的箭头。 箭头和信号根本不画。 即使在更改时间框架和更新终端之后。 但有必要在固定直方图和箭头后进入交易! 祝大家好运!!!
Oscillator helps determine the direction of the market Shows the direction of the price movement and is painted in the appropriate color. Allows you to conduct trend and counter trend trading It works on all timeframes, on any currency pairs, metals and cryptocurrency Can be used when working with binary options Distinctive features Does not redraw; Simple and clear settings; It works on all timeframes and on all symbols; Suitable for trading currencies, metals, options and cryptocurrency (Bitco
该产品的买家也购买
Trend SniperX MT4
Sarvarbek Abduvoxobov
5 (3)
Trend Sniper X 是一款用于 MetaTrader 5 的多周期趋势追踪指标,旨在帮助交易者清晰、精准地识别趋势方向及潜在的反转点。 适用于 MT5: https://www.mql5.com/en/market/product/181101 价格信息: 当前价格为促销价,随着后续更新和新功能的推出,价格可能会发生变动。 Code2Profit 频道 通过多周期分析掌控市场! 如何使用 Trend Sniper X 最大化胜率:关键规则与交易时段技巧 技术规格 交易平台 MetaTrader 5 指标类型 多周期趋势指标 运行时间周期 任意图表周期,支持独立选择更高周期(M1–MN1) 主要交易品种 外汇、黄金 (XAUUSD) 及其他 CFD 差价合约 推荐账户 任何账户类型 可视化呈现 彩色趋势 K 线(买入/卖出/弱势/转变)+ 买入/卖出信号箭头 附加模块 市场交易时段框(悉尼、东京、伦敦、纽约) 核心功能 多周期趋势分析: 将更高周期的趋势方向直接投影到当前图表上,提供清晰的宏观视角。 弱势/不确定 K 线检测: 高亮显示趋势状况不明确的 K 线,帮助交易者远离震
SR Liquidity
Oleg Rodin
5 (2)
SR Liquidity 是一款旨在揭示市场流动性高度集中且价格反应最剧烈的隐蔽区域的交易指标。这些特殊的流动性区域充当着强有力的支撑位与阻力位,为您清晰呈现市场最可能发生反转的位置。 SR Liquidity 指标并非简单地绘制常规的支撑/阻力线,而是通过分析实际的价格行为,识别买卖压力积聚的区域。这些区域实际上是推动市场真实波动的流动性池。通过在图表上直观呈现这些区域,该指标能助您在价格反应发生前预判走势——这意味着它实际上能够预测价格方向可能发生的变化。它将原始的价格行为转化为清晰且具实操价值的市场蓝图,标示出那些可能成为市场转折点的关键价位。 该指标适用于任何交易品种和时间周期——包括外汇、指数、金属、加密货币等。支持任意时间周期。 购买后请联系我,以获取交易指南及免费赠送的优质附加指标!
M1 Sniper
Oleg Rodin
4.97 (30)
M1 SNIPER 是一款易于使用的交易指标系统。它是一个专为 M1 时间框架设计的箭头指标。该指标可以作为独立的系统在 M1 时间框架下进行剥头皮交易,也可以作为您现有交易系统的一部分使用。虽然该交易系统专为 M1 时间框架交易而设计,但它也可以用于其他时间框架。我最初设计此方法是为了交易 XAUUSD 和 BTCUSD。但我发现这种方法在其他市场交易中也同样有用。 指标信号既可以顺势交易,也可以逆势交易。我教授一种特殊的交易技巧,帮助您利用指标信号进行双向交易。该方法基于使用特殊的动态支撑位和阻力位区域。 购买后,您可以立即下载 M1 SNIPER 箭头指标。此外,我还为所有 M1 SNIPER 工具用户免费提供下方屏幕截图所示的 Apollo Dynamic SR 指标!这两个指标的组合可以帮助您更轻松、更准确地利用 M1 时间框架进行交易。 购买后请联系我,免费获取交易提示和奖励指标! 祝您交易成功!
Miraculous Indicator Binary & Forex v3 StrategySafe Miraculous Indicator Binary & Forex v3 StrategySafe 是一款专业交易指标,适合希望获得清晰信号、强大确认工具以及结构化交易方式的 Binary 和 Forex 交易者。 v3 版本加入了 MIR Dashboard、Miraculous Confirmation Dashboard、GANN Law、Square of 9 水平线、GANN 角度以及更强的 Forex 分析模式。 核心功能 同时支持 Binary 和 Forex 交易模式。 MIR Dashboard 可快速读取市场状态。 Miraculous Confirmation Dashboard 用于确认交易机会。 GANN Law drawing lines 用于 Forex 市场结构分析。 Square of 9 线条、方向和关键价格水平。 1x1 GANN Angle 用于判断趋势压力。 Entry Information TP 帮助寻找合理止盈区域。 Strateg
Gann Made Easy
Oleg Rodin
4.84 (172)
Gann Made Easy 是一个专业且易于使用的外汇交易系统,它基于使用先生理论的最佳交易原则。 W.D.江恩。该指标提供准确的买入和卖出信号,包括止损和获利水平。您甚至可以使用推送通知在旅途中进行交易。 购买后请联系我,即可免费获得交易指导和超棒的额外指标! 您可能已经多次听说过江恩交易方法。通常 Gann 的理论不仅对于新手交易者而且对于那些已经有一定交易经验的人来说都是非常复杂的东西。这是因为江恩的交易方法在理论上并不那么容易应用。我花了几年时间来完善这些知识,并将最好的原则应用到我的外汇指标中。 该指标非常易于应用。您所需要的只是将其附加到您的图表并遵循简单的交易建议。该指标不断进行市场分析工作并寻找交易机会。当它检测到一个好的入口点时,它会为您提供一个箭头信号。该指标还显示止损和获利水平。 换句话说,当您像先生一样进行交易时,该指标会为您提供最佳江恩建议。江恩亲自告诉你此时此刻该做什么。但最好的部分是您不需要了解任何有关江恩交易原则的知识,因为该指标会为您完成整个市场分析工作。
Scalper Inside PRO
Alexey Minkov
4.74 (69)
Scalper Inside PRO 帮你分析日内趋势,在入场前就把交易规划好。核心是三套专属策略,让你更精准地读懂市场。信号一出现,指标就自动判断行情方向并计算关键价位,你能提前看到潜在入场点、预期的止损以及多个止盈位。详尽的绩效统计会展示不同品种和策略在历史上的表现,帮你根据当前行情挑选合适的资产。它既可以作为独立的剥头皮工具,也可以融入你的系统,或者作为你自己 EA 的基础。运行于 MetaTrader 4 平台。 指标会直接在图表上标出入场、三个止盈位 - TP1、TP2、TP3 以及一个可选止损。你甚至可以接入自己的箭头指标,检验它们的统计数据和盈利能力。 购买后请直接联系我,即可获得指标的专属附赠 add-ons、更多关于实盘运用的说明,以及把它正确接入你自己交易系统和 EA 的帮助。 指标主要功能 内置三套专属交易策略,可即时切换。 箭头信号出现后即时计算价位:入场以及 TP1、TP2、TP3 多级目标立刻显示,方便你提前规划交易。开启手动或自动计算后,会显示止损位。 三套策略均内置优化模块:自动把参数适配到当前品种和周期,帮你快速筛选资产(仅在实时状态下可用)。 HTF
Tokyo Indicator(东京指标)直观地展示了趋势方向、潜在交易信号及市场状况。 其采用颜色编码的阶梯式趋势线,以蓝色标识看涨阶段,以洋红色标识看跌阶段。配套的方向箭头会在趋势发生变化时,标示出潜在的买入与卖出机会。 内置的综合仪表盘将当前信号、市场倾向、动能、波动率及信号质量整合于同一视图中,方便交易者在观察价格走势的同时评估指标数据,无需在不同面板间切换。 凭借清晰的图表显示和简洁的市场概览,Tokyo Indicator 支持以系统化的方式进行趋势分析与交易确认。 适用于任何时间周期及各类交易品种,尤其适合黄金交易。 购买后请立即联系我,以获取专属赠品!您可以免费获得我们的“强力支撑与趋势扫描”(Strong Support and Trend Scanner)指标,请私信我! 设置说明与使用手册请见此处。 请注意:我不会在 Telegram 上出售我的 EA 或特殊参数设置(set files);我的 EA 仅在 Mql5 平台上提供,而参数设置文件仅在我的博客(此处链接)上发布。请务必警惕诈骗,切勿从他人处购买任何参数设置! 设置 ShowHUD —— 在图表上显示
DayTrader PRO MT4
Davit Beridze
4.6 (10)
DayTrader PRO MT5:  https://www.mql5.com/en/market/product/186222 DayTrader PRO 是一款先进的交易指标,它结合了约翰·埃勒斯 (John Ehlers) 的 Laguerre 滤波器与强大的自动优化引擎。该指标不依赖固定的参数,而是根据最新的市场状况自动搜寻最佳设置,帮助您在无需手动调整的情况下适应不断变化的市场波动。 该指标可生成清晰的买入 (BUY) 和卖出 (SELL) 信号,并提供根据当前市场波动率计算得出的自适应止损 (Stop Loss) 和止盈 (Take Profit) 水平。内置的趋势、效率系数 (Efficiency Ratio)、波动率和蜡烛图过滤功能,有助于剔除低质量的交易设置,从而提高信号的准确性。 实时性能面板会显示当前已优化的设置、利润因子 (Profit Factor)、胜率 (Win Rate)、回撤 (Drawdown) 以及其他交易统计数据。DayTrader PRO 还支持弹出窗口、推送、邮件和声音提醒,确保您不会错过任何交易机会。 主要功能 全自动参数优化 自适应买入
Smart Trend Trading System
Issam Kassas
4.8 (10)
本产品已针对 2026 年市场进行更新,并针对最新 MT5 版本进行了优化。 价格更新通知: Smart Trend Trading System 目前价格为 $99 。 接下来的 30 次购买 后,价格将上涨至 $199 。 特别优惠: 购买 Smart Trend Trading System 后,请发送私信给我,即可免费领取 Smart Universal EA ,并将您的 Smart Trend 信号转换为自动交易。 Smart Trend Trading System 是一套完整的交易系统,具备不重绘、不回绘、不延迟的特点,专为希望获得更清晰信号、更准确趋势方向以及更有组织交易方式的交易者打造。 Online course , manual and [download presets] . 它将 10 多种交易工具 整合到一个系统中,包括趋势检测、反转区域、Smart Cloud、移动止损逻辑、支撑与阻力、K线着色、提醒以及多周期分析。 该系统旨在帮助您应对不同的市场环境: 趋势市场: 识别主要趋势,发现回调,跟随动能,并通过止损指导和移动止损选项寻找更清晰的入场机会。
成交量突破震荡指标是一种以震荡指标的形式将价格变动与成交量趋势相匹配的指标。 我想将成交量分析整合到我的策略中,但大多数成交量指标都令我失望, 例如 OBV、资金流量指数、A/D,还有成交量加权 Macd 和许多其他指标。 因此,我为自己编写了这个指标,我对它的实用性感到满意,因此我决定将其发布到市场上。 主要特点: 它突出显示了价格在成交量增加(突破)支持下朝某个方向移动的阶段。 它突出显示了成交量增加停止并因此市场收缩的阶段。 它突出显示了价格和成交量均未移动的阶段,尤其是在时间范围(<=15 分钟)的日内交易中,因此市场已为未来的运行做好准备。 当其他 EA 交易程序发出的虚假信号不受交易量增加的支持时,可过滤掉这些信号。 它使趋势和范围阶段可视化变得非常容易 输入参数: 计算设置: 计算类型:快速、正常、慢速,用于监控短期、中期和长期,保持在同一时间范围内。 计算周期:计算周期 交易量设置: 交易量类型:TickVolume(主要用于外汇)和RealVolume(用于股票市场) 信号设置: 信号周期:信号线周期 突破水平:突破信号的阈值水平 警报设置 警报类型:收盘
Trend Catcher ind
Ramil Minniakhmetov
5 (11)
趨勢捕捉指標 趨勢捕捉指標結合了作者獨有的客製化自適應趨勢分析指標,用於分析市場價格趨勢。它透過過濾掉短期噪音,並專注於潛在的動能強度、波動性擴張和價格結構行為,來識別真實的市場方向。此外,它還結合了平滑和趨勢過濾等客製化指標,例如移動平均線、相對強弱指標 (RSI) 和波動率過濾器。 您可以在這裡查看實際運行情況以及我的其他產品: https://www.mql5.com/en/users/mechanic/seller 請注意,我不會在 Telegram 上出售 EA 或任何設置,那是騙局。所有設定都可以在我的部落格上免費取得。 重要提示!購買後請立即聯繫我,以獲取使用說明和額外獎勵! 請注意,我不會在 Telegram 上出售 EA 或任何設置,那是騙局。所有設定都可以在我的部落格上免費取得。
True Signal FX 是一款适用于 MetaTrader 4 的多时间框架交易指标,旨在直接在图表上提供完整的交易分析方案。 该指标不仅提供单一的方向信号,还将市场分析、信号确认以及交易水平计算整合到同一个工作界面中。当检测到交易方案时,交易者可以同时看到交易方向、入场价格(Entry)、止损(Stop Loss)和止盈(Take Profit),以及当前信号评分和市场状态信息。 True Signal FX 适用于希望围绕明确交易方案进行决策的交易者,无需针对每一个潜在交易机会手动比较多个技术指标并单独计算交易水平。 True Signal FX 不会自动执行交易。指标负责提供分析结果和交易方案,最终是否开仓以及订单执行由交易者自行决定。 工作原理 True Signal FX 会在多个选定的时间框架上分析市场,并分别计算买入(BUY)和卖出(SELL)评分。 默认配置使用 M5、M15、M30、H1 和 H4,最多可以同时配置 5 个分析时间框架。 此外,指标使用独立的触发时间框架(Trigger Timeframe)来确定新的交易方案何时满足激活条件。默认触发时间框架为
PZ Support Resistance
PZ TRADING SLU
3.33 (3)
厌倦了绘制支撑线和阻力线? 支撑阻力 是一个多时间指标,可以自动检测并绘制图表中的支撑线和阻力线,并具有非常有趣的变化:随着时间的推移测试价格水平及其重要性的提高,线变得越来越粗。 [ 安装指南 | 更新指南 | 故障排除 | 常见问题 | 所有产品 ] 一夜之间增强您的技术分析 无需浏览图表即可检测重要的价格水平 一目了然地识别所有价格水平的相对优势 每次交易最多可节省半小时的绘图线 指标显示所有价格水平的期限 指示器不重涂 过去和现在的价格水平因接近程度而崩溃,并根据当前的市场行为进行了调整。在动作发生的地方绘制了线条,而不一定在峰值处绘制了线条。 价格水平随着时间的推移而被拒绝,变得越来越暗 定期清除不重要的价格水平以避免噪音 可自定义的时间范围选择和崩溃因子 它实现了电子邮件/声音/推送警报的突破 输入参数 指标设置:指标将从当前时间段读取价格,但您可以选择另一个。例如,您可以在H4图表中显示D1支撑线和阻力线。您还可以使用 价格水平密度 参数选择在图表上显示多少价格水平。 颜色设置:根据重要性输入所需的支撑线和阻力线颜色。 标签设置:(可选)可以在指示器中显示用于
Dynamic Forex28 Navigator
Bernhard Schweigert
4.43 (7)
Dynamic Forex28 Navigator - 下一代外汇交易工具。 当前 49% 折扣。 Dynamic Forex28 Navigator 是我们长期流行的指标的演变,将三种功能合二为一: 高级货币强度 28 指标 (695 条评论)+ 高级货币 IMPULSE 带警报 (520 条评论)+ CS28 组合信号(奖励)。 有关指标的详细信息 https://www.mql5.com/en/blogs/post/758844 下一代强度指标提供什么? 您喜欢的原始指标的一切,现在通过新功能和更高的精度进行了增强。 主要特点: 专有货币强度公式。  所有时间范围内的平滑和准确的强度线。 非常适合识别趋势和精确进入。 动态市场斐波那契水平(市场斐波那契)。  此指标独有的独特功能。 斐波那契应用于货币强度,而不是价格图表。 适应实时市场活动以获得准确的反转区域。 实时市场动量。  第 9 行显示市场是活跃还是被动。 对于定时交易至关重要。 全面的警报和显示。  每种货币最强的买入和卖出动量。 ​​28 对的双重动量买入和卖出。 超买/超卖警告外部范围和止损。 反转
Neuro Poseidon MT4
Daria Rezueva
4.74 (46)
Neuro Poseidon is a new indicator by Daria Rezueva. It combines precise trading signals with adaptive TP/SL levels - creating best possible trades as a result! Message me and get  Neuro Poseidon Assistant  as a gift to automize your trading process! What makes it stand out? 1. Proven profitability on all assets and timeframes 2. Only confirmed BUY and SELL signals present on the chart 3. Adaptive TP & SL levels generated by the software for each trade 4. Easy to understand - suitable for all
Quantum Breakout Indicator PRO
Bogdan Ion Puscasu
4.96 (26)
介绍     Quantum Breakout PRO   ,突破性的 MQL5 指标,正在改变您交易突破区域的方式!   Quantum Breakout PRO 由拥有超过 13 年交易经验的经验丰富的交易者团队开发,旨在通过其创新和动态的突破区域策略将您的交易之旅推向新的高度。 量子突破指标将为您提供带有 5 个利润目标区域的突破区域的信号箭头,以及基于突破框的止损建议。 它既适合新手交易者,也适合专业交易者。 量子 EA 通道:       点击这里 MT5版本:   点击这里 重要的!购买后请私信我领取安装手册。 建议: 时间范围:M15 货币对:GBPJPY、EURJPY、USDJPY、NZDUSD、XAUUSD 账户类型:ECN、Raw 或 Razor,点差极低 经纪商时间:GMT +3 经纪商:IC Markets、Pepperstone with Raw 和 Razor 的点差最低 规格: 不重漆! 最多 5 个建议利润目标区域 建议止损水平 可定制的盒子。您可以设置自己的 Box Time Start 和 Box Time End。 接触 如果您
目前八折优惠! 对任何新手或专家交易者来说都是最好的解决方案! 这个仪表板软件适用于28种货币对。它基于我们的两个主要指标(高级货币强度28和高级货币冲动)。它对整个外汇市场提供了一个伟大的概述。它显示高级货币强度值,货币运动速度和28个外汇对在所有(9)时间段的信号。想象一下,当你可以使用图表上的单一指标观察整个市场,以确定趋势和或剥头皮的机会时,你的交易将得到改善 我们已经在这个指标中建立了一些功能,使你更容易识别强势和弱势货币,同时识别和确认潜在的交易。该指标以图形方式显示货币的强势或弱势是增加还是减少,以及它在所有时间段的表现。 增加的新功能是动态市场斐波那契水平,它适应当前的市场条件变化,这是一个已经在我们的高级货币强度28和高级货币冲动指标中使用的成熟的加分项。 在交易时,总是将弱势货币和强势货币配对,这个新指标将帮助你做到这一点。 用户手册:点击这里  https://www.mql5.com/en/blogs/post/708783 特点  显示每个时间段的ACS28和GAP-speed(冲动)的货币强度值。 列:颜色代码以7种颜色显示货币强度:强势
System Trend Pro
Aleksandr Makarov
5 (3)
The indicator no repaint!!!  The indicator has   MTF   mode, which adds confidence to trading on the trend (   no repaint   ). How to trade? Everything is very simple, we wait for the first signal (big arrow), then wait for the second signal (small arrow) and enter the market in the direction of the arrow. (See screens 1 and 2.) Exit on the opposite signal or take 20-30 pips, close half of it, and keep the rest until the opposite signal. By the way, it is on Scalping that most traders make m
CRT Candle Range Theory HTF MT4 - Ultimate CRT Indicator: 高级ICT概念与马来西亚SnR交易系统 使用最先进的 Candle Range Theory 指标掌握做市商的足迹。释放 Smart Money Concepts (SMC) 的真正力量,并使用 Ultimate CRT Indicator 像机构一样精确交易。该指标专为严肃的交易者打造,自动化了高效的蜡烛范围理论 (CRT)——ICT概念 (Inner Circle Trader) 的核心支柱,并通过马来西亚支撑与阻力 (SnR) 入场方法和 FVG (不平衡) 区域的致命精度对其进行了强化。 无论您是在 MT4 或 MT5 上交易外汇、加密货币还是指数,该算法都能消除市场噪音,过滤虚假突破,并将高概率、高回报的交易区域直接传送到您的图表上。 CRT Indicator 的核心功能: Absolute Extreme SnR Entry Engine: 与依赖滞后吞没形态的传统指标不同,我们的系统采用了马来西亚 SnR 技术。它在严格的时间窗口内扫描绝对最高的 Buy-
Pro Trend Scanner
Nikolay Georgiev
5 (1)
Update: Push to mobile notification is now added as optinal in the settings. Most traders fail to generate profit because of the lack of so-called filters and scanners. If you want to win at trading you need a solid system and also a filtering tool for some or all of your entry criteria. It is impossible to follow 24 currency pairs, all the indices, stocks and commodities without a filtering tool. Imagine you can get an email any time CCI crosses bellow 100 and 0 when the price is bellow MA5 an
Top Bottom Tracker MT4
Rodrigo Arana Garcia
Top Bottom Tracker 是一款基于复杂算法的指标,可分析市场趋势并检测趋势的高点和低点 / MT5 版本。 价格将逐步上升,直至达到 500 美元。下一个价格 --> $99 功能特点 无重绘 新数据到来时 该指标不会改变其数值 交易货币对 所有外汇货币对 时间框架 所有时间框架 参数 ==== 指标配置 ==== 配置参数 // 40(值越高,发出的信号越少但越准确) 上水平值 // 80(上水平线的值) 下水平线值 // 20(下水平线值) 指标计算条数 // 3000(您希望指标计算多少条。数值 0 将计算所有条形图的指标) ==== 警报配置 ==== 弹出警报 // true (在终端上发出警报) 电子邮件报警 // true (通过电子邮件报警) 警报时间间隔 // 10 (警报时间间隔,以分钟为单位) 警告 我只在 MQL5.com 上销售我的产品。如果有人联系您向您推销我的产品,那么他们就是骗子,只想要您的钱。 此外,如果您从外部网站购买我的产品,我向您保证,这些产品都是假冒版本,与正版产品效果不同。
PZ Trend Trading
PZ TRADING SLU
4.8 (5)
许多盈利交易者不仅知道如何识别市场趋势,而且也能把握趋势建立后的交易机会。 Pz 趋势交易 指标设计用来在趋势行情中尽可能的赚取利润。 已建立的趋势提供了一揽子交易机会,但大多数趋势交易指标完全忽视了它们,让交易者在趋势行情时完全不知道该如何做!一般趋势指标只通知有关的趋势变化,但根本不足以得到卓越的回报. Pz 趋势交易 指标比一般趋势指标显示多达 20 倍的交易 , 因为它注重所谓的市场时机。它不仅显示当前的市场趋势,也有回调,内柱线的突破和调整。它令您在趋势回调之后介入,安全的柱线内突破金字塔加仓,以及发现潜在的反转,和已知的调整。 趋势改变 一个趋势改变在市场方向变化时发生。趋势变化在图表上用带数字的彩色圆圈显示。蓝色 (1) 信号为上涨开始, 而红色 (1) 信号为下跌开始。趋势变化并非评估当前价格动作的结果, 它意味着交易设置是不定时地。如果您正确使用本指标, 在趋势变化时, 您将将已经入场 (参看下面的调整)。 回调 但凡趋势在运动中,行情上下抖动,盈利者收割利润,且其它参与者入场。趋势回调代表好的买入机会,通常是由主力获利离场导致。如果行情在回调后回归上行, 指标将
Price Breakout pattern Scanner is the automatic scanner for traders and investors. It can detect following patterns automatically from your chart. Head and Shoulder - Common tradable pattern. Reverse Head and Shoulder - This pattern is the reverse formation of the Head and Shoulder. Double Top - When the price hits resistance level twice and decline toward the support level, the trader can anticipate sudden bearish breakout through the support level. Double Bottom - The double bottom pattern is
适用于 MT4 的 Crypto_Forex 指标“上吊线和倒锤线 Pro”,无需重绘,无延迟。 - “上吊线和倒锤线 Pro”指标是一款非常强大的价格行为交易指标。 - 指标可检测图表上的看涨倒锤线和看跌上吊线形态: - 看涨倒锤线 - 图表上显示蓝色箭头信号(见图)。 - 看跌上吊线 - 图表上显示红色箭头信号(见图)。 - 提供 PC 和移动端提醒。 - “上吊线和倒锤线 Pro”指标非常适合与支撑/阻力位和挂单结合使用。 - 指标具有信息显示功能 - 显示与其关联的外汇对的当前点差和隔夜利息。 - 信息显示还显示账户余额、净值和保证金。 - 信息显示可放置在图表的任意位置 . Click here to see high quality Trading Robots and Indicators! 本产品为独家产品,仅在本 MQL5 网站上提供。
Prop Firm Sniper
Mohamed Hassan
4.33 (6)
Prop Firm Sniper MT4  is a professional market structure indicator that automatically identifies high-probability BUY and SELL opportunities using BOS and CHoCH analysis. Recommended Timeframes: For backtesting, use the indicator on   M5 or M15   for Gold (XAUUSD), and   M15 or H1   for more volatile Forex pairs such as   GBPUSD, USDJPY, EURGBP , and similar markets. CONTACT ME AFTER PURCHASE TO CLAIM YOUR FREE BONUSES! Prop Firm Sniper  is a professional market structure indicator designed t
Currency Strength Exotics
Bernhard Schweigert
4.88 (33)
目前8折优惠! 对任何新手或专家交易者来说都是最好的解决方案! 这个指标是专门用来显示任何符号的货币强度,如异国货币对、商品、指数或期货。它是同类产品中的第一个,任何符号都可以添加到第9行,以显示黄金、白银、石油、DAX、US30、MXN、TRY、CNH等的真实货币强度。这是一个独特的、高质量的、负担得起的交易工具,因为我们已经纳入了一些专有的功能和一个新的公式。想象一下,你的交易将如何改善,因为你能够准确地确定新趋势或剥头皮机会的触发点? 用户手册:点击这里   https://www.mql5.com/en/blogs/post/708876 它适用于所有时间框架。你将很快能够看到TREND! 根据新的基础算法设计,它使识别和确认潜在交易变得更加容易。这是因为它以图形方式显示了8种主要货币和一种符号的强弱。 该指标显示了8种主要货币(澳元加元瑞士法郎欧元英镑日元新西兰美元)的强弱线,再加上一个符号! 该指标显示了符号的真实价值。例如:对于XAUUSD(黄金):价格以美元报价。如果黄金在上涨,你怎么能知道是黄金的强势还是美元的弱势?只有当黄金走强时,我们才会进行交易。该指
Mean Reversion Supply Demand Indicator Mean Reversion Supply Demand is the indicator to detect the important supply demand zone in your chart. The concept of supply demand trading relies on the quantity mismatching between buying and selling volumes in the financial market. Typically, supply demand zone serves to predict the turning point. The wave pattern, for any supply demand zone to work as an successful trade, looks like the price must touch the base zone, move away and then return to zone
Liquidity Scalper System
Stanislav Konin
5 (1)
Liquidity Scalper System  is a next-generation professional trading system that combines spectral market structure analysis, the dynamic  Liquidity Spectrum  liquidity heatmap, and an intelligent market imbalance assessment algorithm. The system continuously analyzes changes in price structure, identifies probable areas of limit and stop order concentration, detects potential liquidity pools, and evaluates the strength of breakout momentum. To achieve maximum accuracy, it additionally uses mul
Easy Breakout
Mohamed Hassan
4.71 (14)
After your purchase, feel free to contact me for more details on how to receive a bonus indicator called VFI, which pairs perfectly with Easy Breakout for enhanced confluence!    Easy Breakout is a powerful price action trading system built on one of the most popular and widely trusted strategies among traders: the Breakout strategy ! This indicator delivers crystal-clear Buy and Sell signals based on breakouts from key support and resistance zones. Unlike typical breakout indicators, it levera
Atomic Analyst
Issam Kassas
5 (13)
本产品已针对 2026 年市场进行更新,并针对最新 MT5 版本进行了优化。 价格更新通知: Atomic Analyst 目前价格为 $99 。 接下来的 30 次购买 后,价格将上涨至 $199 。 特别优惠: 购买 Atomic Analyst 后,请发送私信给我,即可免费领取 Smart Universal EA ,并将您的 Atomic Analyst 信号转换为自动交易。 Atomic Analyst 是一款不重绘、不回绘、不延迟的 Price Action 交易指标,专为手动交易、清晰信号和 EA 自动化而设计。 User manual: settings, inputs and strategy.      &   User Manual PDF . 它分析价格行为、强度、动能、多周期方向和高级过滤器,帮助交易者减少噪音,避免弱势交易机会,并做出更有结构的交易决策。 该指标将复杂的市场计算转换为简单的视觉信号、彩色K线、趋势读数、止损水平和多个止盈区域,使交易者能够快速理解并应用于真实市场环境。 主要交易用途: 剥头皮和日内交易: 专为快速决策、清晰箭头、提醒、K线
作者的更多信息
Candlestick Confluence Detector Candlestick Confluence Detector scores candlestick confluence across your chart and up to three higher timeframes — without manually cross-checking each one. It detects 16 classic price-action patterns, grouped into three dedicated engines: Rejection Continuation Warning Each pattern receives a 0–100 confluence score. Every label is traceable to a documented, user-adjustable rule set. KEY FEATURES • 16 candlestick patterns across 3 purpose-built engines: Rejecti
StructuraX
Ibe Hyginus Ugwoke
StructuraX Non-repainting market structure analysis with a mechanical bias score, optional higher-timeframe context, key levels, and risk-based reference calculations. Overview StructuraX is a rule-based market structure indicator designed to turn price action into a structured analytical framework. It analyses the current chart timeframe for: Market structure: HH/HL and LH/LL Confirmed Break of Structure (BOS) Dominant impulse and retracement depth Momentum thrust Compression Key structural zon

筛选:
无评论
回复评论