Order Block Intelligence Engine
- 지표
-
Ibe Hyginus Ugwoke
 I’m an MQL4/MQL5 developer and active trader. I build and personally test the trading tools I develop, which gives me a practical understanding of edge cases, signal timing, and the differences between backtest and live behaviour.
 - 버전: 1.2
- 활성화: 5
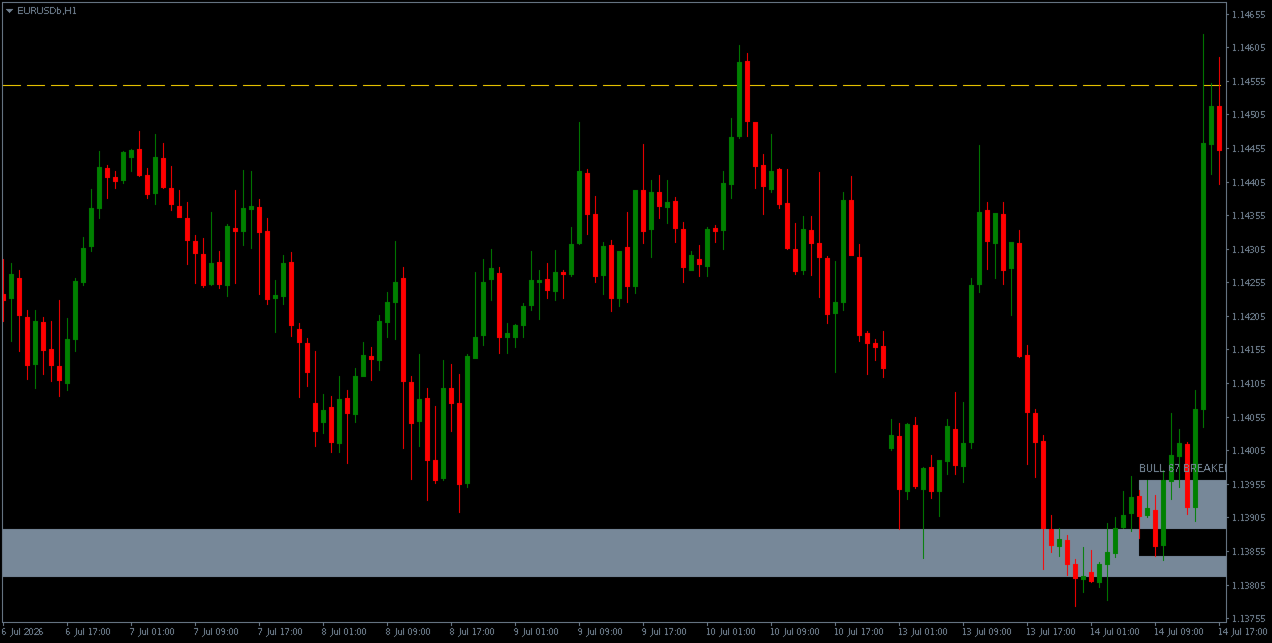
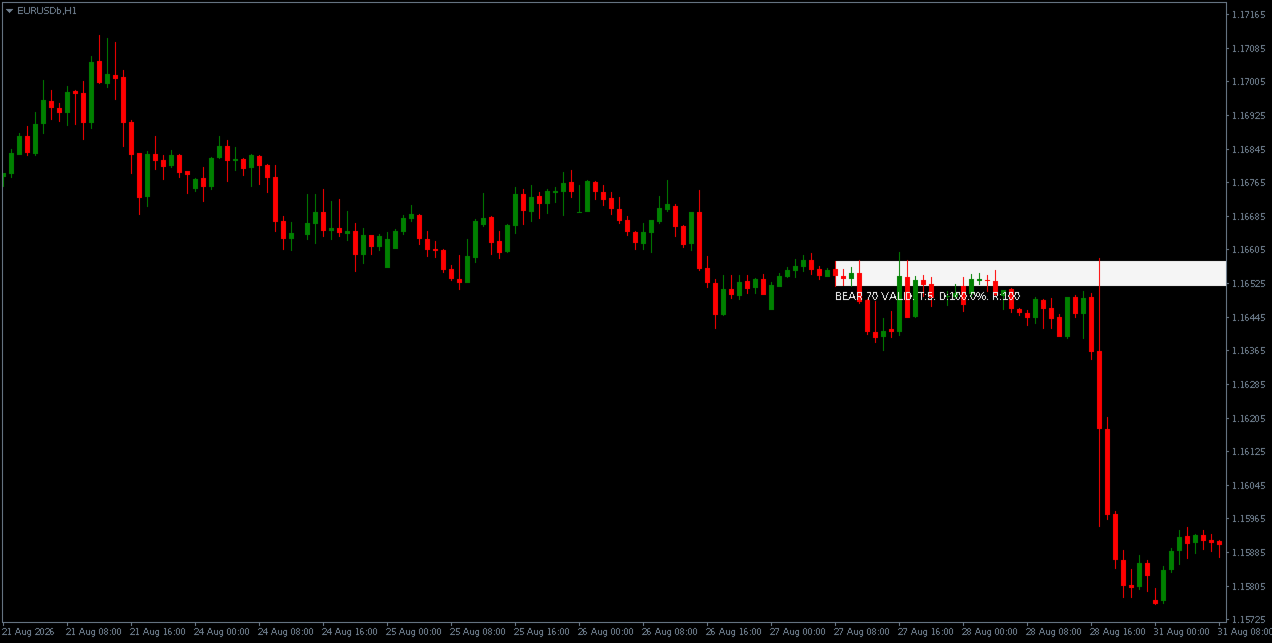
Detects order block zones using confirmed swing structure, break-of-structure with displacement, and a multi-factor quality score. Tracks each zone through a five-state lifecycle and optionally projects a next target level.
OVERVIEW
The indicator identifies order block zones on the current chart timeframe.
Each zone is defined by the origin candle (or base of consecutive candles) that preceded a break of structure, and by the swing point whose break confirmed the move.
Zones are only created after the break of structure is confirmed by a closed bar.
Each zone is evaluated by a heuristic quality score between 0 and 100, computed from six weighted components. The score is used to filter zones below a user-configurable threshold.
Each zone then transitions through a lifecycle of states as price interacts with it, and optionally projects a next target level drawn as a horizontal line.
Detection uses only OHLC prices and ATR.
It does not use volume, order flow, market profile, tick data, or any external source.
It does not identify institutional activity and does not claim to do so.
KEY FEATURES
• Dual swing detection: internal (minor) and external (major) swing points, weighted differently in the score
• Break-of-structure confirmation: zones require a closed bar that breaks the prior swing extreme with a minimum displacement body
• Multi-candle origin detection: the origin zone walks back through the base candles preceding the break, ending at the last opposite candle before the break of structure, up to a user-configurable maximum
• Multi-factor scoring: structure, displacement, liquidity sweep, origin base quality, fair value gap, and higher-timeframe alignment
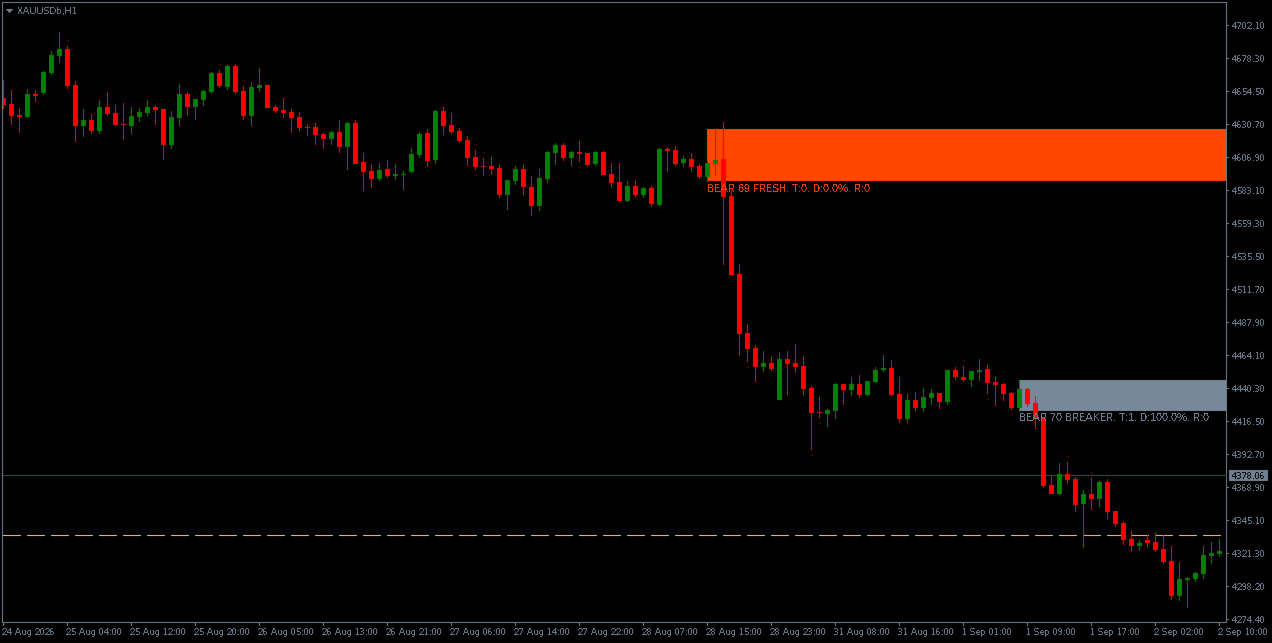
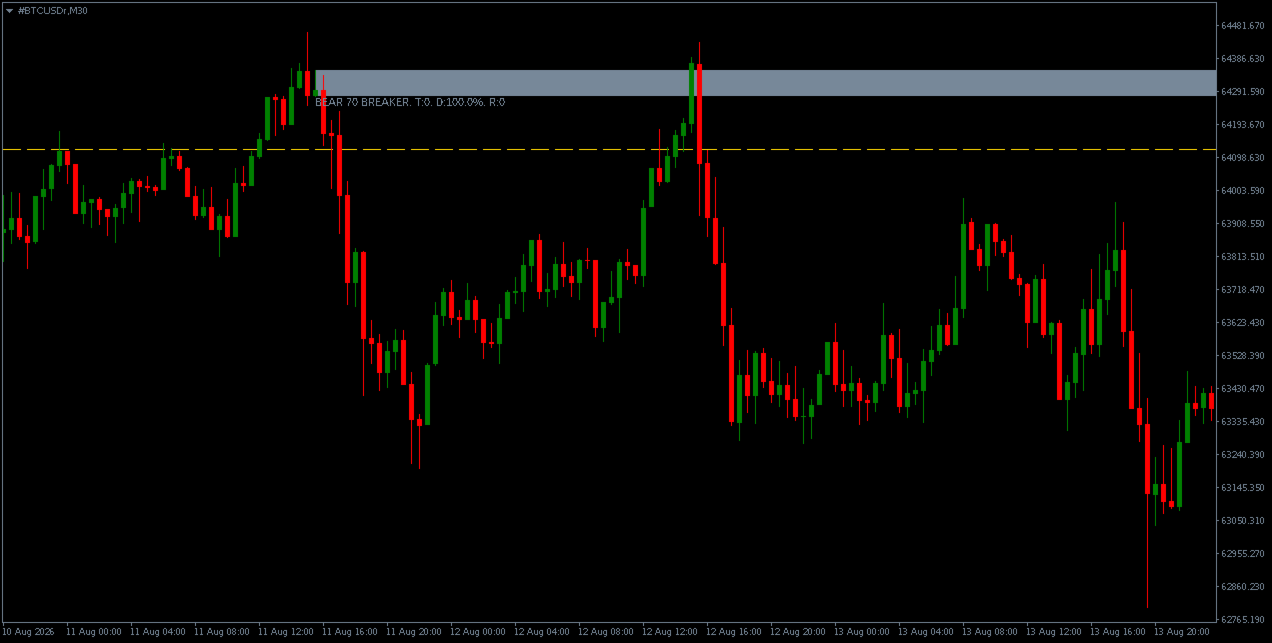
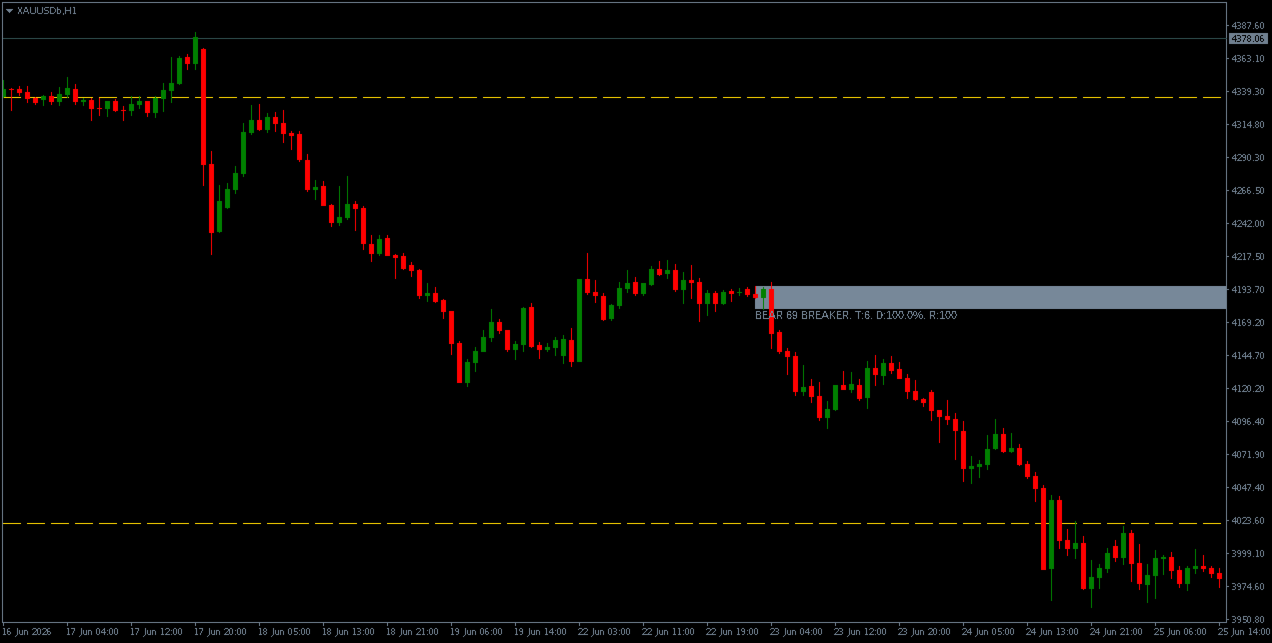
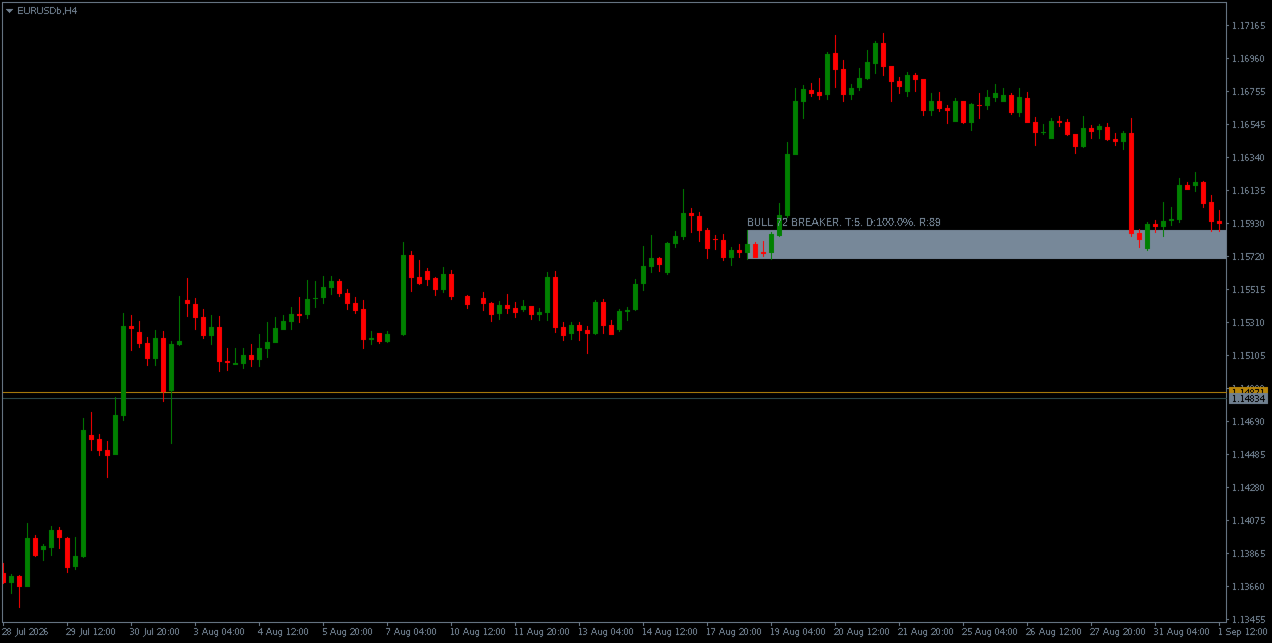
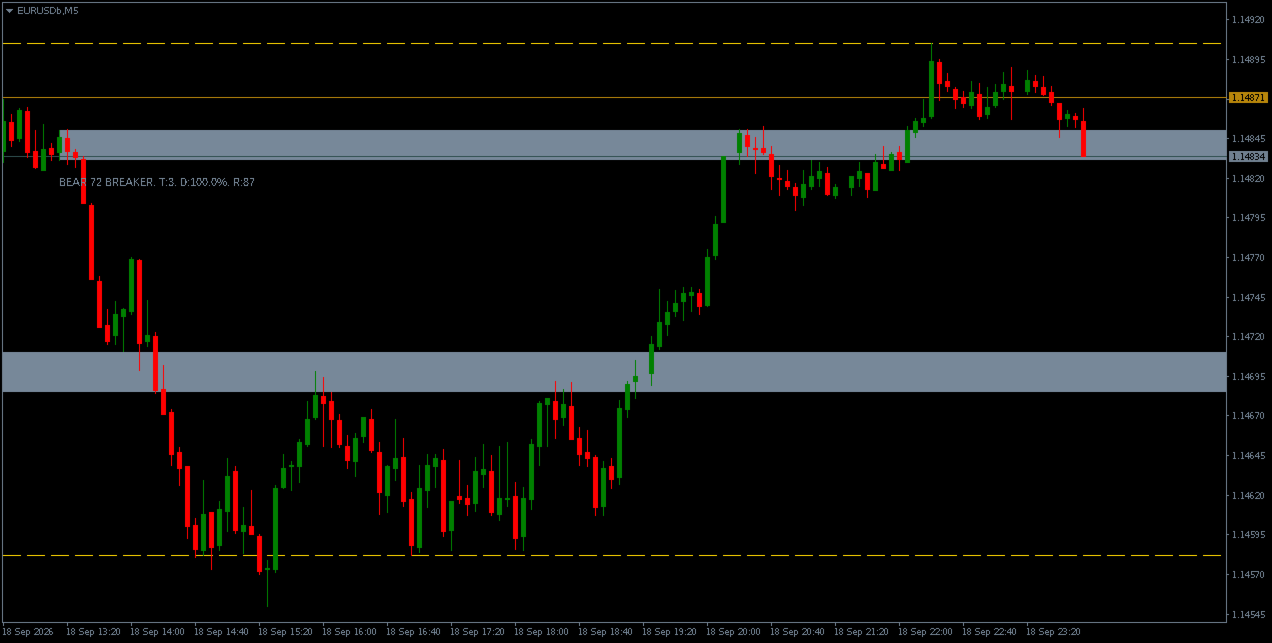
• Lifecycle state tracking: FRESH, TESTED, REACTING, VALID, BREAKER
• Optional target projection: the next opposite-type zone or unbroken swing level is drawn as a horizontal line
• Optional session filter, HTF alignment filter, and reaction timeout
• Overlap management: zones whose range overlaps an existing same-type zone by more than 50 percent are not drawn
• Alerts on new zone, first touch, reaction confirmed, and zone invalidated
ABOUT THE SCORE
Each zone produces a score between 0 and 100.
The score is a heuristic value computed from six weighted components.
The score is not:
• A probability
• A win rate
• A validated measure of trading outcome
A score of 75 does not mean the zone has a 75 percent chance of working.
It means the zone satisfied more of the six conditions that the scoring model rewards.
Every component weight is exposed as an input parameter, so users can adjust the emphasis of the model or disable components entirely.
Default minimum score for display: 67
WHAT THE SCORE EVALUATES
Structure Break
Zones derived from confirmed external swings receive more weight than zones derived from internal swings.
External swings are longer-term and structurally more significant than internal swings.
Displacement Quality
The break-of-structure candle is evaluated by:
• Body size
• Proportion of the range occupied by the body
• Location of the close within its range
A candle with a large body, small wicks, and a close at the extreme of its range receives the highest displacement credit.
Liquidity Sweep
If a bar between the break-of-structure candle and a recent opposite swing took out a prior swing level and then closed back inside, the zone receives the full liquidity credit.
This component is present or absent.
The default lookback window is configured wide enough that both internal-length and external-length sweeps are reachable under default settings.
Origin Base Quality
The origin zone is evaluated by:
• How tight its range is relative to ATR
• How many candles it contains
Tighter zones and larger bases score higher.
This component is scaled down when the break-of-structure candle's displacement falls below the configured gate, so a weakly displaced break receives only partial origin credit rather than none.
Fair Value Gap
If a three-bar imbalance exists between the origin zone and the break-of-structure candle in the direction of the move, the zone receives the full FVG credit.
This component is present or absent.
Higher-Timeframe Alignment
If enabled, the closing price of the break-of-structure bar is compared to an EMA on a user-selected higher timeframe.
If price is on the correct side of the EMA, the zone receives the full alignment credit.
This component can be disabled entirely, in which case its weight is not awarded to any zone.
The alignment uses the last fully completed higher-timeframe bar, so the score for a historical zone does not change once its break-of-structure bar has closed.
If the selected higher timeframe is not above the chart timeframe, or if insufficient higher-timeframe history is loaded, the component contributes nothing rather than awarding credit it cannot verify.
LIFECYCLE STATES
Each zone transitions through states as price evolves:
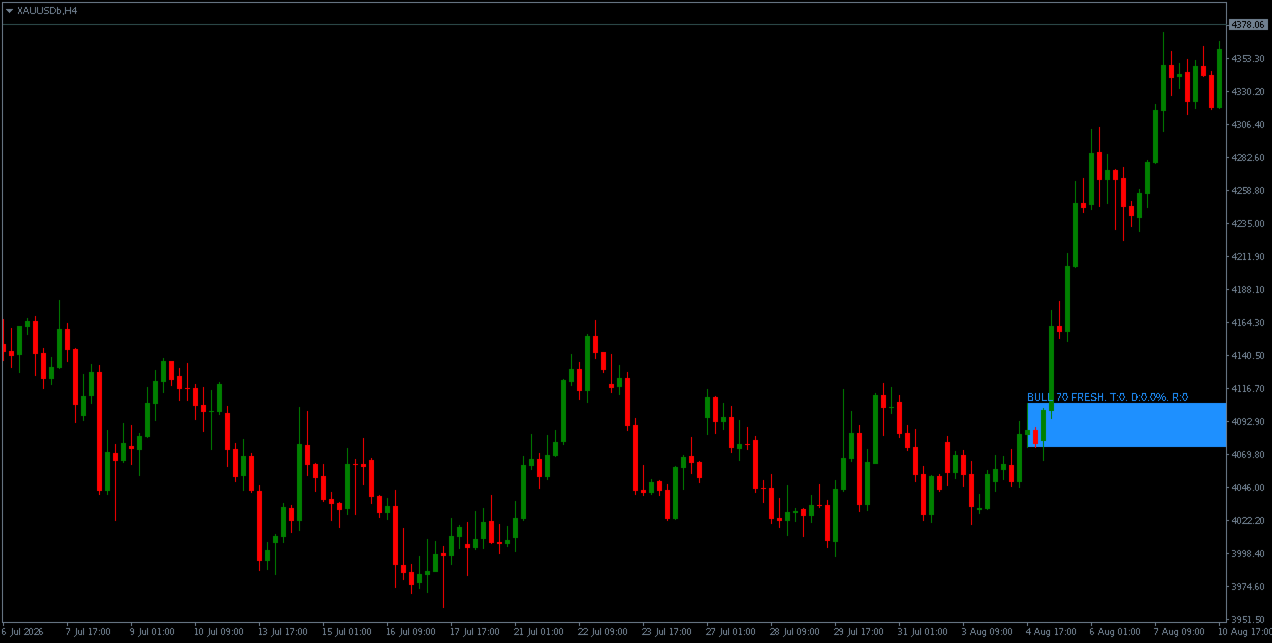
FRESH
The zone has been created and price has not returned to it.
Highest-potential state.
TESTED
Price has entered the zone at least once.
The touch count and maximum penetration percentage are updated on each touch.
REACTING
Price has tested the zone and has begun moving away, but the reversal has not yet been confirmed by a close beyond the zone boundary.
VALID
Price has closed beyond the far edge of the zone in the expected direction.
The reaction score is computed from the distance of the closing bar from the zone.
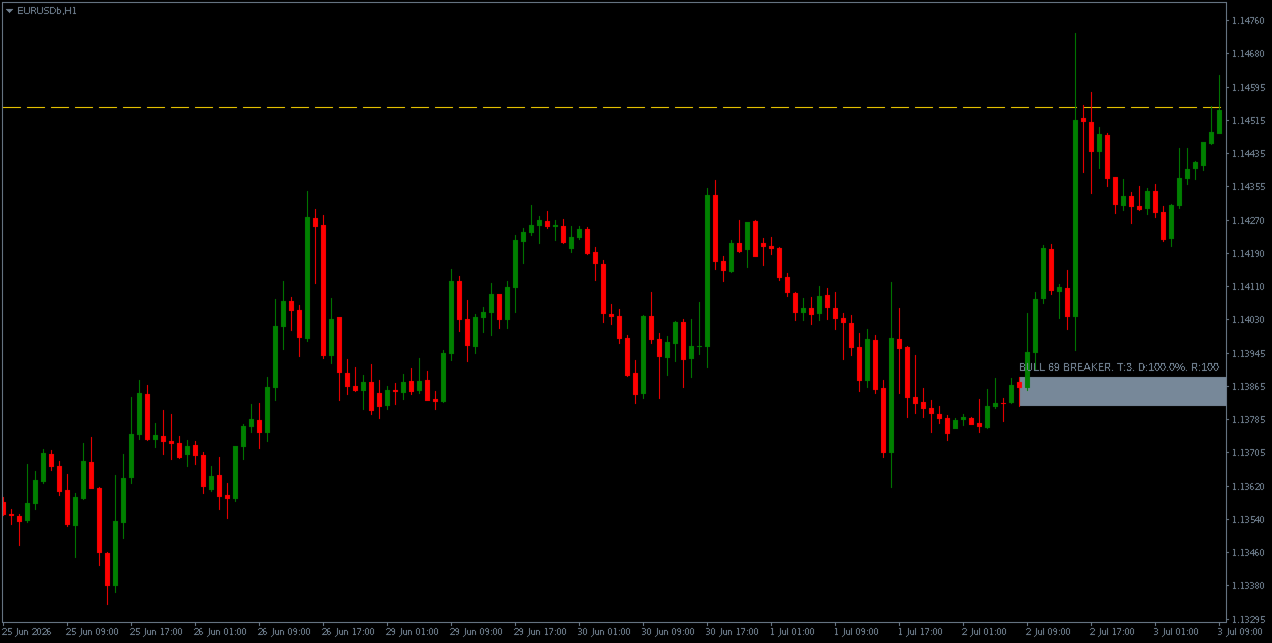
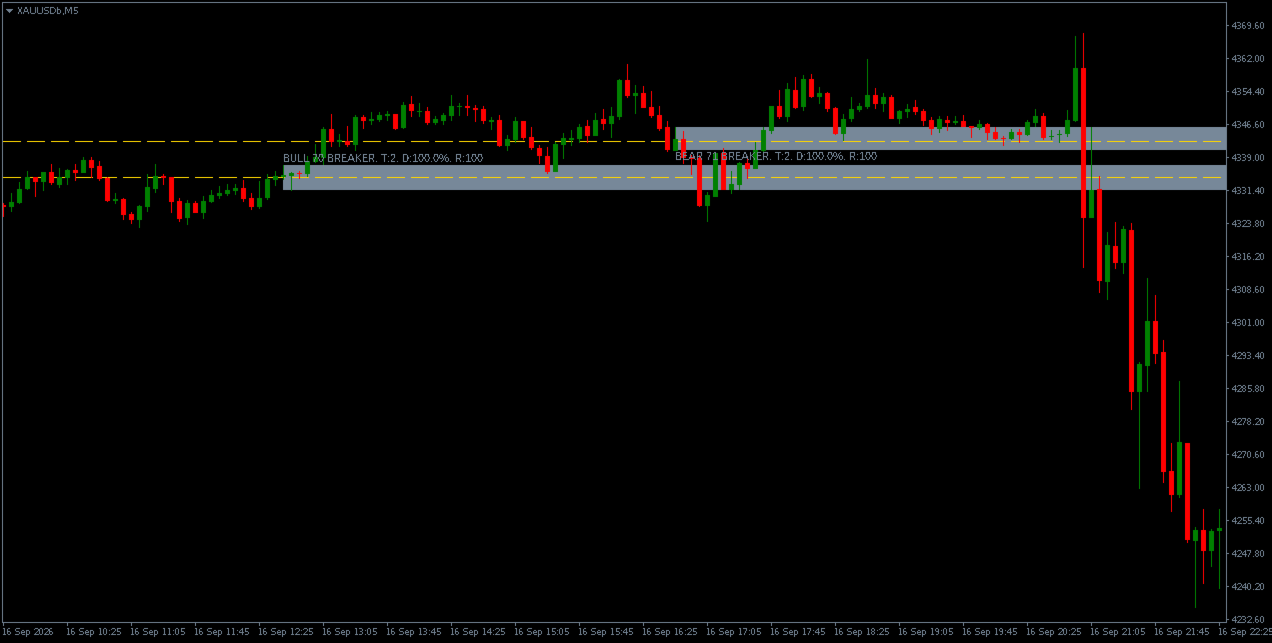
BREAKER
Price has closed through the far side of the zone in the opposite direction.
The zone is considered invalidated.
Breakers are drawn in a distinct colour and are capped at the break bar rather than extending forward.
They:
• Do not project targets
• Do not participate in same-type overlap checks
• Are not used as targets for other zones
• Are not automatically treated as an opposite-direction support or resistance level
Once a zone reaches VALID, it stays VALID until price closes through the far side of the zone and the state becomes BREAKER.
A wick or partial overlap back into a VALID zone updates the touch count and penetration percentage for descriptive purposes, but does not demote the zone to TESTED or reset the reaction score.
If a zone remains in REACTING for more than InpReactionTimeoutBars bars after the last touch without a decisive close beyond the zone boundary, it reverts to TESTED.
A zone already in TESTED is unaffected.
TARGET PROJECTION
For each displayed zone, if InpShowTargets is enabled, the indicator identifies a next logical target in the direction of the expected move.
The target is selected as follows:
1. Nearest opposite-type zone
The nearest opposite-type zone whose nearest edge lies ahead of the current zone is used.
For a bullish zone, this is the low of the nearest bearish zone above.
For a bearish zone, this is the high of the nearest bullish zone below.
2. Nearest unbroken swing
If no opposite zone exists, the nearest unbroken swing high for bullish zones or swing low for bearish zones is used.
A swing is considered broken if any close after the swing has exceeded its level.
The target is drawn as a horizontal line with user-configurable colour, width, and style.
If InpAlertOnTargetHit is enabled, an alert fires the first time the closing price of the last completed bar reaches the target.
Breaker zones do not project targets.
FILTERS
Session Filter
When enabled, zones whose break-of-structure bar falls outside the configured server-time hours are not created.
Higher-Timeframe Alignment
When enabled, zones must satisfy the EMA alignment condition described in the scoring section.
The filter has no effect if the selected higher timeframe is not above the chart timeframe.
Reaction Timeout
As described in the lifecycle section.
Overlap Management
Zones whose range overlaps an existing same-type zone by more than 50 percent are rejected.
ALERTS
Optional alerts are provided for four events:
• New qualifying zone created
• Zone touched for the first time
• Zone state transitions to VALID — reaction confirmed
• Zone state transitions to BREAKER — invalidated
• Optional: target level reached
Each event type is controlled by its own input.
Three notification channels are supported:
• Popup alert with sound
• Push notification
• Email
Alerts fire only on live bar events.
Historical replay during initial load does not produce alerts.
Any target that is already behind current price when the indicator is first attached does not fire a retrospective alert.
INPUT PARAMETERS
Swing Detection
• Internal swing length
• External swing length
• Maximum bars after swing to search for the break of structure
• Maximum candles in the origin base
Zone Validity
• Minimum zone range as ATR multiple
• Minimum break-of-structure body as ATR multiple
Scoring
• Minimum score to display
• Six component weights
• Displacement gate threshold
• Compression discount multiplier
• Maximum opposite candle body-to-range ratio for origin core
Liquidity Sweep
• Maximum bars before the break of structure to search for the sweep
Filters
• Session filter ON/OFF
• Session start and end hours
• HTF alignment ON/OFF
• HTF timeframe
• HTF EMA period
Targets
• Show targets ON/OFF
• Target line colour
• Width
• Style
Overlap
• Maximum number of zones tracked — default 80
Display
• Bullish zone colour
• Bearish zone colour
• Breaker colour
• Show zone labels ON/OFF
Alerts
• Master switch
• Per-event switches
• Popup/sound/push/email channels
• Sound file
• Message prefix
LIMITATIONS
This indicator is a visual analysis aid.
It:
• Does not generate buy or sell signals
• Does not place orders
• Does not manage positions
• Does not analyse volume
• Does not analyse order flow
• Does not analyse market profile
• Does not use any data outside OHLC prices and ATR
Order block detection depends entirely on the input thresholds and swing length settings, and different settings will produce different zones.
The quality score is a heuristic and should not be treated as a statistical probability.
The lifecycle states are descriptive classifications of how price has interacted with a zone, not predictions of future behaviour.
The target projection identifies the nearest structural level in the direction of the expected move; it does not predict that price will reach it.
Past chart patterns and past zone behaviour are not indicative of future price movement.