Multi Session VWAP with Deviation Bands

Multi Session VWAP with Deviation Bands

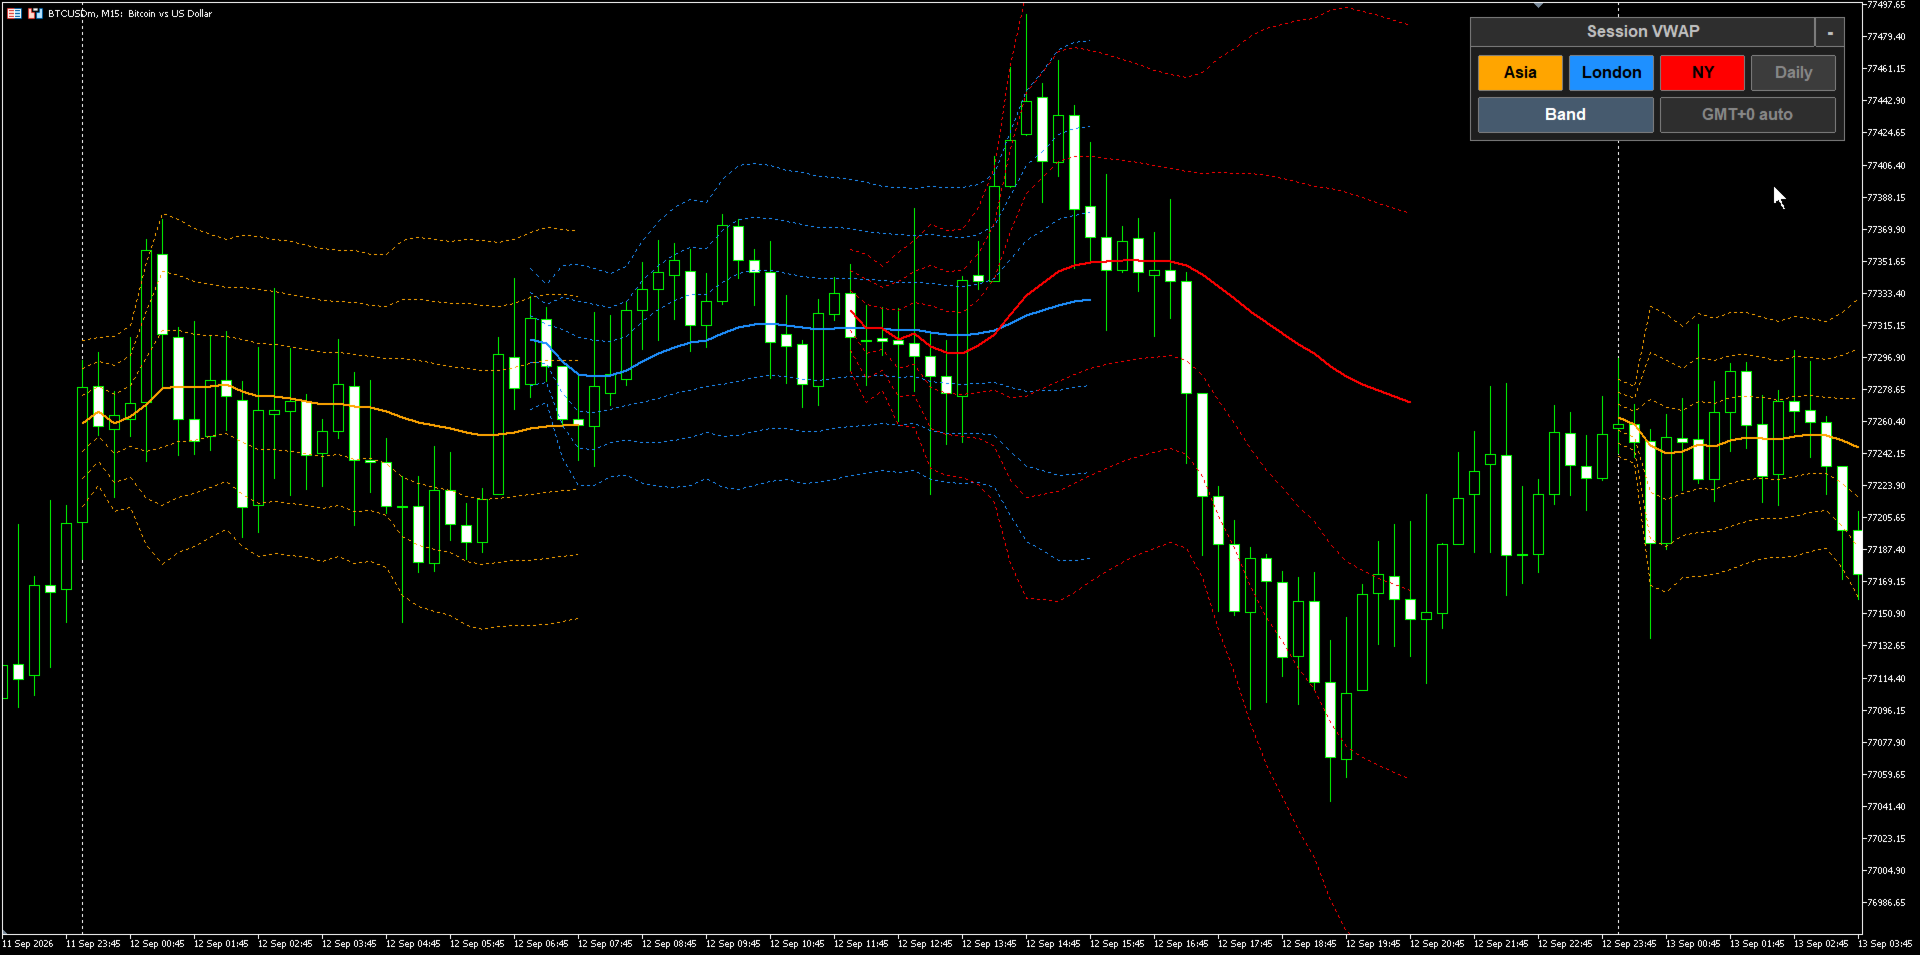
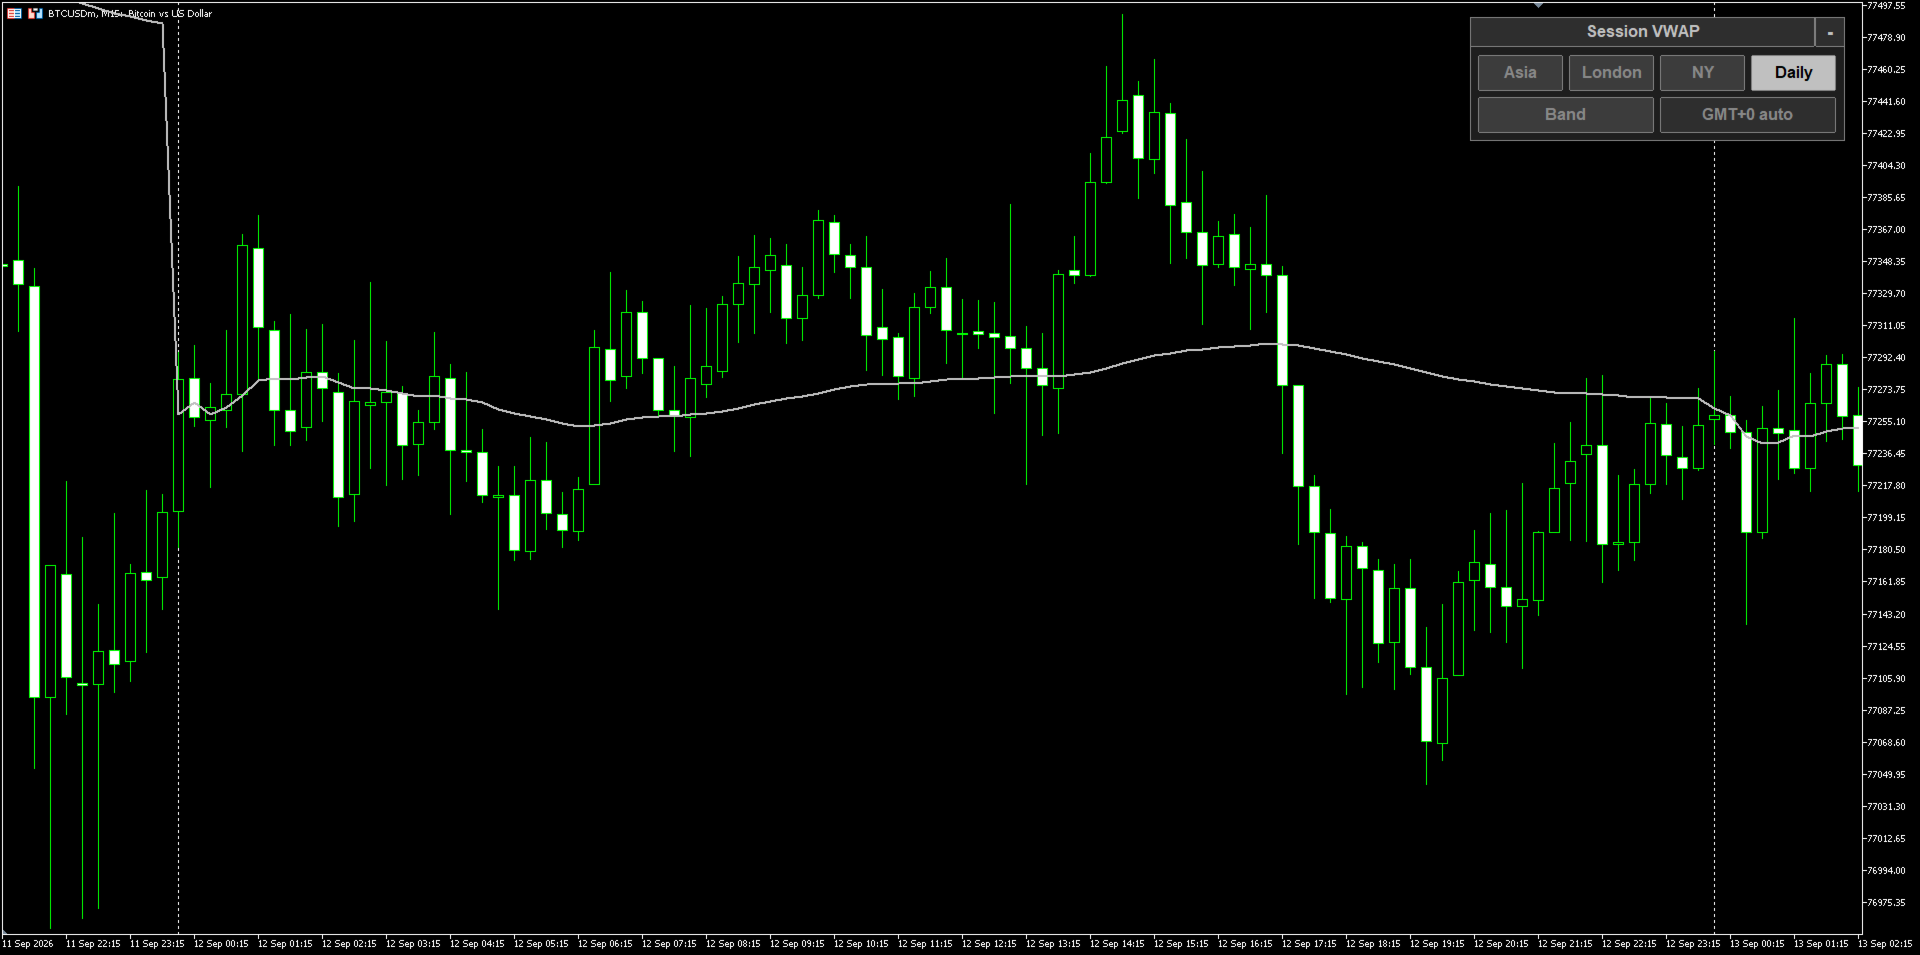
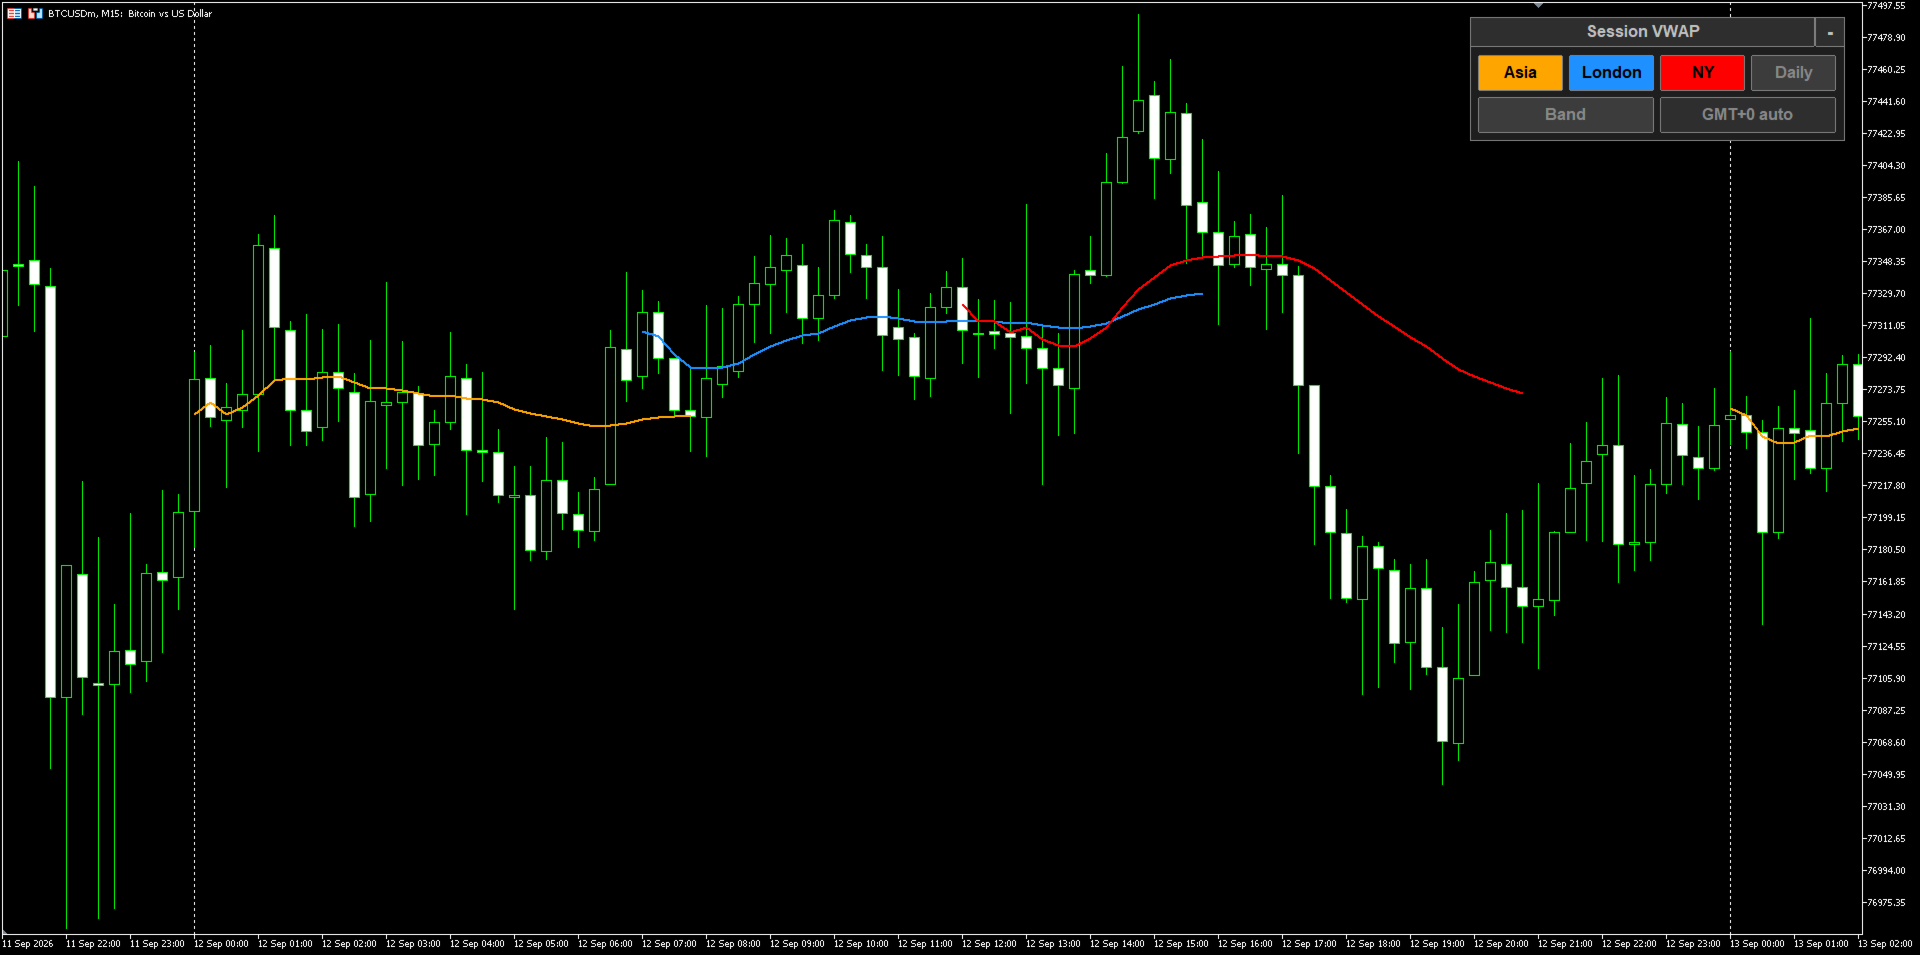
Four volume weighted average price lines in one indicator, each anchored to a different point in the trading day: the Asian session, the London session, the New York session and the daily open. Every anchor can be shown or hidden with one click on the chart, and each one carries its own set of standard deviation bands.

Session times are defined in UTC, not in broker time

Sessions are entered as UTC hours, and the indicator works out the broker server offset on its own by comparing server time with GMT. The detected offset is shown on the control panel, for example GMT+3 auto, and one click re-checks it. If a server reports an unusual time, the offset can be entered by hand instead. This means the same settings give the same session boundaries on every broker, without editing the hours for each server.

Key Features

  • Four anchors in one indicator: Asia, London, New York and Daily, shown together or one at a time.
  • Small control panel on the chart with one button per anchor plus a Band button - switch any line on or off without opening the settings.
  • The panel can be dragged anywhere, minimized to a small bar, and its position and button states are kept when you switch timeframe.
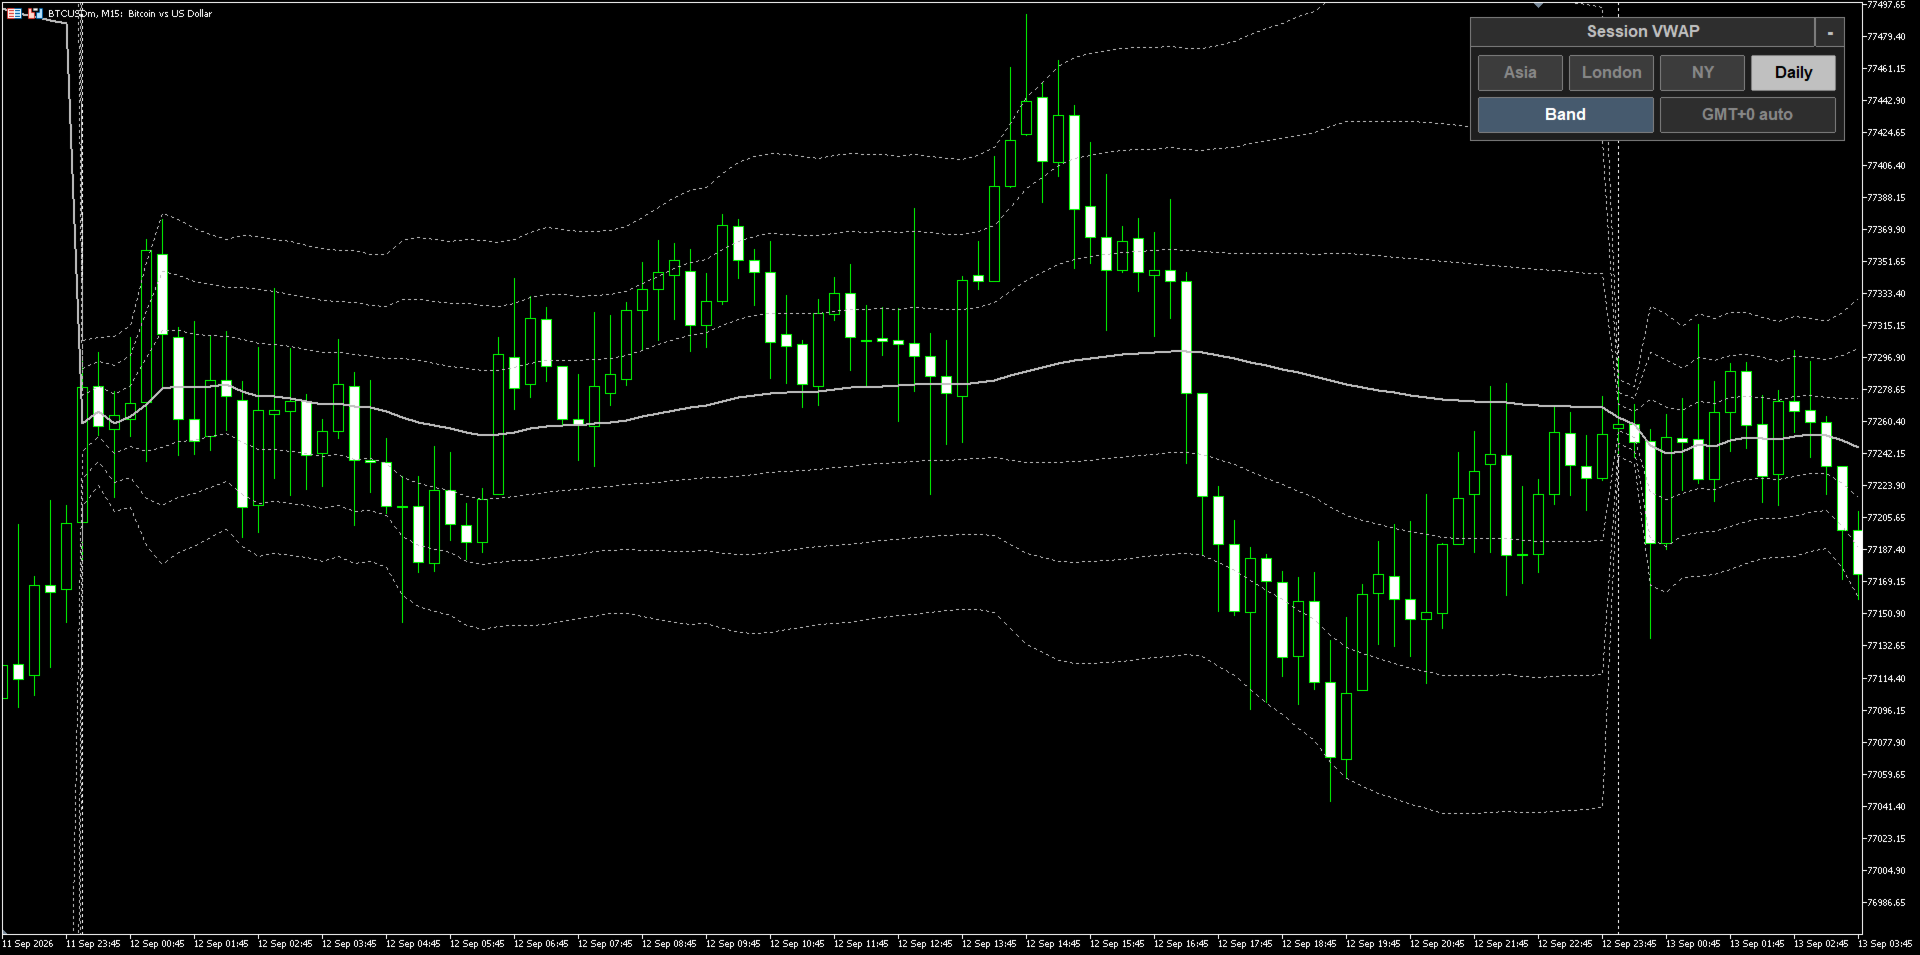
  • Standard deviation bands, up to three per side, with an adjustable multiplier for each level.
  • Session hours are set in UTC and the broker offset is detected automatically, with a manual override for unusual servers.
  • Sessions that run across midnight are handled, so the Asian session can be defined however your plan requires.
  • The VWAP is computed on a lower timeframe of your choice (one minute by default) and mapped onto the chart bars, so the value stays close to the true session average even on a higher chart timeframe.
  • The line for the session in progress updates on every tick, not only when a new bar opens.
  • Past sessions can be shown for a chosen number of days back, for reviewing how price behaved around earlier session VWAPs.
  • Weighting by tick volume or by real volume, whichever your symbol provides.
  • Every line appears in the Data Window with its own name, and a small tag marks each line on the chart.
  • Works on any symbol and any timeframe.

How It Works

For every bar of the calculation timeframe the indicator takes the typical price, that is the high plus the low plus the close divided by three, and weights it by the volume of that bar. Inside a session it keeps a running sum of price times volume and a running sum of volume; the VWAP at any point is the first sum divided by the second, so the line is the average price actually traded since the anchor rather than a simple moving average. The deviation bands come from the volume weighted variance of the same prices, so they open wide right after the anchor, when only a few bars have been counted, and tighten as the session fills out. Each anchor keeps its own running sums and resets when its session starts again, and the daily anchor resets once a day at the hour you choose.

Input Parameters

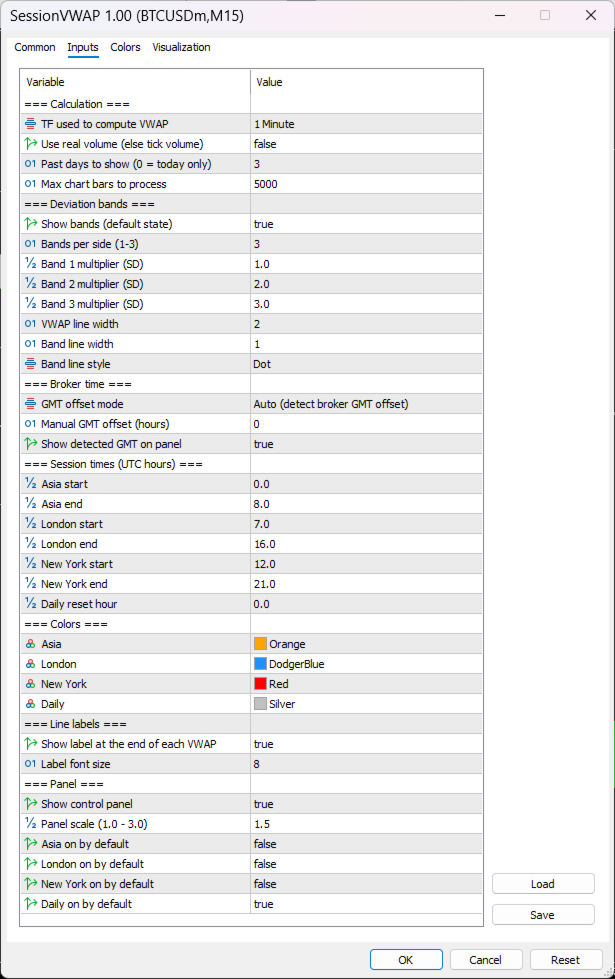
Calculation

  • TF used to compute VWAP - the lower timeframe the sums are built from, one minute by default. A timeframe above the chart timeframe falls back to the chart timeframe.
  • Use real volume - weight by real volume instead of tick volume.
  • Past days to show - how many earlier days of session lines to draw. Zero draws today only.
  • Max chart bars to process - upper limit on the number of chart bars scanned.

Deviation bands

  • Show bands - the state the Band button starts in.
  • Bands per side - one, two or three levels above and below the VWAP.
  • Band 1 / 2 / 3 multiplier - how many standard deviations each level sits at.
  • VWAP line width, Band line width and Band line style.

Broker time

  • GMT offset mode - detect the broker offset automatically, or set it by hand.
  • Manual GMT offset - the offset in hours used in manual mode.
  • Show detected GMT on panel - show the offset button on the control panel.

Session times, in UTC hours

  • Asia start / end - zero to eight by default.
  • London start / end - seven to sixteen by default.
  • New York start / end - twelve to twenty one by default.
  • Daily reset hour - the hour the daily anchor starts again, midnight UTC by default.

Colours

  • One colour per anchor - Asia, London, New York and Daily. The bands follow the colour of their own session and are drawn thinner and dotted.

Line labels

  • Show label at the end of each VWAP and Label font size.

Panel

  • Show control panel and Panel scale for high resolution screens.
  • Asia / London / New York / Daily on by default - which anchors are active when the indicator is first attached.

Notes

  • The automatic offset is read from the terminal clock. In the Strategy Tester that clock is less reliable than on a live chart, so use the manual mode there if the session boundaries look shifted.
  • This is a visual analysis tool. It does not send trading signals and does not open orders.
Recommended products
VWAP Regime AI – Intelligent Market Regime & Adaptive VWAP Indicator Advanced VWAP Analysis with AI-Based Volatility Clustering, Adaptive Deviation Bands and Automated Trading Signals. Overview VWAP Regime AI is an advanced technical indicator for MetaTrader 5 designed to analyze market conditions using Volume Weighted Average Price (VWAP), adaptive standard deviation bands and AI-inspired volatility clustering. The indicator uses a K-Means clustering algorithm to classify market volatility into
RSIScalperPro
PATRICK WENNING
Introducing RSIScalperPro - the revolutionary RSI-based indicator for Metatrader 5, specifically designed for scalping in the one-minute chart. With RSIScalperPro, you'll have a powerful toolkit for precise entry and exit signals to take your trading to the next level. RSIScalperPro utilizes two different RSI indicators that provide clear signals for overbought and oversold areas. You can customize the time periods and limit values of the two RSIs according to your preferences to achieve the be
The  OBV MTF  is an Enterprise-grade On-Balance Volume indicator that transforms standard OBV into a complete trading system. It combines gradient-aware momentum analysis, divergence detection, multi-timeframe alignment, and dynamic customisable midpoint-filtering in a single intuitive professional volume analysis tool. Core Features 1. 5-State Momentum Engine Aqua (Strong Bullish) : OBV slope rising with positive acceleration SteelBlue (Weak Bullish) : OBV rising but losing momentum Gray (Neutr
StructureLens - Smart Money Concepts for MT5: Market Structure, Order Blocks, Fair Value Gaps, Liquidity StructureLens draws the market structure the way Smart Money traders read it, on any symbol and timeframe. Everything is calculated on closed candles: once a label is drawn it never changes. Market structure - Swing points HH, HL, LH and LL. A swing is confirmed only after "Swing length" candles on each side (default 10), so it never repaints. - BOS (break of structure, solid line) when pr
Vwap Bands Auto
Ricardo Almeida Branco
The Vwap Bands Auto indicator seeks to automatically map the maximum market frequency ( automatic update of the outermost band ) and has two intermediate bands that also adjust to daily volatility. Another tool from White Trader that combines price and volume, in addition to mapping the daily amplitude. The external band is updated automatically when the daily maximum or minimum breaks the current frequency, and can be an input signal, seeking a return to the daily vwap. Thus, in addition t
Contraction Expansion Meter A clear and powerful volatility indicator that visualizes market contraction and expansion in real time. Based on Bollinger Bands logic, the indicator measures the relative width of the bands and compares it to its own moving average. This creates a highly intuitive oscillator that shows when the market is compressing (contraction / squeeze) or expanding (volatility breakout). What you see on the chart: Histogram Blue bars → Expansion (volatility is increasing) Red ba
SMC Vision
Kriangkrai Pongtiwat
SMC ProVision 2.0 — Professional Smart Money Concept Analysis Stop guessing. Start reading the market like institutions do. SMC ProVision maps the full smart money footprint directly on your chart — with a clean, minimal design that won't clutter your screen. Market Structure — BOS / CHoCH with HH・HL・LH・LL labels Order Blocks — Standard & Refined with mitigation tracking Breaker Blocks — Auto-converted from mitigated OBs Fair Value Gaps — Fill percentage & mitigation status Liquidity —
FREE
CorrelationRadarPRO
Gabriel Balbino De Oliveira
Correlation Radar PRO — Multi-Asset Correlation Dashboard for MetaTrader 5 Short Description: Eliminate market noise and spot price divergences in seconds. Correlation Radar PRO calculates historical, monthly, weekly, and real-time correlations across multiple assets and lets you overlay candles directly on your chart without switching your main symbol. Full Description: Manually switching charts to understand inter-market relationships wastes precious time and leads to missed setups. Correlatio
Anchored VWAP Trading Indicator Struggling to identify true market value and key support/resistance levels? The Anchored VWAP Trading Indicator helps you track price based on real traded volume, giving you a clear edge in your trading decisions. This tool allows you to anchor VWAP from any point on the chart, making it ideal for analyzing trends, reversals, and institutional activity. Key Features Anchored VWAP from any candle Accurate volume-weighted price calculation Works on all symbol
Market Structure Evaluator MTF Market Structure Evaluator MTF is an institutional-grade price action indicator designed for Smart Money Concepts (SMC) and Market Structure traders. It automatically tracks Market Structure Breaks ( BOS ) and Change of Character ( CHOCH ) in real-time across multiple timeframes, giving you a complete macro-to-micro view of market trend alignment without cluttering your charts or having to analyse other timeframes. Whether you trade manually or build automated tr
Volume Absorption Exhaustion Decay MT5 Volume Absorption Exhaustion Decay MT5 is a technical indicator designed to analyze how effectively price responds to market activity. Instead of relying on volume spikes alone, the indicator examines changes in directional price movement relative to historical volume activity. Its purpose is to identify potential absorption, exhaustion, and subsequent market reactions. How It Works The indicator compares recent and previous price movement efficiency using
ShortBS是一个很好的短线交易指示器,能很好与 BestPointOfInitiation ( https://www.mql5.com/zh/market/product/96671 )配合,能让你找到最合适的buy和sell位置,指标不含有未来函数,不会重新绘制。是一个针对(如果你感觉到这个指标能够帮助你进行更准确的交易,请帮忙给个好评,希望我的作品能够帮助更多有需要的人) ===================参数列表===================== maPeriod: 25 slowPeriod:20 fastPeriod:10 stepPeriod:5 =================参考使用方法=================== 此指标可以适用于任何交易品种,能够用在任何周期。
Orderflow Footprint
Panthita Aichoi
4 (1)
Asa Orderflow Footprint v3 — Product Description Overview Asa Orderflow Footprint is a professional-grade footprint chart indicator for MetaTrader 5 that renders real-time Bid/Ask volume (or tick count) at every price level inside each candle. Built for serious order flow traders, it goes far beyond a basic footprint by adding POC migration analysis, a one-glance order-flow dashboard, stacked imbalance detection, absorption flags, and naked Point of Control (POC) lines — all inside the main ch
TPO Dashboard
Hendra Pri Raditya
TPO Market Profile Levels — Plug & Play by HENDRA PRI RADITYA An on-chart Market Profile (TPO) analysis tool that highlights the most relevant price levels of the current Daily, Weekly and Monthly periods, together with a compact dashboard summarising the current market structure. WHAT IT SHOWS - POC (Point of Control) for the Daily, Weekly and Monthly period. - VAH and VAL (Value Area High / Low) for each period. - A naked POC marker, so a POC that has not yet been revisited stays visible. - Pe
Sidus Pro
Gabriel Balbino De Oliveira
Sidus Pro for MetaTrader 5: The Ultimate Evolution of the Classic Sidus Method Turn your trend analysis into a true statistical edge. Sidus Pro reinvents the renowned moving average crossover and volatility channel method, combining mechanical precision, visual automation, and macroeconomic intelligence into a single professional interface. Forget amateur indicators that repaint past data or generate blind noise in sideways markets. Sidus Pro is engineered under rigorous MQL5 standards to delive
DMJ Magical AVWAP
Dominic Minguy Jean
Automated Anchored Volume Weighted Average Price You set a period, and the indicator will find the highest and lowest price point in the period and derive a AVWAP from there. It also prints out a median line. You can use the generated VWAP lines as a channel, as S/R levels or as a volatility indicator. It's based on tick volume to be compatible with most CFD brokers. Happy trading!
Institutional Structure Pro is a MetaTrader 5 indicator focused on market structure, Order Blocks, Fair Value Gaps, and multi-timeframe confluence. Institutional Structure Pro was developed to help traders read market structure with greater clarity. The indicator works with institutional price action concepts such as BOS, CHoCH, Order Blocks, Fair Value Gaps, Premium and Discount zones, Equal Highs and Equal Lows, RSI divergence, HMA trend context, market sessions, and Volume Profile reference
ICT Institutional Zones Pro
Celestine Anyango Wabomba
ICT Institutional Zones Pro — Trade with Institutional Precision Stop wasting time manually drawing key ICT levels every day. ICT Institutional Zones Pro is a professional-grade MT5 indicator built for traders who use ICT (Inner Circle Trader) and Smart Money Concepts (SMC) to read market structure with precision. This indicator automatically maps the most important institutional levels directly on your chart, helping you instantly identify where smart money is likely accumulating, distributing
This Indicator adding power to traditional zigzag indicator. With High-Low numbers in vision it will be easier to estimate change of trend by knowing the depth of each wave. Information including points, pips, percentage%, and #bars can be displayed based on configuration. All information is real-time update. This indicator is especially useful in sideway market to buy low sell high.
Product Title:   IQ VWAP Oscillator Candles Full Version Stop Trading Blindly – Align with Institutional Volume and Momentum Right on Your Chart! Are you struggling to combine trend direction, momentum, and institutional volume into one single strategy? Most retail traders fail because they look at separate sub-window oscillators while ignoring where the "Big Boys" are actively placing their money. The   IQ VWAP Oscillator Candles   engine solves this problem permanently. It takes high-speed
KT Volatility Oscillator MT5
KEENBASE SOFTWARE SOLUTIONS
KT Volatility oscillator analyze the past and current market data with a mathematical formula to display the result in a form of an oscillator. The growing and deteriorating waves are equivalent to high and low volatility in the asset.  In a nutshell, volatility is simply a measurement of the price fluctuation of an asset over a certain period of time. Without volatility, there would not much movement in the market and traders would not be able to profit from the price movements. Use of Volatil
Phoenix Trend Strength Suite
PHOENIX GLOBAL INVESTMENTS LTD
Trends rarely move the same way on every timeframe. A bullish M15 chart can simply be a pullback inside a bearish H4 trend, and trading the shorter picture without checking the wider one is how good-looking entries turn into trades against the real trend. Phoenix Trend Strength Suite reads trend direction and quality across five timeframes at once and brings the result into a single dashboard, so you can see whether your timeframe actually agrees with the bigger picture before you take the trad
Mtf Rsi Fusion
Hadi Pourkerman
5 (1)
MTF RSI Fusion is a MetaTrader 5 oscillator that combines a base Relative Strength Index (RSI) with up to two optional RSI overlays. Each source has a configurable timeframe, period and applied price. The overlays have separate weights and combination modes. The display includes the Fusion RSI line, optional trend coloring and adaptive overbought and oversold zones based on Average True Range (ATR). Trend bias can use higher-timeframe candles, moving-average slope or both. Optional bullish and b
Trix TURBO
Anderson De Assis
3 Indicators Joining Forces! The Trix TURBO is an indicator from the oscillator family, customized for MetaTrader 5, that combines the Triple Exponential Moving Average (TRIX) oscillator with the Parabolic SAR (SAR) for dynamic coloring and a simple Moving Average (MA) for smoothing. This tool provides a visual representation of momentum and trend direction in a separate window. The TRIX line (or histogram) is colored based on the SAR position relative to the price: aqua for potential uptrends (
VWAP Indicator MT5
Kyra Nickaline Watson-gordon
Description : VWAP (Volume-Weighted Average Price) is the ratio of the value traded to total volume traded over a particular time horizon. It is a measure of the average price at which pair is traded over the trading horizon. Read More. All Symbols and All Timeframes are supported. Indicator Inputs :     VWAP Mode : Mode of VWAP Calculation. Options can be selected : Single,Session,Daily,Weekly,Monthly     Volumes : Real Volumes,Tick Volumes     Price Type : Used price for calculating. O
CRV Z-Score Engine is a professional market structure indicator that transforms raw price into normalized,  multi-horizon statistical structure model   It reveals: When price is statistically stretched When the market is transitioning between regimes When a move is structurally aligned across multiple horizons This is not a lagging oscillator . It is a multi-horizon statistical structure model built for serious traders. WHAT IS Z-SCORE? Z-Score measures how far price deviates from its n
The indicator helps to enter a trade following the trend, at the same time, after some correction. It finds strong trending movements of a currency pair on a given number of bars, and also finds correction levels to this trend. If the trend is strong enough, and the correction becomes equal to the one specified in the parameters, then the indicator signals this. You can set different correction values, 38, 50 and 62 (Fibonacci levels) are better. In addition, you can set the minimum trend lengt
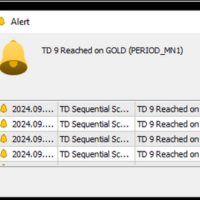
If you are unsure how to use this indicator, please feel free to reach out to me. I will explain it to you and provide reading materials to help you make the most of it. TD Sequential Scanner: An Overview The TD Sequential scanner is a powerful technical analysis tool designed to identify potential price exhaustion points and trend reversals in financial markets. Developed by Tom DeMark, this method is widely used by traders to gauge market cycles and potential turning points with precision. Ho
MFOP Market Forecast
Oscar Josue Pin Bacuzoy
Develop this indicator for periods of 30 minutes or more, focus on getting market trends right and making sure they are met. MFOP v8.1 gets straight to the point: it scans the market and tells you exactly when there is enough strength to enter a trade. This indicator doesn't do magic, it uses mathematical algorithms to filter out market noise, not enter into false breakouts and show you clear BUY (blue arrow) and SELL (red arrow) opportunities. It is designed and optimized specifically to take
Buyers of this product also purchase
Trend Sniper X
Sarvarbek Abduvoxobov
4.86 (44)
Trend Sniper X is a multi-timeframe trend-following indicator for MetaTrader 5 that helps traders identify trend direction and potential reversal points with clarity and precision. for MT4: https://www.mql5.com/en/market/product/193245 Price Information: The current price is promotional and is subject to change as upcoming updates and new features are released. Bonus Offer: To get the FREE Auto-Trade Assistant EA for this indicator, please message the author after purchasing. Code2Profit Channe
A new King in town - Indicator + Order management indications(tp1+tp2+tp3) + Optional Telegram Signal sender   INCLUDED (FREE) + Bonus EA Robot ( FULL TRADING  and SIGNAL SYSTEM ) Our best EA for Gold: Gold Slayer TRY > Reversion Queen  Expert advisor >JOIN Community Channel < NEW Free Automation EA link < click here ( disclaimer: this is new and still on testing and phase , use at your risk on demo) Free Telegram Bridge < click here  This indicator includes an advanced Strategy, a trading sys
Smart Trend Trading System — MetaTrader 5 Message me on MQL5 after purchase to receive Smart Universal Expert Advisor for FREE, plus the online course, PDF manual, and private group access. STTS brings trend direction, entry and exit signals, reversal zones, and important price levels together on your chart. Follow the system manually, or connect a separate compatible EA for automated execution using your chosen settings. ONE SYSTEM. FOUR TRADING APPROACHES. STTS organizes its trading approaches
Entry Points Pro shows you where to enter, where to put the stop and what lot to trade — before you place the order. PRICE Now 199 USD: 8 copies at this price, then 249 USD. The final price is 349 USD. I make my money trading the markets, and I show it, so I don't need to sell this indicator to everyone. It is a tool for traders who think for themselves, not a magic button. No breakout, no trade. A gray arrow is a cancelled signal: price did not break the signal candle, so there was no entry
M5 Sniper
MeanFX
5 (4)
Get your trading edge in the line of sight M5 Sniper   is a new indicator by MeanFX. It combines   precise trading signals   with   adaptive TP/SL levels   - creating best possible statistical trades as a result! The price increases every 5 purchases, the next price is 79$ Message me after purchase to receive tips/guide and bonus EA plus trading methodology Auto Optimisation only works on LIVE chart , needs data feed >JOIN Community Channel < What makes it stand out?   Proven statistical per
Ultra Indicator
Ihor Otkydach
5 (1)
ULTRA is a technical indicator that operates on an “all-in-one” basis—it independently analyzes the market, generates trading signals, displays levels for setting stop-loss orders, and suggests when to close trades to lock in profits or minimize losses. In other words, it doesn't matter if you don't know how to analyze the market, determine levels—where to set your stop-loss—or struggle with money management. ULTRA will do all of that for you! BUYER BONUS: After purchasing the ULTRA indicator, s
Gann Made Easy   is a professional and easy to use Forex trading system which is based on the best principles of trading using the theory of W.D. Gann. The indicator provides accurate BUY and SELL signals including Stop Loss and Take Profit levels. You can trade even on the go using PUSH notifications. PLEASE CONTACT ME AFTER PURCHASE TO GET TRADING  INSTRUCTIONS   AND GREAT EXTRA INDICATORS  FOR FREE! Probably you already heard about the Gann trading methods before. Usually the Gann theory is a
SuperScalp Pro
Van Minh Nguyen
4.54 (37)
SuperScalp Pro - Professional Multi-Layer Confluence Scalping System SuperScalp Pro is an advanced scalping indicator that upgrades the classic Supertrend with multiple intelligent confirmation filters. It helps you identify higher-probability Buy/Sell opportunities while significantly reducing false signals. Clear Buy and Sell arrows appear directly on the chart, along with automatic ATR-based Stop Loss and Take Profit levels calculated in real time. After purchase, please message me on MQL5 to
SMC Intraday Formula
VividMind Digital Solutions
5 (26)
Secure the Lowest Price Today. After purchase, contact via   MQL5 inbox   to receive your buyer kit and bonus. Let's be honest first. No indicator will make you profitable on its own. If someone tells you otherwise, they're selling you a dream. Every indicator that shows perfect buy/sell arrows can be made to look flawless — just zoom into the right window of history and screenshot the winners. We won't do that. SMC Intraday Formula is a tool. It reads the market structure for you, maps the hig
GoldenX Entry MT5
VividMind Digital Solutions
5 (17)
Price will increase by $20 every 10 buyers to maintain premium value. After purchase, contact via   MQL5 inbox   to receive your buyer kit and bonus. You have probably tested dozens of indicators before. But we are not here to be “just another signals indicator.” Behind GoldenX Entry is intensive research & development focused on building sophisticated algorithms designed to adapt to the real behavior of every instrument — not generic signals recycled everywhere else. From advanced Auto Optim
Gold Trend Coach MT5
Cristhian Alexander Gaibor Cuasquer
4.27 (11)
Non-repainting buy and sell signals for gold (XAUUSD) on MetaTrader 5. Every signal comes with a stop loss and three take profits. A Smart Money Concepts filter with BOS and CHoCH, so you trade with the structure, not against it. A live Mentor on your panel that guides every step from the entry to TP3. And alerts straight to your phone and your own Telegram channel. That is Gold Trend Coach. Never trade alone again. FREE BUYER KIT with your purchase: 1. Telegram Alert Bridge: your signals go to
Boba Analysis Suite
Trade Ready Solutions LLC
5 (2)
Boba Analysis Suite Boba Analysis Suite is an analytical indicator for MetaTrader 5. It brings market structure, relevant price zones and broader market context together in a single chart view. Developed through practical experience as a trader and trading coach, it supports a structured analysis process: assessing market direction, identifying important levels and considering multiple timeframes together. Analysis in Context Individual signals gain meaning through context. Boba Analysis Suite h
FX Power MT5 NG
Daniel Stein
5 (33)
FX Power: Analyze Currency Strength for Smarter Trading Decisions Overview FX Power is your go-to tool for understanding the real strength of currencies and Gold in any market condition. By identifying strong currencies to buy and weak ones to sell, FX Power simplifies trading decisions and uncovers high-probability opportunities. Whether you’re looking to follow trends or anticipate reversals using extreme delta values, this tool adapts seamlessly to your trading style. Don’t just trade—trade
Azimuth Pro
Ottaviano De Cicco
5 (7)
Azimuth Pro V2: Synthetic Fractal Structure and Confirmed Entries for MT5 Overview Azimuth Pro is a multi-level swing structure indicator by Merkava Labs . Four nested swing layers, swing-anchored VWAP, ABC pattern detection, three-timeframe structural filtering, and closed-bar confirmed entries — one chart, one workflow from micro-swings to macro-cycles. This is not a blind signal product. It is a structure-first workflow for traders who care about location, context, and timing. 1. What Change
FiboSniper Pro
Van Minh Nguyen
5 (4)
FiboSniper Pro - Multi-Filter Fibonacci System with Auto SL/TP and Control Panel FiboSniper Pro is a technical indicator that combines dynamic Fibonacci Envelopes with multiple confirmation filters to generate selective Buy and Sell signals. Fibonacci levels are calculated from Moving Average and ATR, then filtered by ADX, EMA, RSI, ATR, Volume, Time and Candle structure. The indicator displays automatic ATR-based Stop Loss and Take Profit levels directly on the chart, along with an interactive
M1 Sniper MT5
Oleg Rodin
5 (7)
M1 SNIPER  is an easy to use trading indicator system. It is an arrow indicator which is designed for M1 time frame. The indicator can be used as a standalone system for scalping on M1 time frame and it can be used as a part of your existing trading system. Though this trading system was designed specifically for short-term trading, it still can be helpful for all traders. This trading system can be used with any forex pair and time frame, though lower time frames are recommended from M1 up to M
Apex Patterns PRO Buy Indicator - Get Expert Advisor Based on it for FREE. Self-Optimizing Chart Pattern & Breakout Intelligence Traditional pattern scanners rely on fixed inputs, often underperforming when market volatility and structures shift. Apex Patterns PRO is designed to adapt to changing market conditions by combining structural chart pattern recognition, momentum filtering, and statistical self-optimization into one analytical framework. Adaptive Scanning Engine Self-Optimizing Patter
SQN Max indicator for MT5 by ITC
Renaud Herve Francois Candel
Sqn Max Indicator Sqn Max is an exclusive indicator to trade the market with high effectiveness. The indicator is based on price action, volatility and trend. This indicator is as simple as possible but not too simple. The indicator can generate alerts to ease the trading process. You don't have to stay all day in front of your screen. The indicator can be used with any class of assets and with any time frame. It is possible to achieve better results trading our list of selected assets. We achi
Adaptive Price Action Engine Buy Indicator- Get EA Based on it for FREE. Self-Optimizing Multi-Timeframe Trend & Candlestick Intelligence Markets do not behave the same way all the time—and not every price-action pattern has the same value in every market regime. Adaptive Price Action Engine is designed to adapt to changing market conditions by combining trend structure, multi-timeframe analysis, candlestick patterns, and statistical optimization into one analytical framework. Two Adaptive Mode
Welcome to Entry In The Zone & SMC Multi Timeframe —  COMPLETE SMC ANALYSIS SYSTEM — ALL IN ONE INDICATOR Entry In The Zone & SMC Multi Timeframe  An indicator designed for market analysis based on Smart Money Concepts (SMC), displaying Market Structure, Key Zones (Order Blocks, Supply & Demand Zones, and Fair Value Gaps), Liquidity, and real-time BUY / SELL signals. It supports both Single-Timeframe and Multi-Timeframe analysis, along with the Confluence at Zone feature, which helps you evaluat
Divergence Bomber
Ihor Otkydach
4.89 (94)
Each buyer of this indicator also receives the following for free: The custom utility "Bomber Utility", which automatically manages every trade, sets Stop Loss and Take Profit levels, and closes trades according to the rules of this strategy Set files for configuring the indicator for various assets Set files for configuring Bomber Utility in the following modes: "Minimum Risk", "Balanced Risk", and "Wait-and-See Strategy" A step-by-step video manual to help you quickly install, configure, and
Tokyo mt5 Indicator
Vasiliy Strukov
5 (15)
Tokyo Indicator provides a clear visual overview of trend direction, potential trading signals, and market conditions. Its colour-coded, stepped trend line distinguishes bullish phases in blue from bearish phases in magenta. Matching directional arrows highlight potential buying and selling opportunities when the displayed trend changes. An integrated dashboard brings together the current signal, market bias, momentum, volatility, and signal quality in one convenient view. This allows traders t
Power Candles MT5
Daniel Stein
4.58 (12)
Power Candles - Self-Optimizing Strength Indicator Strength usually lives in a sub-window. The line runs below, the candle above, and your eye keeps connecting the two. Power Candles puts the strength into the candle itself, colored from dark red to dark green, so the chart reads at a glance and the sub-window stays closed. The indicator also finds its own settings for the symbol and timeframe in front of you. One click on [ Apply Best ] draws entry, Stop Loss and Take Profit at the exact prices
Currency Strength Wizard   is a very powerful indicator that provides you with all-in-one solution for successful trading. The indicator calculates the power of this or that forex pair using the data of all currencies on multiple time frames. This data is represented in a form of easy to use currency index and currency power lines which you can use to see the power of this or that currency. All you need is attach the indicator to the chart you want to trade and the indicator will show you real s
Naked Forex Tweezer Pro Indicator Tweezer Pro Indicator is a pattern recognition indicator for Forex, Stocks, Indices, Futures, Commodities and Cryptos. The standard Tweezer is a two bar pattern. Our enhanced version is a multi-bar pattern. We filter the patterns for you so that you only get the     best and most effective patterns   and ignore the noise. The Tweezer pattern is a simple and effective pattern to trade. The strategy that comes with the Tweezer is based on price action. The Twe
Auto Optimized SpeedAngle is an institutional-grade momentum vectoring system that eliminates curve-fitting through continuous Walk-Forward Optimization (WFO). Rather than relying on static inputs that degrade when market regimes shift, the indicator dynamically recalibrates its parameters using Out-of-Sample (OOS) validation, ensuring the displayed signals represent genuine statistical edges rather than historical anomalies. By shifting the focus from subjective visual angles to normalized, qua
Smc Pro ToolKit
Talal N Z Aljarusha
5 (13)
SMC PRO TOOLKIT — SMART MONEY ANALYSIS & STRUCTURED TRADE PLANNING SMC Pro ToolKit is a professional Smart Money Concepts analysis workspace for MetaTrader 5. It combines market structure, multi-timeframe analysis, institutional price zones, setup evaluation, confirmation tools, volume context, alerts, and risk planning inside one organized chart environment. One workspace. Multiple layers of confirmation. One structured trading plan. OPEN COMPLETE USER GUIDE MULTI-CONDITION SETUP ENGINE At
Multi Currency Strength and Momentum Indicator MT5 Dynamic Forex28 Navigator is the evolution of our long-time, popular indicators, combining the power of five in one: Advanced Currency Strength28 Indicator (700 reviews) Advanced Currency IMPULSE with ALERT (530 reviews) Currency Strength EXOTICS GOLD Impulse with Alert CS28 Combo Signals (recent Bonus) No need to buy four indicators and stack them on your charts. All of it is merged into one powerful indicator: the strength of the 28 Forex pair
ARICoins
Temirlan Kdyrkhan
ARICoin is a powerful trading companion designed to generate high-probability entry signals with dynamic TP/SL/DP levels based on volatility. Built-in performance tracking shows win/loss stats, PP1/PP2 hits, and success rates all updated live. Key Features: Buy/Sell signals with adaptive volatility bands Real-time TP/SL/DP levels based on ATR Built-in MA Filter with optional ATR/StdDev volatility Performance stats panel (Success, Profit/Loss, PP1/PP2) Alerts via popup, sound, push, or email Cust
Crystal Heikin Ashi Signals
Muhammad Jawad Shabir
5 (5)
Crystal Heikin Ashi Signals—Professional Trend & Signal Detection Indicator Advanced Heikin Ashi Visualization with Intelligent Signal System for Manual & Automated Trading Final Price: $149 ---------> Price goes up $10 after every 10 sales . Limited slots available — act fast . Overview User Guide PDF Crystal Heikin Ashi Signals is a professional-grade MetaTrader 5 indicator that combines pure Heikin Ashi candle visualization with an advanced momentum-shift detection system. Designed for both m
More from author
A fully automated double-side grid and hedge Expert Advisor for gold (XAUUSD) on MetaTrader 5. OVERVIEW Gold DoubleSide Grid EA trades both directions on the same symbol at the same time. It opens paired buy and sell positions, adds to the grid by Distance steps as price moves, scales lot size with a martingale multiplier, and aims to close each cycle in profit using a trailing profit lock. An automatic session filter learns the broker's daily market break from tick data, so the EA pauses around
Session Volume Profile (Daily) This indicator draws a daily Session Volume Profile directly on your chart. For each trading day it builds a horizontal volume histogram and marks the three key levels traders watch: the Point of Control (POC) , the Value Area High (VAH) and the Value Area Low (VAL) . The profile resets automatically at the start of every new day, and you can choose how many previous days to display alongside the current one. Key Features POC, VAH and VAL plotted and labelled for e
CustomRange VolumeProfile This indicator builds a Volume Profile for any part of the chart you want to study . Instead of resetting per day, you choose the range - either by dragging two vertical lines yourself, or by letting the indicator snap the range to a ZigZag swing leg automatically . It then draws the horizontal volume histogram together with the three key levels: the Point of Control (POC) , the Value Area High (VAH) and the Value Area Low (VAL) . Two Ways To Set The Range MANUAL - two
QuickTrade Panel
Sompop Jittrakul
QuickTrade - One-Click Trading Panel QuickTrade is a manual trading panel that places orders with a single click and sizes the lot automatically from a fixed money-per-trade amount. Instead of typing a lot size, you type how much money you want to put at risk, and QuickTrade calculates the correct lot from your chosen Stop Loss distance. Every order is sent with its Stop Loss and Take Profit already attached. Key Features One-click SELL / BUY - large buttons that also show the live Bid/Ask price
FVG Zones MTF This indicator detects Fair Value Gaps (FVG) and draws them as zones on your chart, from up to three timeframes at the same time - the chart timeframe plus two higher timeframes of your choice. Each timeframe set has its own colours and label, so you always know which timeframe a zone came from. Key Features Detects bullish and bearish FVG zones on the current timeframe plus two higher timeframes , all shown on one chart. Small control panel on the chart with one button per timefra
Triple MA Trend Alignment This indicator draws three moving averages on one chart and colours them by their alignment , so the state of the trend can be read at a glance instead of comparing the lines by eye. The default setup is EMA 9, EMA 34 and EMA 100, and every period, method, applied price, colour and line width can be changed. How The Colours Work The three lines are coloured by two independent rules. Fast and Mid always share one colour, decided by the fast line: above the mid line they
SMC Swing Structure and Fair Value Gaps Most market structure indicators draw every break and every gap they can find, and the chart ends up covered in lines from months ago. This one shows one swing at a time . You pick a swing with the arrows on the chart panel, and only that swing is drawn: its leg, the structure level it broke, and the fair value gaps created inside it. Key Features One swing at a time. The chart stays clean because nothing outside the selected swing is drawn. Step through s
Multi MA Ribbon Crossover and Pullback This indicator draws nine exponential moving averages as one ribbon on the price chart. Every line is coloured by its own slope, so the ribbon shows at a glance which part of the trend is still rising and which part has already turned. On top of the ribbon it marks two kinds of signals: a crossover of the fastest line with the main line, and a pullback to the main line inside an established trend. All signals are confirmed on closed bars only. How The Ribbo
QuickTrade Lines Risk Panel QuickTrade Lines Risk Panel is a manual trading panel that works with three lines on the chart: entry, stop loss and take profit. You drag the lines to the prices you want, and the panel reads their positions and works out the order by itself - buy or sell, limit or stop. The lot is calculated from the stop loss distance, either from the money you are willing to risk or from a fixed lot that you type in. Every order is sent with its stop loss and take profit already a
Filter:
No reviews
Reply to review