Multi Session VWAP with Deviation Bands
- Indicatori
-
Sompop Jittrakul
 Trader since 2007 and owner of www.ThailandTraderClub.com - www.ThailandTradingSchool.com - www.TradingStat.me
 - Versione: 1.0
- Attivazioni: 20
Multi Session VWAP with Deviation Bands
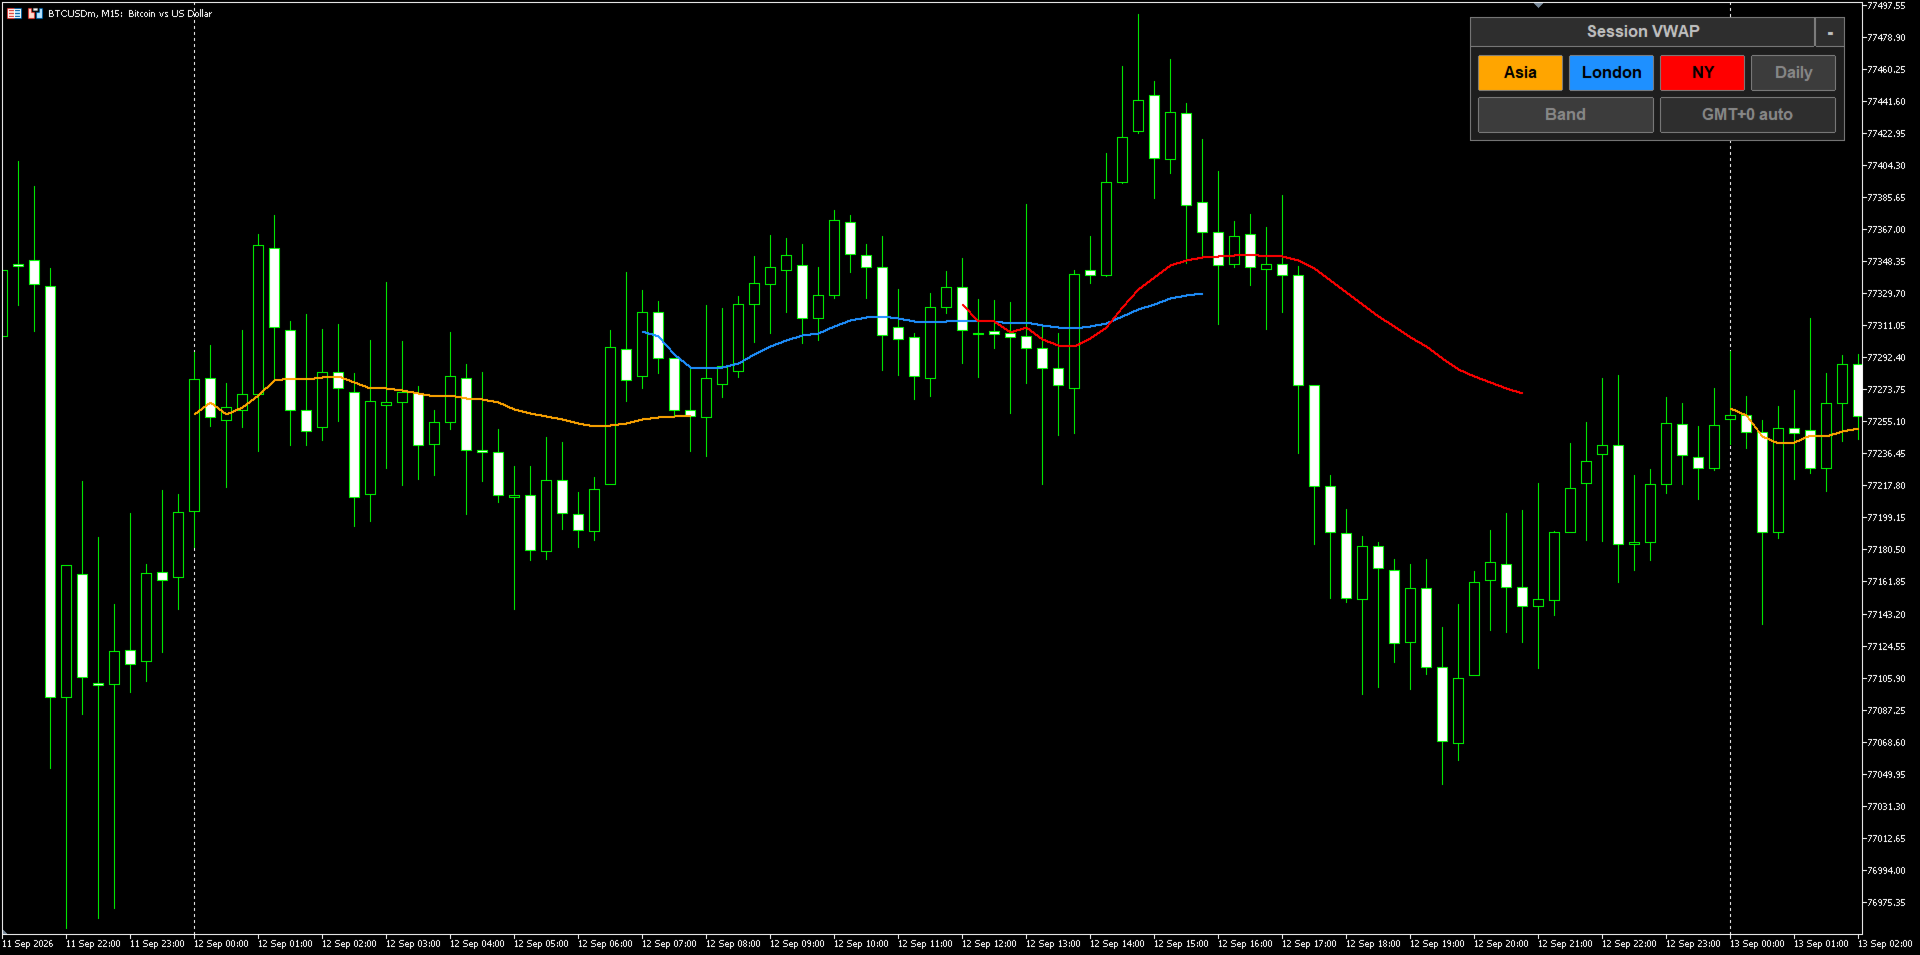
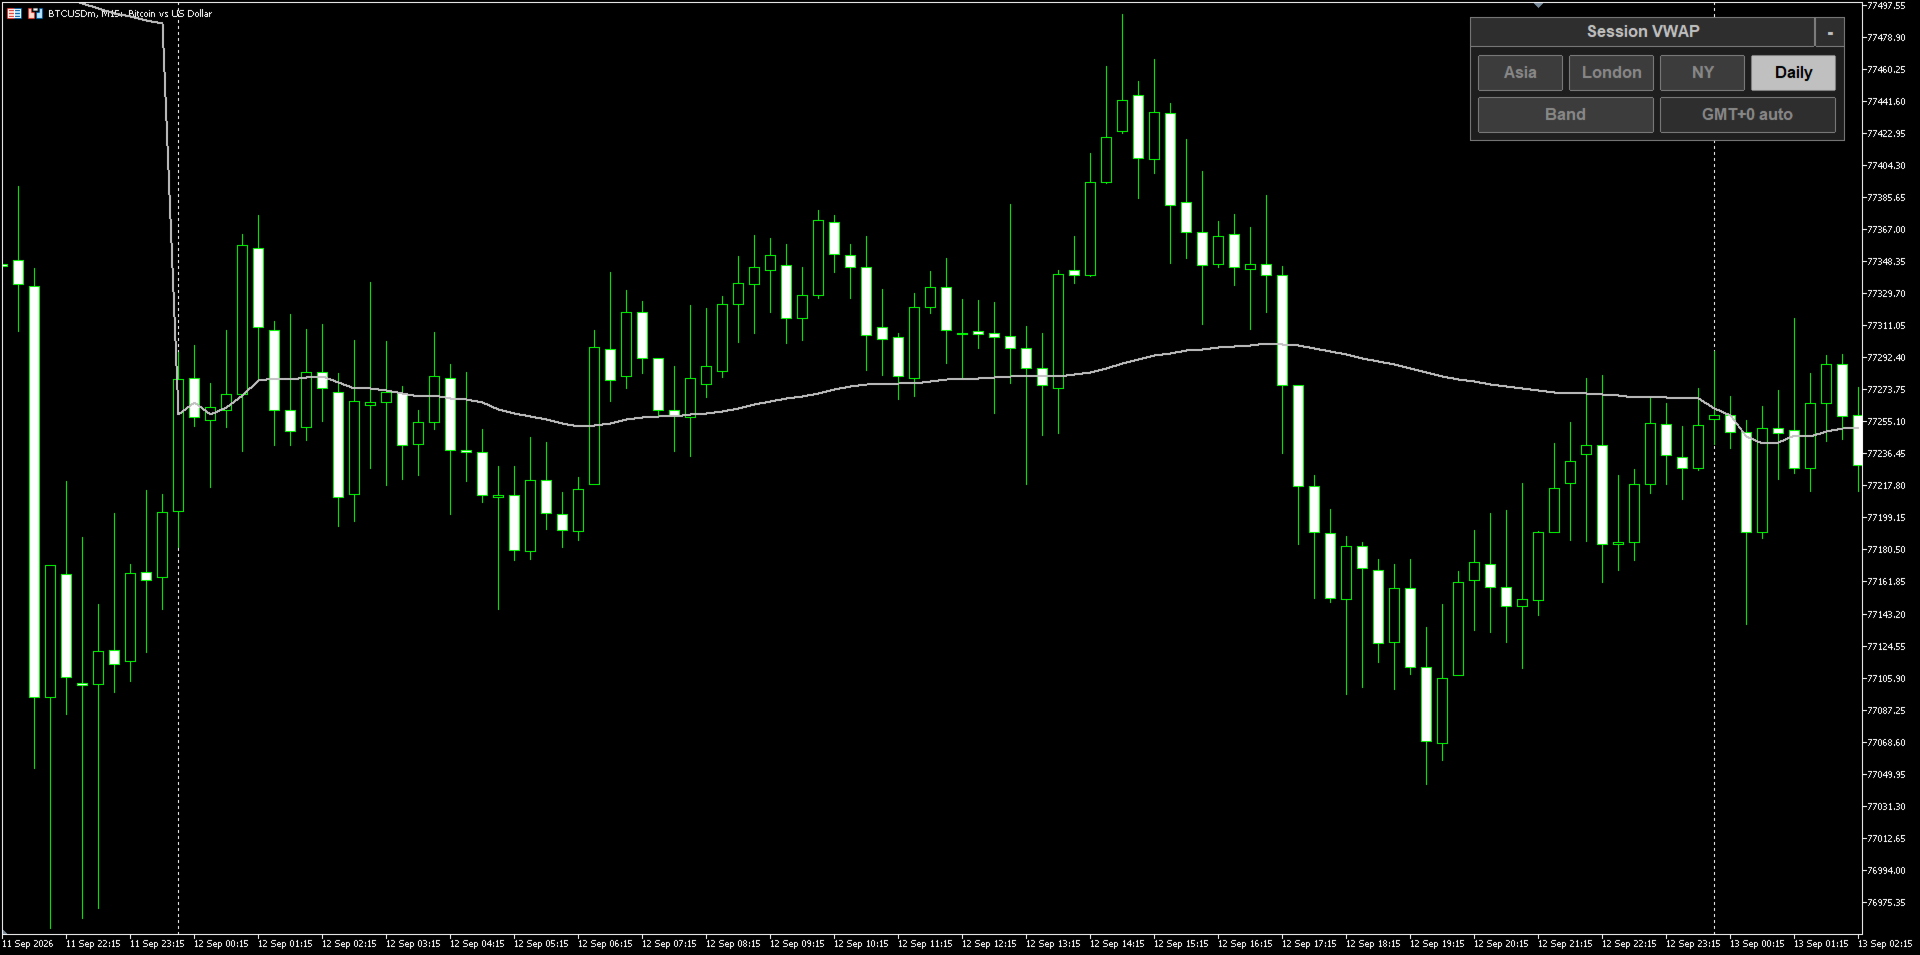
Four volume weighted average price lines in one indicator, each anchored to a different point in the trading day: the Asian session, the London session, the New York session and the daily open. Every anchor can be shown or hidden with one click on the chart, and each one carries its own set of standard deviation bands.
Session times are defined in UTC, not in broker time
Sessions are entered as UTC hours, and the indicator works out the broker server offset on its own by comparing server time with GMT. The detected offset is shown on the control panel, for example GMT+3 auto, and one click re-checks it. If a server reports an unusual time, the offset can be entered by hand instead. This means the same settings give the same session boundaries on every broker, without editing the hours for each server.
Key Features
- Four anchors in one indicator: Asia, London, New York and Daily, shown together or one at a time.
- Small control panel on the chart with one button per anchor plus a Band button - switch any line on or off without opening the settings.
- The panel can be dragged anywhere, minimized to a small bar, and its position and button states are kept when you switch timeframe.
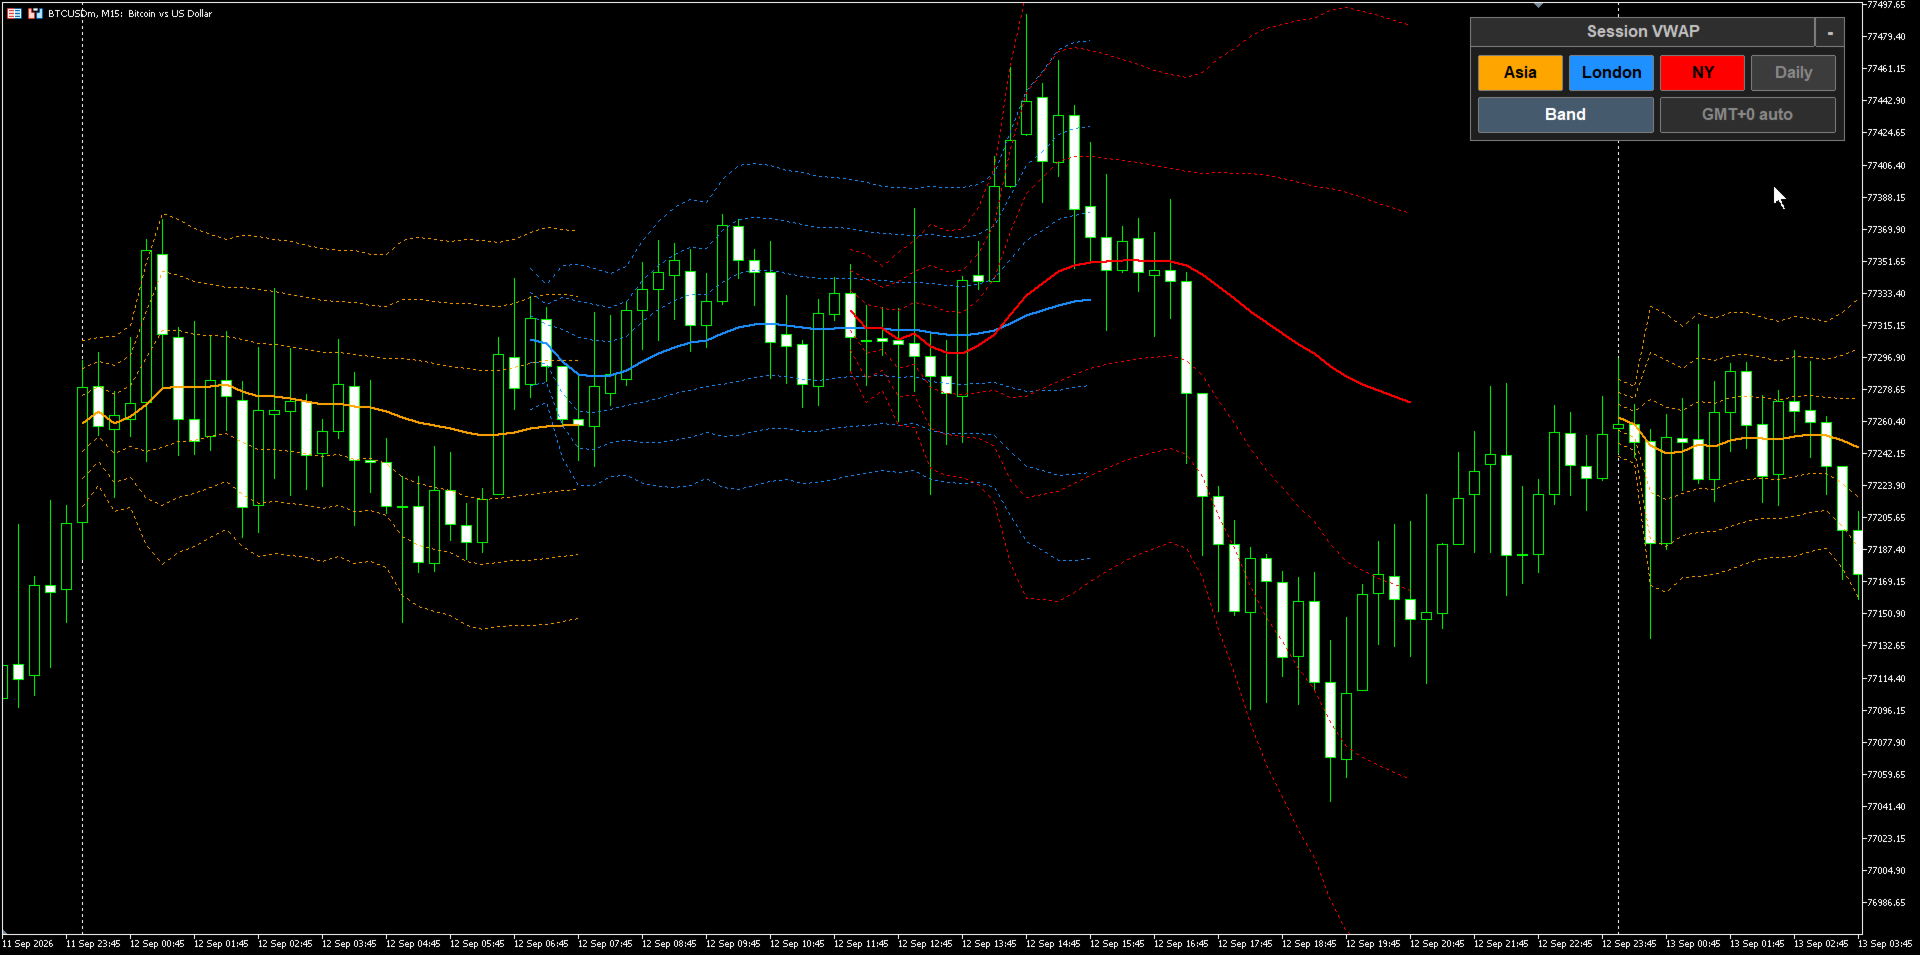
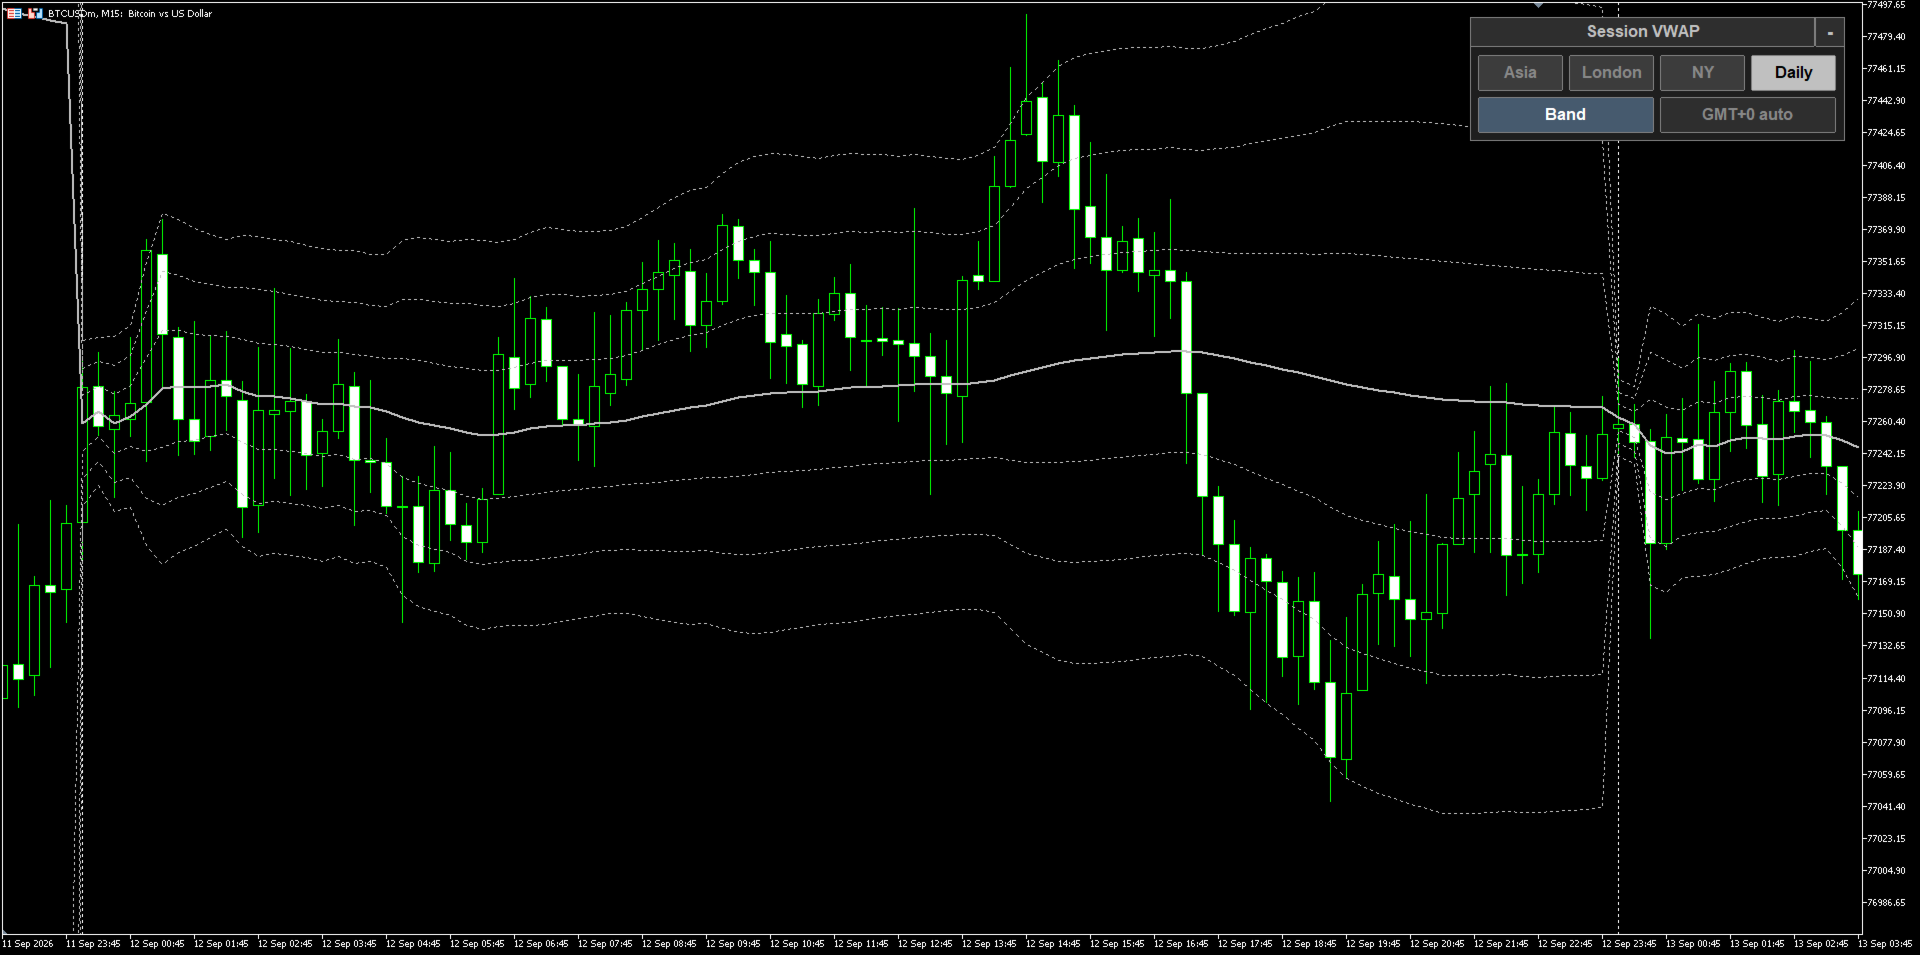
- Standard deviation bands, up to three per side, with an adjustable multiplier for each level.
- Session hours are set in UTC and the broker offset is detected automatically, with a manual override for unusual servers.
- Sessions that run across midnight are handled, so the Asian session can be defined however your plan requires.
- The VWAP is computed on a lower timeframe of your choice (one minute by default) and mapped onto the chart bars, so the value stays close to the true session average even on a higher chart timeframe.
- The line for the session in progress updates on every tick, not only when a new bar opens.
- Past sessions can be shown for a chosen number of days back, for reviewing how price behaved around earlier session VWAPs.
- Weighting by tick volume or by real volume, whichever your symbol provides.
- Every line appears in the Data Window with its own name, and a small tag marks each line on the chart.
- Works on any symbol and any timeframe.
How It Works
For every bar of the calculation timeframe the indicator takes the typical price, that is the high plus the low plus the close divided by three, and weights it by the volume of that bar. Inside a session it keeps a running sum of price times volume and a running sum of volume; the VWAP at any point is the first sum divided by the second, so the line is the average price actually traded since the anchor rather than a simple moving average. The deviation bands come from the volume weighted variance of the same prices, so they open wide right after the anchor, when only a few bars have been counted, and tighten as the session fills out. Each anchor keeps its own running sums and resets when its session starts again, and the daily anchor resets once a day at the hour you choose.
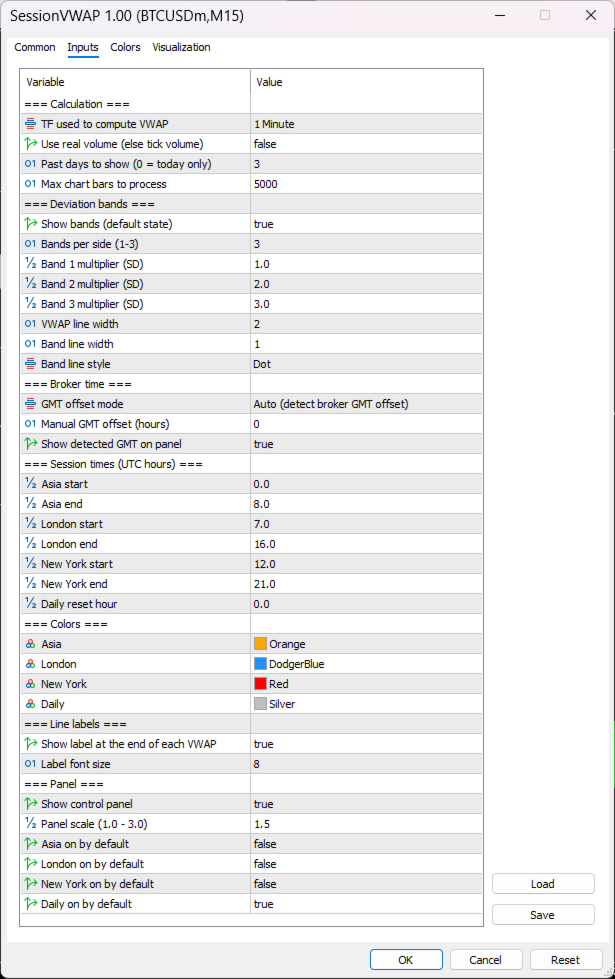
Input Parameters
Calculation
- TF used to compute VWAP - the lower timeframe the sums are built from, one minute by default. A timeframe above the chart timeframe falls back to the chart timeframe.
- Use real volume - weight by real volume instead of tick volume.
- Past days to show - how many earlier days of session lines to draw. Zero draws today only.
- Max chart bars to process - upper limit on the number of chart bars scanned.
Deviation bands
- Show bands - the state the Band button starts in.
- Bands per side - one, two or three levels above and below the VWAP.
- Band 1 / 2 / 3 multiplier - how many standard deviations each level sits at.
- VWAP line width, Band line width and Band line style.
Broker time
- GMT offset mode - detect the broker offset automatically, or set it by hand.
- Manual GMT offset - the offset in hours used in manual mode.
- Show detected GMT on panel - show the offset button on the control panel.
Session times, in UTC hours
- Asia start / end - zero to eight by default.
- London start / end - seven to sixteen by default.
- New York start / end - twelve to twenty one by default.
- Daily reset hour - the hour the daily anchor starts again, midnight UTC by default.
Colours
- One colour per anchor - Asia, London, New York and Daily. The bands follow the colour of their own session and are drawn thinner and dotted.
Line labels
- Show label at the end of each VWAP and Label font size.
Panel
- Show control panel and Panel scale for high resolution screens.
- Asia / London / New York / Daily on by default - which anchors are active when the indicator is first attached.
Notes
- The automatic offset is read from the terminal clock. In the Strategy Tester that clock is less reliable than on a live chart, so use the manual mode there if the session boundaries look shifted.
- This is a visual analysis tool. It does not send trading signals and does not open orders.