Multi Session VWAP with Deviation Bands

Multi Session VWAP with Deviation Bands

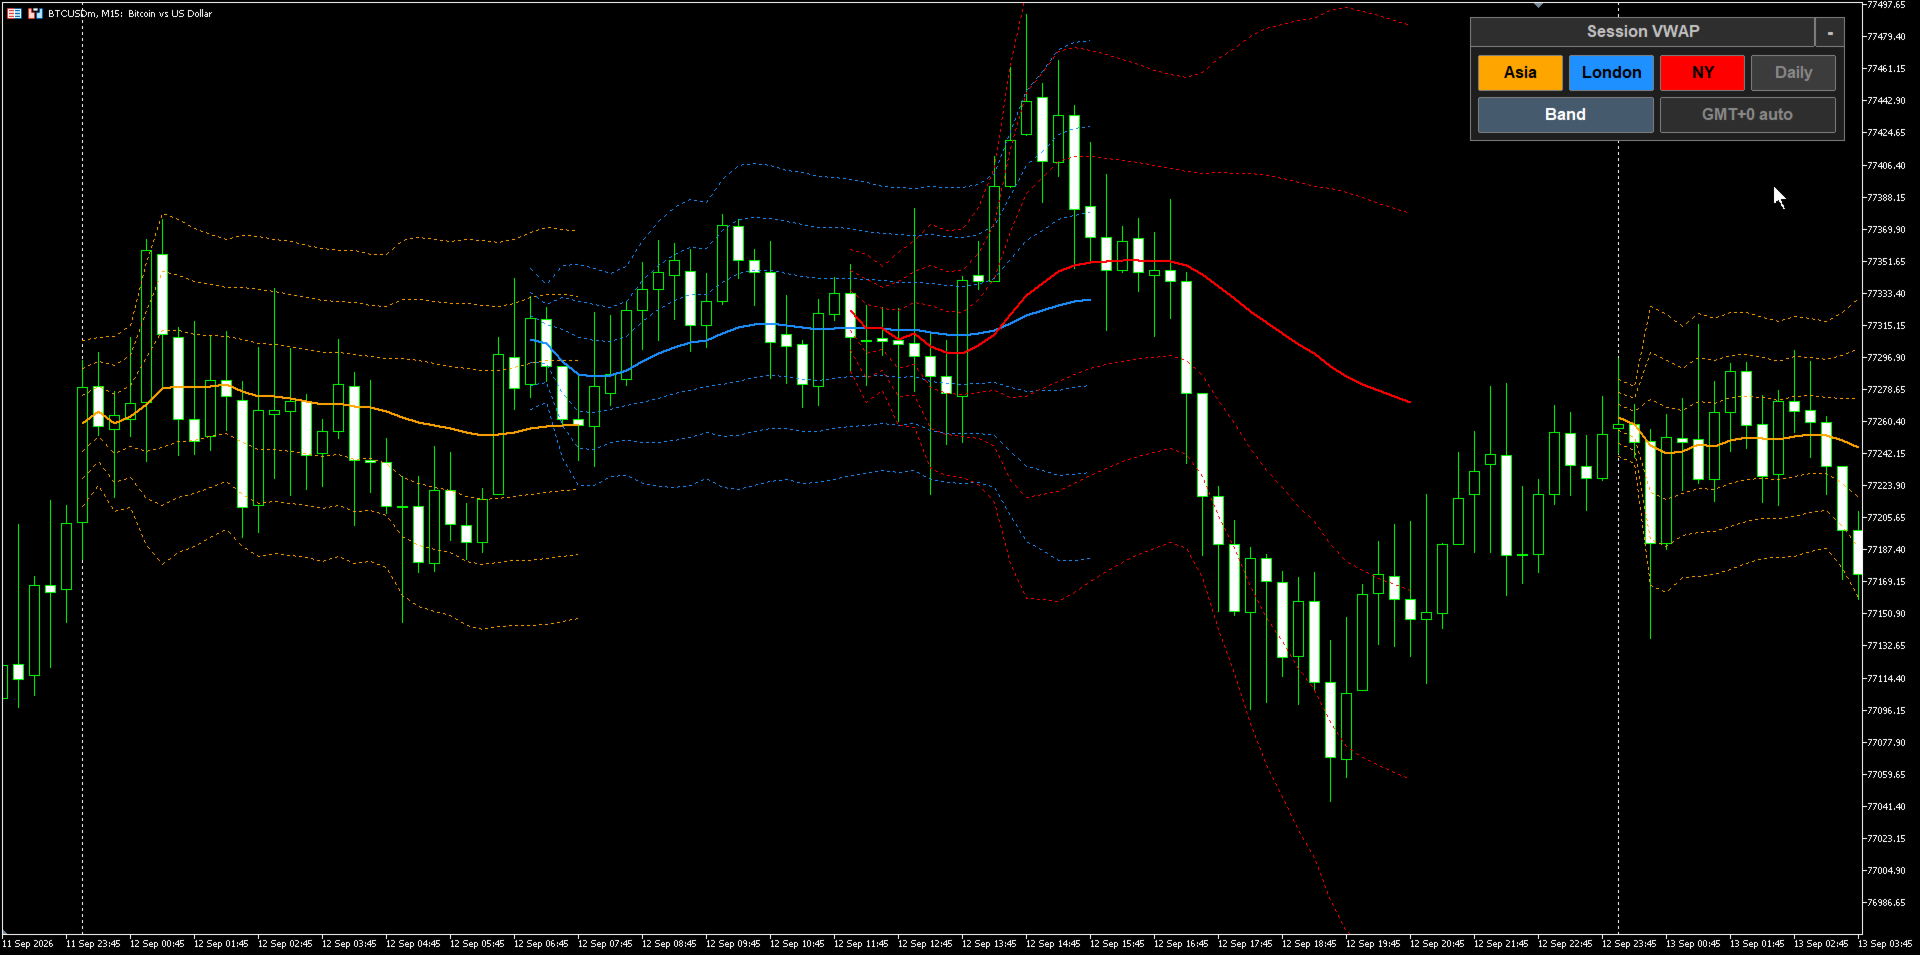
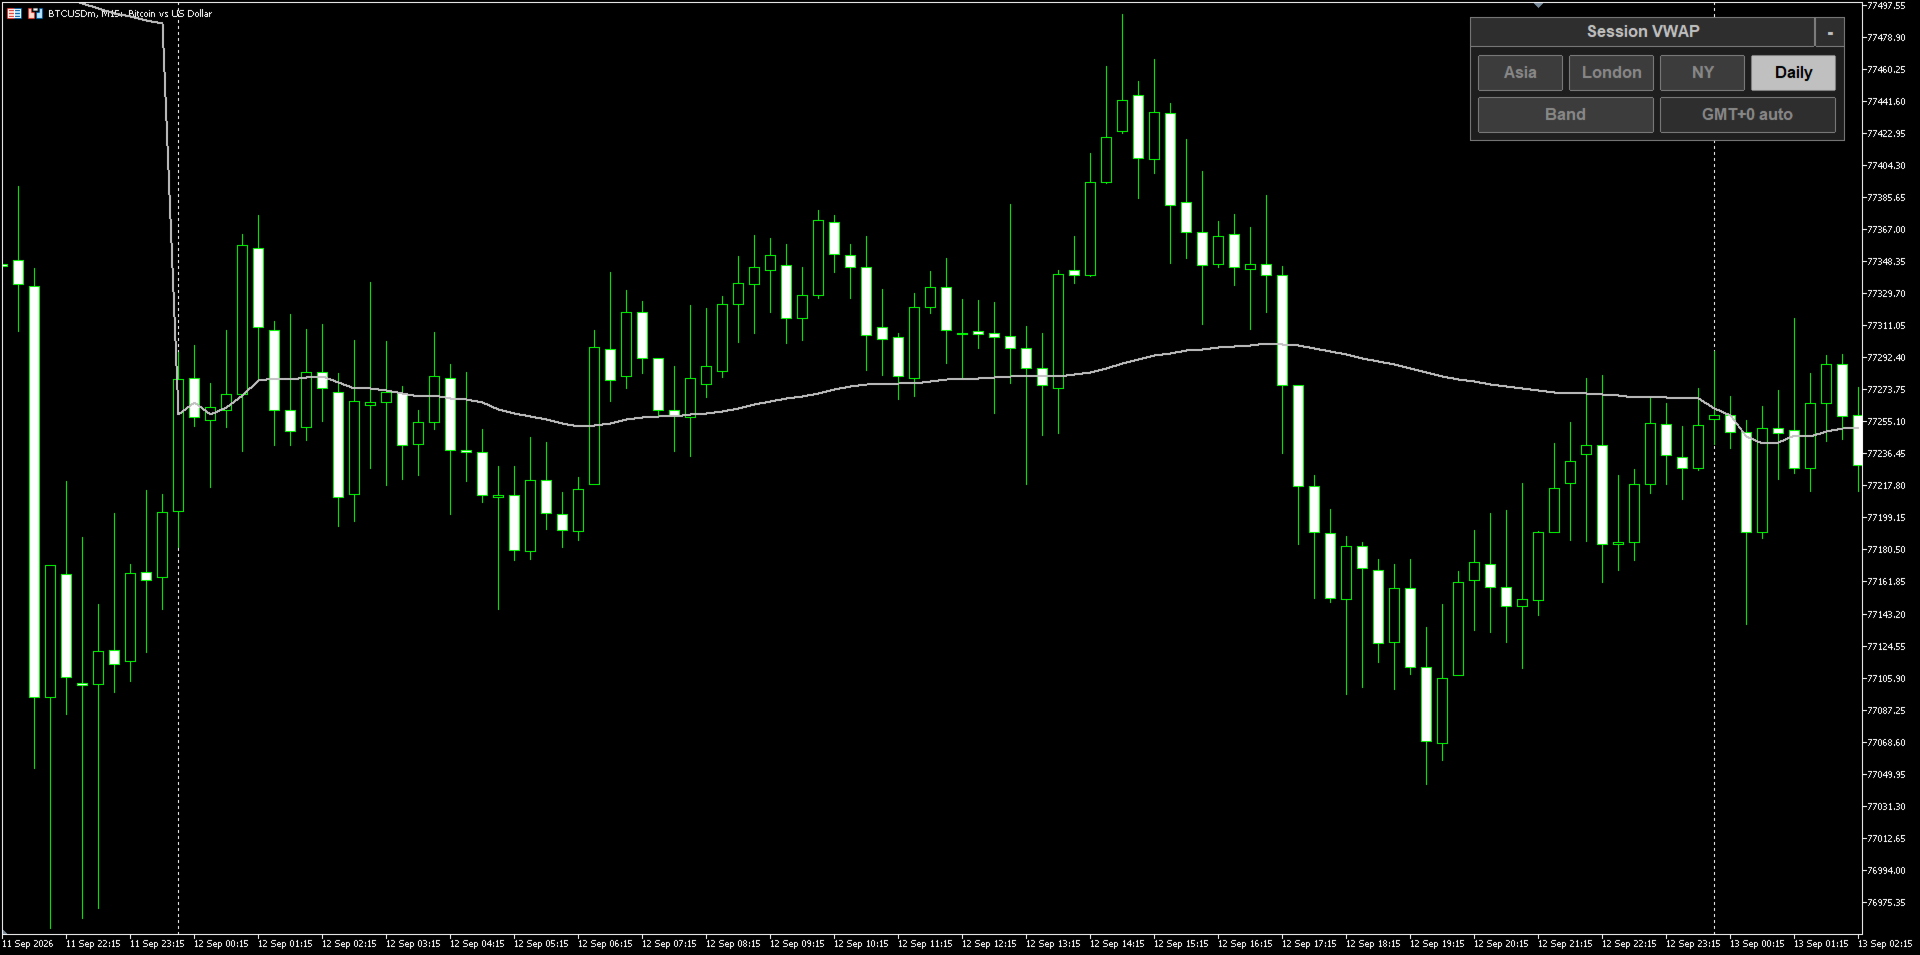
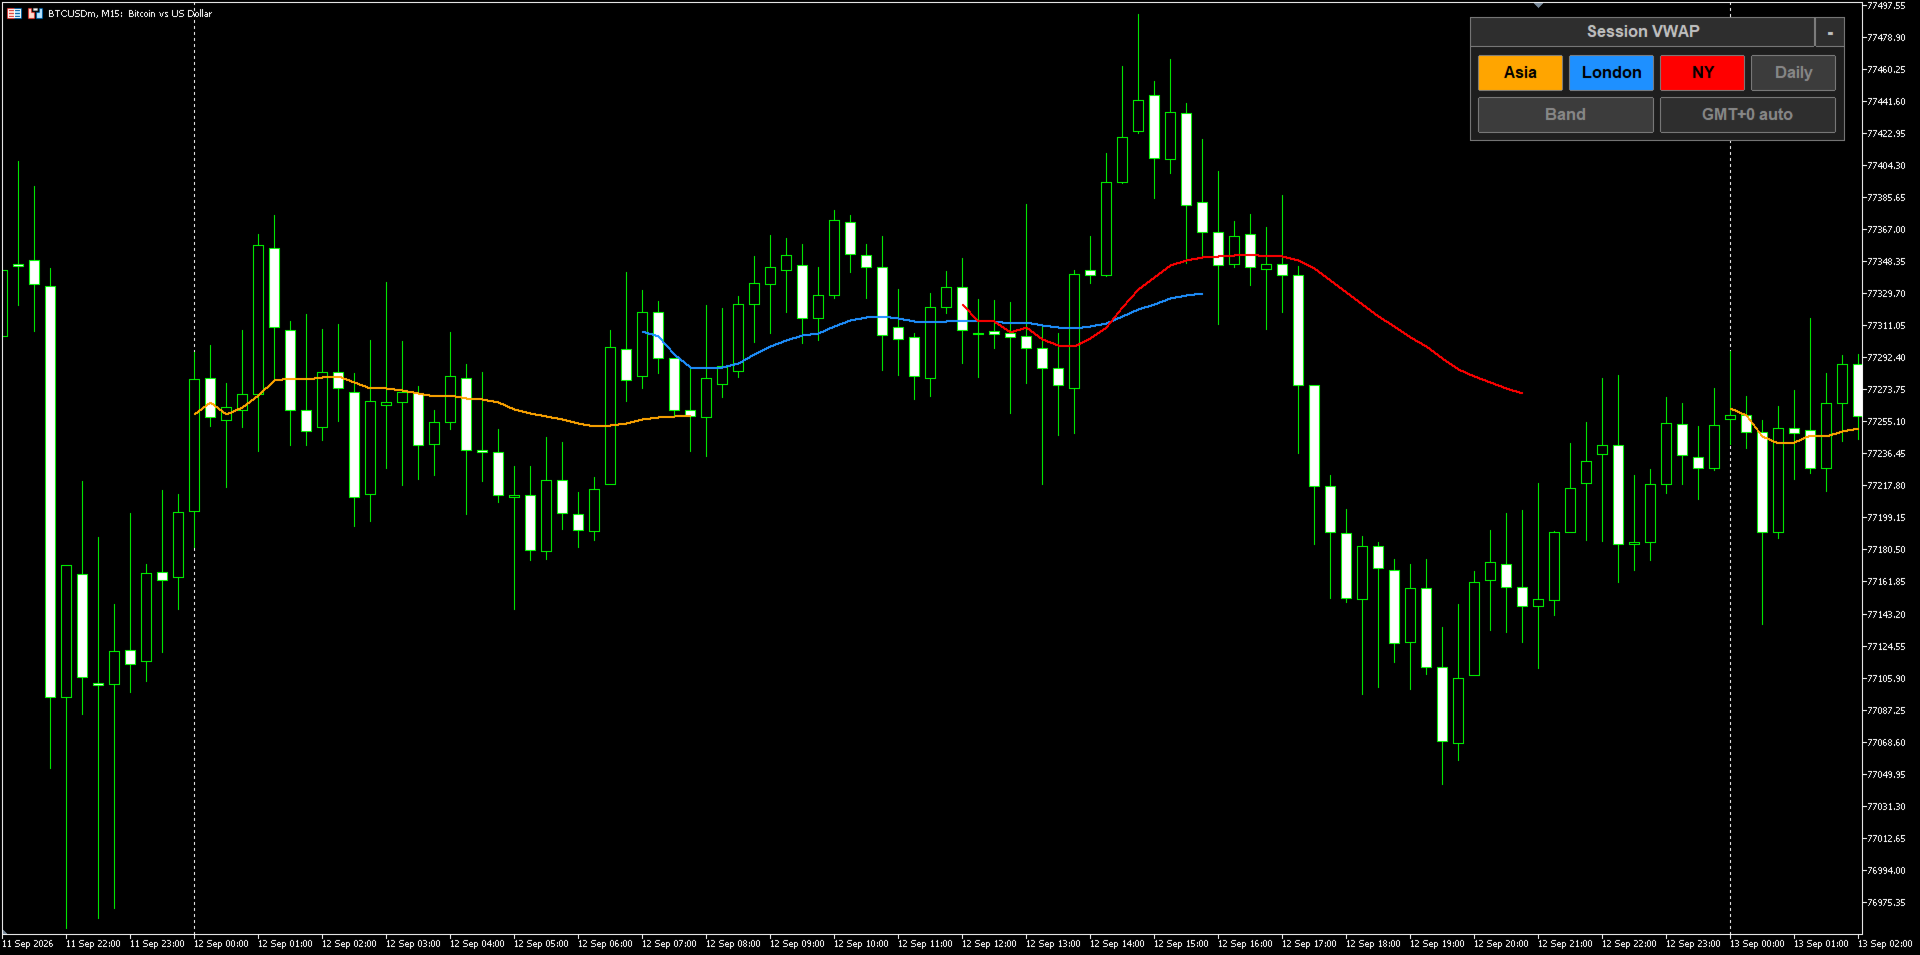
Four volume weighted average price lines in one indicator, each anchored to a different point in the trading day: the Asian session, the London session, the New York session and the daily open. Every anchor can be shown or hidden with one click on the chart, and each one carries its own set of standard deviation bands.

Session times are defined in UTC, not in broker time

Sessions are entered as UTC hours, and the indicator works out the broker server offset on its own by comparing server time with GMT. The detected offset is shown on the control panel, for example GMT+3 auto, and one click re-checks it. If a server reports an unusual time, the offset can be entered by hand instead. This means the same settings give the same session boundaries on every broker, without editing the hours for each server.

Key Features

  • Four anchors in one indicator: Asia, London, New York and Daily, shown together or one at a time.
  • Small control panel on the chart with one button per anchor plus a Band button - switch any line on or off without opening the settings.
  • The panel can be dragged anywhere, minimized to a small bar, and its position and button states are kept when you switch timeframe.
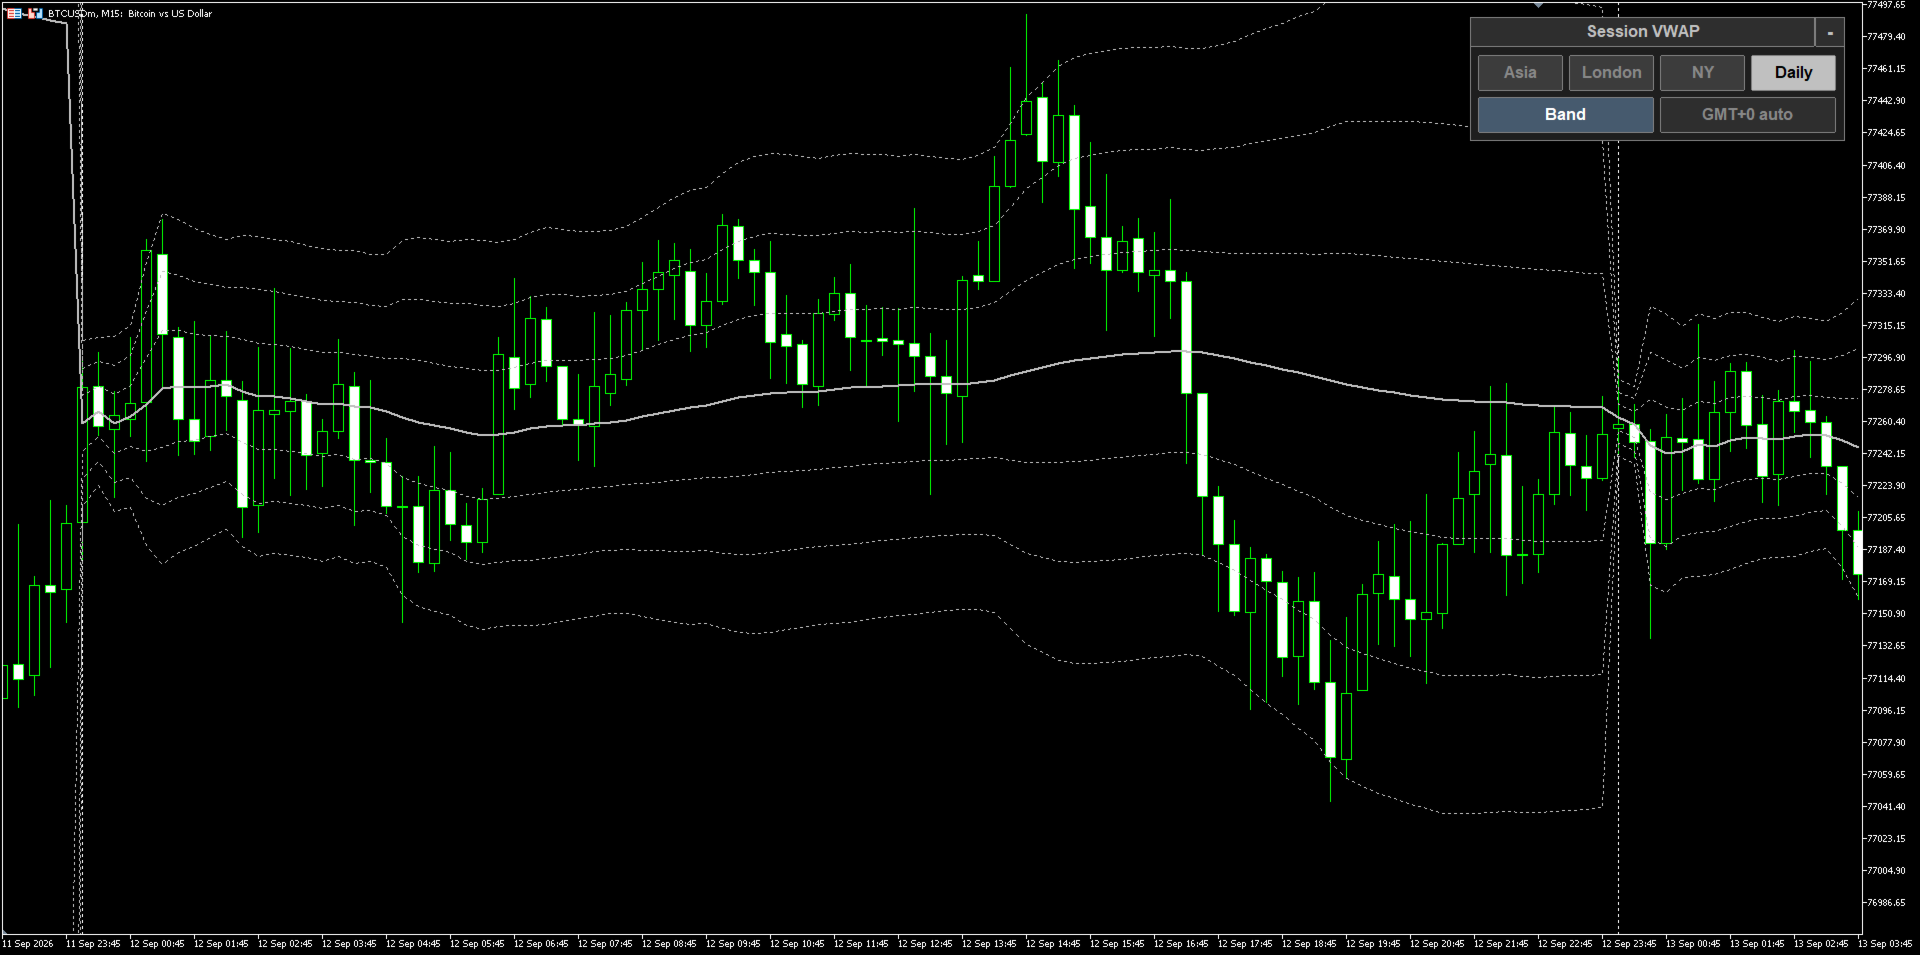
  • Standard deviation bands, up to three per side, with an adjustable multiplier for each level.
  • Session hours are set in UTC and the broker offset is detected automatically, with a manual override for unusual servers.
  • Sessions that run across midnight are handled, so the Asian session can be defined however your plan requires.
  • The VWAP is computed on a lower timeframe of your choice (one minute by default) and mapped onto the chart bars, so the value stays close to the true session average even on a higher chart timeframe.
  • The line for the session in progress updates on every tick, not only when a new bar opens.
  • Past sessions can be shown for a chosen number of days back, for reviewing how price behaved around earlier session VWAPs.
  • Weighting by tick volume or by real volume, whichever your symbol provides.
  • Every line appears in the Data Window with its own name, and a small tag marks each line on the chart.
  • Works on any symbol and any timeframe.

How It Works

For every bar of the calculation timeframe the indicator takes the typical price, that is the high plus the low plus the close divided by three, and weights it by the volume of that bar. Inside a session it keeps a running sum of price times volume and a running sum of volume; the VWAP at any point is the first sum divided by the second, so the line is the average price actually traded since the anchor rather than a simple moving average. The deviation bands come from the volume weighted variance of the same prices, so they open wide right after the anchor, when only a few bars have been counted, and tighten as the session fills out. Each anchor keeps its own running sums and resets when its session starts again, and the daily anchor resets once a day at the hour you choose.

Input Parameters

Calculation

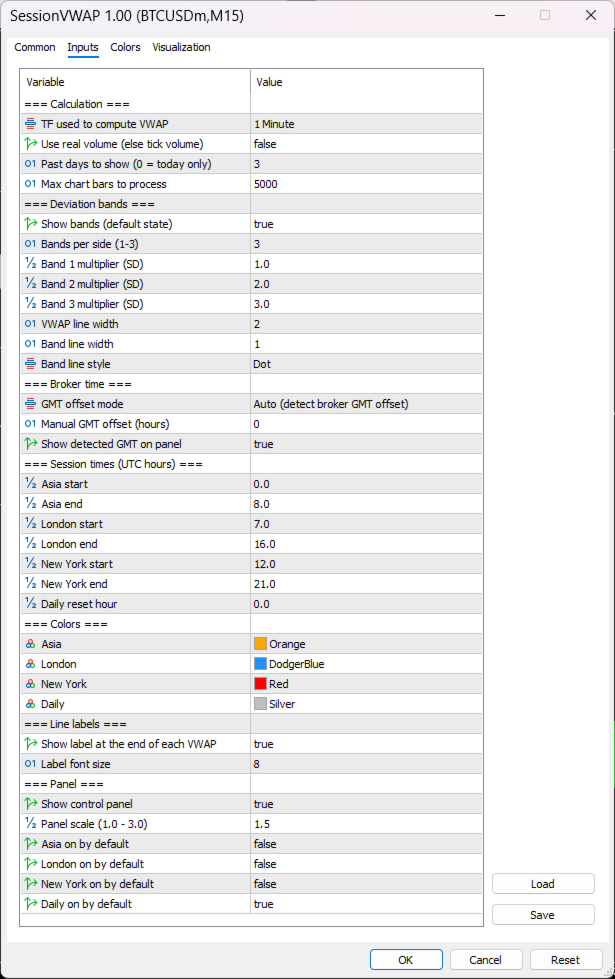
  • TF used to compute VWAP - the lower timeframe the sums are built from, one minute by default. A timeframe above the chart timeframe falls back to the chart timeframe.
  • Use real volume - weight by real volume instead of tick volume.
  • Past days to show - how many earlier days of session lines to draw. Zero draws today only.
  • Max chart bars to process - upper limit on the number of chart bars scanned.

Deviation bands

  • Show bands - the state the Band button starts in.
  • Bands per side - one, two or three levels above and below the VWAP.
  • Band 1 / 2 / 3 multiplier - how many standard deviations each level sits at.
  • VWAP line width, Band line width and Band line style.

Broker time

  • GMT offset mode - detect the broker offset automatically, or set it by hand.
  • Manual GMT offset - the offset in hours used in manual mode.
  • Show detected GMT on panel - show the offset button on the control panel.

Session times, in UTC hours

  • Asia start / end - zero to eight by default.
  • London start / end - seven to sixteen by default.
  • New York start / end - twelve to twenty one by default.
  • Daily reset hour - the hour the daily anchor starts again, midnight UTC by default.

Colours

  • One colour per anchor - Asia, London, New York and Daily. The bands follow the colour of their own session and are drawn thinner and dotted.

Line labels

  • Show label at the end of each VWAP and Label font size.

Panel

  • Show control panel and Panel scale for high resolution screens.
  • Asia / London / New York / Daily on by default - which anchors are active when the indicator is first attached.

Notes

  • The automatic offset is read from the terminal clock. In the Strategy Tester that clock is less reliable than on a live chart, so use the manual mode there if the session boundaries look shifted.
  • This is a visual analysis tool. It does not send trading signals and does not open orders.
おすすめのプロダクト
収縮拡大メーター(Contraction Expansion Meter) 市場の収縮と拡大をリアルタイムで視覚化する、明確で強力なボラティリティ指標です。 ボリンジャーバンドのロジックに基づき、バンドの相対的な幅を測定し、それ自身の移動平均と比較します。これにより、市場が圧縮されている状態(収縮/スクイーズ)か、拡大している状態(ボラティリティブレイクアウト)かを示す、非常に直感的なオシレーターが作成されます。 チャートに表示される内容: ヒストグラム 青いバー → 拡大(ボラティリティが増加中) 赤いバー → 収縮(ボラティリティが減少中/スクイーズ) アクア線 → 現在の偏差幅 ライムグリーン線 → 偏差幅の平均値 ヒストグラムが深く赤く、線が接近しているときは、市場がタイトなスクイーズ状態にあります。これはしばしば強い方向性の動きの前兆となります。ヒストグラムが青に変わり、線が乖離し始めると、ボラティリティが拡大し、トレンドまたはブレイクアウトが進行中です。 主な特徴 クリーンでリペイントしない計算 色分けされたヒストグラムによる即座の視覚認識 ボリンジャー期間、偏差、スクイー
KTボラティリティオシレーターは、過去と現在の市場データを数学的な計算式で分析し、その結果をオシレーター形式で表示します。成長する波と減少する波は、それぞれ資産の高ボラティリティと低ボラティリティを示しています。  簡単に言えば、ボラティリティとは、一定期間内における資産価格の変動幅を測定する指標です。ボラティリティがなければ市場の動きは少なくなり、トレーダーは価格変動から利益を得ることができません。 外国為替市場におけるボラティリティの活用 外国為替市場でボラティリティを活用することで、より効果的に取引ができ、現実的な期待値を持つことが可能になります。  高ボラティリティ トレンドベースのシステムは、高いボラティリティ環境下では大きな値動きとトレンドの持続によって非常に効果的に機能します。 高ボラティリティの時に発生するブレイクアウトは、より多くのピップスを獲得できる可能性があります。 低ボラティリティ 平均回帰型のシステムは、市場が平均に回帰する傾向があるため、低ボラティリティ環境下で特に効果を発揮します。 チャネルベースのシステムは、低ボラティリティ期間中のレンジ相場でより高
RSIScalperProをご紹介します - MetaTrader 5用のRSIベースの画期的なインジケーターで、1分足チャートでのスキャルピングに最適です!RSIScalperProを使うことで、正確なエントリーとエグジットのシグナルを得られる強力なツールを手に入れることができます。 RSIScalperProは、オーバーボートとオーバーソールドのレベルに対する明確なシグナルを提供する2つの異なるRSI指標を使用しています。好みに合わせて2つのRSIの時間枠や制限値を調整することができ、トレーディング戦略に最適な結果を得ることができます。チャート上の個々の矢印は、トレードのエントリーとエグジットのタイミングを簡単に特定するのに役立ちます。 また、RSIScalperProの特徴の1つは、カスタマイズ可能な3つの移動平均線です。これにより、トレンドの方向を判断し、強力なトレードシグナルを確認するのに役立ちます。これにより、早い段階でトレンドを検出し、収益性の高い取引に参加することができます。 さらに、RSIScalperProを新しい取引シグナルが出た際に音で知らせるように設定するこ
The  OBV MTF  is an Enterprise-grade On-Balance Volume indicator that transforms standard OBV into a complete trading system. It combines gradient-aware momentum analysis, divergence detection, multi-timeframe alignment, and dynamic customisable midpoint-filtering in a single intuitive professional volume analysis tool. Core Features 1. 5-State Momentum Engine Aqua (Strong Bullish) : OBV slope rising with positive acceleration SteelBlue (Weak Bullish) : OBV rising but losing momentum Gray (Neutr
The Vwap Bands Auto indicator seeks to automatically map the maximum market frequency ( automatic update of the outermost band ) and has two intermediate bands that also adjust to daily volatility. Another tool from White Trader that combines price and volume, in addition to mapping the daily amplitude. The external band is updated automatically when the daily maximum or minimum breaks the current frequency, and can be an input signal, seeking a return to the daily vwap. Thus, in addition t
3つのインジケーターが力を合わせる! Trix TURBOは、オシレーターのファミリーに属するインジケーターで、MetaTrader 5用にカスタマイズされ、Triple Exponential Moving Average (TRIX) オシレーターをParabolic SAR (SAR)と組み合わせ、動的な着色を行い、シンプルな移動平均 (MA) でスムージングします。 このツールは、別ウィンドウでモメンタムとトレンド方向の視覚的な表現を提供します。TRIXのライン(またはヒストグラム)は、SARの価格に対する位置に基づいて着色されます:アクアで潜在的な上昇トレンド(SARが価格の下)、コーラルで潜在的な下降トレンド(SARが価格の上)。含まれるMAは、可能なクロスオーバーを特定してエントリー/エグジットシグナルを助けます。 主な機能: TRIX期間、適用価格、およびMAパラメーターのカスタマイズ可能。 SARのステップと最大値でトレンド感度を調整。 カラーラインまたはヒストグラムとして表示するオプションで、強さとダイバージェンスをより良く視覚化。 ユーザー定義の色で上昇および下降
Asa Orderflow Footprint v3 — 製品説明書 概要 Asa Orderflow Footprintは、MetaTrader 5向けに開発されたプロフェッショナル仕様のフットプリントチャートインジケーターです。各ローソク足の内部におけるすべての価格レベルで、リアルタイムのBid/Askボリューム(またはティック数)をレンダリングします。本格的なオーダーフロー(注文流)トレーダー向けに設計されており、通常のフットプリントの枠を超え、POC(Point of Control)の移動分析、一目でわかるオーダーフローダッシュボード、スタックド・インバランス(積み重なった不均衡)検出、アブソープション(吸収)フラグ、未テストのPOC(Naked POC)ラインなど、多彩な機能をメインチャートウィンドウ内に集約(サブウィンドウ不要)しています。 ゴールド(XAUUSD)のデータフィードで設計・テストされており、アグレッサー(仕掛け側)データを提供するフィードではフラグベースのティック分類エンジンによって買い手主導と売り手主導の活動を分離し、データがないフィードでは純粋な
This Indicator adding power to traditional zigzag indicator. With High-Low numbers in vision it will be easier to estimate change of trend by knowing the depth of each wave. Information including points, pips, percentage%, and #bars can be displayed based on configuration. All information is real-time update. This indicator is especially useful in sideway market to buy low sell high.
GoldTrade Ultra MT5 Gold does not wait. Risk control should not arrive late. GoldTrade Ultra is a fully automated trading system developed specifically for XAUUSD. It does more than generate a Buy or Sell signal. It connects   trend detection, order execution, controlled layering, basket management, profit protection and account-level safeguards   into one complete workflow. From the moment the first position is opened, the EA continues to evaluate whether the direction remains valid, whether vo
If you are unsure how to use this indicator, please feel free to reach out to me. I will explain it to you and provide reading materials to help you make the most of it. TD Sequential Scanner: An Overview The TD Sequential scanner is a powerful technical analysis tool designed to identify potential price exhaustion points and trend reversals in financial markets. Developed by Tom DeMark, this method is widely used by traders to gauge market cycles and potential turning points with precision. Ho
A complex of indicators of recognizing reversal moments. Detects the peaks and hollows according to the combinations of candles after they deduct from two MA. Applicable for trading systems when using early inputs. You can use a trend for scalping and intraday trade, and for detecting a trend in the early stages. Possibilities The parameters provide flexible settings for any time floms and trading tools. There are several types of warning for signals. Yellow arrow - Sell signal , pink arrow -
Automated Anchored Volume Weighted Average Price You set a period, and the indicator will find the highest and lowest price point in the period and derive a AVWAP from there. It also prints out a median line. You can use the generated VWAP lines as a channel, as S/R levels or as a volatility indicator. It's based on tick volume to be compatible with most CFD brokers. Happy trading!
ShortBS是一个很好的短线交易指示器,能很好与 BestPointOfInitiation ( https://www.mql5.com/zh/market/product/96671 )配合,能让你找到最合适的buy和sell位置,指标不含有未来函数,不会重新绘制。是一个针对(如果你感觉到这个指标能够帮助你进行更准确的交易,请帮忙给个好评,希望我的作品能够帮助更多有需要的人) ===================参数列表===================== maPeriod: 25 slowPeriod:20 fastPeriod:10 stepPeriod:5 =================参考使用方法=================== 此指标可以适用于任何交易品种,能够用在任何周期。
Anchored VWAP Trading Indicator Struggling to identify true market value and key support/resistance levels? The Anchored VWAP Trading Indicator helps you track price based on real traded volume, giving you a clear edge in your trading decisions. This tool allows you to anchor VWAP from any point on the chart, making it ideal for analyzing trends, reversals, and institutional activity. Key Features Anchored VWAP from any candle Accurate volume-weighted price calculation Works on all symbol
The Premium RangeXpert Extension with Multi-Timeframe Trading Signals for Forex, Gold & Bitcoin RangeXpert+ is the premium extension of the well-known RangeXpert — one of the Top-10 free indicators on the market, with over 10,000 downloads and an extremely active community. While the free version delivers precise breakout signals on a single chart, RangeXpert+ provides exactly what professional traders demand: a complete multi-timeframe cockpit directly in your chart, perfectly optimized for h
SMC Vision
Kriangkrai Pongtiwat
SMC ProVision 2.0 — Professional Smart Money Concept Analysis Stop guessing. Start reading the market like institutions do. SMC ProVision maps the full smart money footprint directly on your chart — with a clean, minimal design that won't clutter your screen. Market Structure — BOS / CHoCH with HH・HL・LH・LL labels Order Blocks — Standard & Refined with mitigation tracking Breaker Blocks — Auto-converted from mitigated OBs Fair Value Gaps — Fill percentage & mitigation status Liquidity —
FREE
The VTC Volatility indicator was written to support a Brazilian stock market strategy in the WDO (USDBRL), but it can be adapted to other strategies and markets. In the new indicator update, it is now allowed to choose up to 4 levels to determine the range, and thus be more versatile. The Brazilian stock exchange (B3) has the VTC which is a "Structured Exchange Rate Volatility Transaction" (more information on the B3 website). At around 10:00 am, the VTC "Call" comes out and Brazilian broker
Utilities
Douglas Lucio De Araujo
Indicator with 3 features - Clock : Clock independent of the chart, counting continues even when the market is closed. - Template : After setting up a configuration in any graphic, be it color patterns, indicators, zoom ... The configuration will be copied to all active graphics. - TimeFrame : Set the TimeFrame on a chart, and with just one click all the active charts will be changed to the same TimeFrame.
GALAXY it is a Secure Automated Software for trade Forex market and indices. Architecture is a Fully Automatic Autonomous Robot Expert capable Independently analyzing the market and making trading decisions   GALAXY     It is an advanced trading system. This is a fully automatic Expert Advisor.      NO INPUT TO SELECT FOR THE TRADER ALL AUTOMATED THIS SYSTEM IS ALWAIS IN THE MARKET IN THE TWO DIRECCTION MAKE WINING CYCLES  GALAXY . It is a 100% automatic system, the system controls both
Появилось желание торговать  движение, пробой на самой  высокой волатильности, или запустить советника-усреднителя торговать боковик в тихой низковолатильной гавани тогда этот продукт для Вас! Индикатор анализирует 28 валютных пар (основные и кроссы) и в зависимости от выбранных настроек покажет самые высоковолатильные (max) или наоборот (min).       Как измерить волатильность? Существует 2 способа. Первый это измерить  рендж заданного количества последних баров (bar). Второй замерить о
This indicator marks the relevant volume levels among the day. The two relevant levels are the candle with more volume and the period with more volume of lots transacted.  The filled red background is the range of price with the most relevant volume of the day (probably the big player that is command the game). The purple lines shows the range of price with most volume (probably a area where some big player is accumulating before force a market direction). There is also the dot lines that marks
Develop this indicator for periods of 30 minutes or more, focus on getting market trends right and making sure they are met. MFOP v8.1 gets straight to the point: it scans the market and tells you exactly when there is enough strength to enter a trade. This indicator doesn't do magic, it uses mathematical algorithms to filter out market noise, not enter into false breakouts and show you clear BUY (blue arrow) and SELL (red arrow) opportunities. It is designed and optimized specifically to take
Monster Breakout Index V2 is a clean, visual momentum indicator engineered to spot potential breakout opportunities by evaluating extreme price extensions against median historical range channels. Overview The indicator continuously monitors the median price across a configurable lookback window and compares it against current high and low extremes. When price expansion breaks out of the established median bounds, MBI V2 immediately plots distinct histogram bars in a separate window, allowing tr
Veltrion Smart Fibonacci   is a clean automatic Fibonacci structure overlay for MetaTrader 5. It automatically detects recent swing highs and swing lows, then draws key Fibonacci retracement levels directly on the chart. The indicator is designed to help traders visualize market structure, retracement zones, and the golden zone without manually drawing Fibonacci tools. Key Features Automatic swing high and swing low detection Clean Fibonacci retracement overlay Horizontal Fibonacci levels for a
The indicator helps to enter a trade following the trend, at the same time, after some correction. It finds strong trending movements of a currency pair on a given number of bars, and also finds correction levels to this trend. If the trend is strong enough, and the correction becomes equal to the one specified in the parameters, then the indicator signals this. You can set different correction values, 38, 50 and 62 (Fibonacci levels) are better. In addition, you can set the minimum trend lengt
Hrum
Yvan Musatov
4 (1)
The Hrum indicator was created to neutralize temporary pauses and rollbacks. It analyzes price behavior and, if there is a temporary weakness in the trend, you can notice this from the indicator readings, as in the case of a pronounced change in trend direction. Entering the market is not difficult, but staying in it is much more difficult. With the Giordano Bruno indicator and its unique trend line, staying on trend will become much easier! Every rise and every fall is reflected in your emoti
Institutional Structure Pro は、MetaTrader 5 用のインジケーターであり、マーケットストラクチャー、Order Blocks、Fair Value Gaps、マルチタイムフレームのコンフルエンス分析に重点を置いています。 Institutional Structure Pro は、トレーダーが市場構造をより明確に把握できるように開発されました。このインジケーターは、BOS、CHoCH、Order Blocks、Fair Value Gaps、Premium および Discount ゾーン、Equal Highs と Equal Lows、RSI ダイバージェンス、HMA によるトレンドコンテキスト、マーケットセッション、Volume Profile の参照レベルなど、機関投資家型の価格分析コンセプトを使用します。 このインジケーターは自動売買を行わず、ユーザーの代わりに取引判断を行うものではありません。目的は、重要な市場情報をチャート上に整理して表示し、トレーダーがより見やすく構造化された形で潜在的なシナリオを評価できるようにすることです。 In
Volume Bubbles  See the volume outliers and divergence bars — before they reverse on you. Volume Bubbles — on-chart volume spike detector with divergence arrows. Most volume tools dump a histogram at the bottom of your screen and leave you to guess which bars actually mattered. Volume Bubbles puts the answer directly on the chart: a bubble on the bar, sized by how unusual the volume was, colored by what that volume means, with an arrow when the volume story disagrees with the price story. Wha
Daily VP Professional – Intraday Volume Profile for MT5 Daily VP Professional is a powerful, institutional-grade Volume Profile indicator built specifically for day traders, scalpers, and market structure analysts on MetaTrader 5. While standard technical indicators rely solely on time-based calculations, Daily VP Professional organizes volume directly by price levels across daily trading sessions. This exposes key institutional accumulation and distribution zones, giving you clear visibility in
FREE
このプロダクトを購入した人は以下も購入しています
この製品は 2026 年の市場向けに更新され、最新の MT5 ビルドに最適化されています。 価格更新のお知らせ: Smart Trend Trading System は現在 $99 で提供されています。 次の 30 件の購入 後、価格は $199 に上がります。 特別オファー: Smart Trend Trading System を購入後、私にプライベートメッセージを送ることで、 Smart Universal EA を無料 で受け取り、Smart Trend のシグナルを自動売買に変えることができます。 Smart Trend Trading System は、リペイントなし、再描画なし、遅延なしの完全なトレーディングシステムです。よりクリーンなシグナル、より明確なトレンド方向、そしてより整理された取引方法を求めるトレーダー向けに作られています。 Learn Smart Trend Trading System Everything you need to learn, install, and use the product is available here: Online
Trend Sniper X
Sarvarbek Abduvoxobov
4.88 (32)
Trend Sniper X は、トレードの方向性と潜在的な反転ポイントを明確かつ正確に特定するのに役立つ、MetaTrader 5 用のマルチタイムフレーム・トレンドフォロー指標です。 MT4用: https://www.mql5.com/en/market/product/193245 価格情報: 現在の価格はプロモーション価格であり、今後のアップデートや新機能のリリースに伴い変更される場合があります。 ボーナス特典: このインジケーター用の無料自動売買アシスタントEAを入手するには、購入後に an 著者(開発者)へメッセージをお送りください。 Code2Profit チャンネル マルチタイムフレーム分析で相場をマスターしよう! Trend Sniper X で勝率を最大化する方法:重要なルールとセッションのコツ 技術仕様 プラットフォーム MetaTrader 5 インジケータータイプ マルチタイムフレーム・トレンドインジケーター 操作タイムフレーム あらゆるチャートタイムフレームに対応。個別に選択可能な上位タイムフレーム (M1–MN1) を搭載 主要銘柄 FX、ゴールド (X
まず正直に言いましょう。 どんなインジケーターも、それ単体であなたを利益化させることはできません。もしそう言う人がいるなら、それは夢を売っているだけです。完璧な売買シグナル(矢印)を表示するインジケーターは、いくらでも“完璧に見せる”ことができます。正しい過去の区間を拡大して、勝ちトレードだけを切り取ればいいだけです。私たちはそれをしません。 SMC Intraday Formula はツールです。 市場構造を読み取り、最も高い確率の価格ゾーンを特定し、今この瞬間のスマートマネーの痕跡をシンプルな言葉で正確に示します。最終判断はあなたが行います。トレードを実行するのもあなたです。しかし今は「希望」ではなく「精度」でエントリーできます。 私たちはこのインジケーターを、ゴールド(XAUUSD)および主要FX通貨ペアで約3年間、日々のスキャルピングに使用してきました。M1、M5、M15、M30の主要ツールです。これは未来を予測しようとするのではなく、今まさに形成されている高確率セットアップを示し、その理由を説明します。 他のすべてのインジケーターと何が違うのか? ほとんどのトレーディングイ
Neuro Poseidon is a new indicator by Daria Rezueva. It combines precise trading signals with adaptive TP/SL levels - creating best possible trades as a result! Message me and get  Neuro Poseidon Assistant  as a gift to automize your trading process! What makes it stand out? 1. Proven profitability on all assets and timeframes 2. Only confirmed BUY and SELL signals present on the chart 3. Adaptive TP & SL levels generated by the software for each trade 4. Easy to understand - suitable for al
SuperScalp Pro
Van Minh Nguyen
4.63 (32)
SuperScalp Pro - Professional Multi-Layer Confluence Scalping System SuperScalp Proは、クラシックなSupertrendに複数のインテリジェントな確認フィルターを追加した、高度なスキャルピングインジケーターです。より高い確率が期待できるBuy/Sellの取引機会を特定し、ダマシのシグナルを大幅に減らすことをサポートします。 明確なBuyとSellの矢印がチャート上に直接表示され、ATRに基づくStop LossとTake Profitのレベルがリアルタイムで自動計算されます。 購入後、設定方法や推奨設定についてのサポートが必要な場合は、私にご連絡ください。 SuperScalp Pro Auto Traderを使用して、シグナルを簡単に自動化できます: [Auto Trader] 推奨設定ファイルをダウンロード: [Set File] 完全なドキュメントは製品ブログでご覧いただけます: [User Guide] 最新情報を受け取るには公式チャンネルに参加してください: [Official Channel]
Welcome to ENTRY IN THE ZONE AND SMC MULTI TIMEFRAME Entry In The Zone and SMC Multi Timeframe is a real-time market analysis tool based on Smart Money Concepts (SMC), designed to analyze market structure, price direction, and key trading zones. It supports both Single-Timeframe Analysis and Multi-Timeframe Analysis, providing a clearer view of the overall market structure across multiple timeframes, with real-time BUY / SELL signals that do not repaint. It is designed to help filter trading opp
Zoryk Gold
Reda El Koutbane
5 (7)
割引は 24 時間後に終了します — 次の価格は$ 69 ZORYK — MetaTrader 5専用 XAUUSDシグナル・トレードプランニングシステム このような経験はありませんか。 ゴールドを分析し、エントリーを待ち、ようやくポジションを持った直後に価格が逆方向へ動く。 早すぎる決済をしてしまったり、Stop Lossを動かしたり、数秒迷っている間にチャンスを逃したりする。 その後、相場は自分が最初に予想していた方向へ進み、目標へ到達する。 問題は常に方向判断ではありません。 本当の問題は、明確な計画がなかったことです。 どこでエントリーすべきか。 どこでトレードの前提が無効になるのか。 近い利益を確保すべきか、より大きな値動きを待つべきか。 現在のsetupが本当に強いのか、それとも無理にトレードを探しているだけなのか。 ゴールドは非常に速く動きます。 正しい分析でも、明確なプランがなければ数秒で悪い判断に変わることがあります。 ZORYKは、その問題を解決するために開発されました。 ZORYKとは ZORYKは、MetaTrader 5とXAU
GoldenX Entryは、MT5向けのインジケーターであり、適応型Smart Entry Trendアルゴリズム、シグナルスコアリングシステム、マーケットレジーム検出機能、およびボラティリティフィルターを備えています。各シグナルには、計算されたエントリーレベル、3つのテイクプロフィット(TP1、TP2、TP3)、およびストップロスレベルが含まれます。本インジケーターは、異なる市場環境に適応するために設計された複数の分析レイヤー上に構築されており、マルチレイヤー分析システムと内蔵オプティマイザーおよび統計トラッキングシステムを組み合わせています。リスク・リワード(RR)指標および過去のトレード履歴に基づく定量分析を提供します。 使い始めは簡単です — 選択した時間足でオプティマイザーを実行し、そのままチャート上でインジケーターを使用します。 コア機能 GoldenX Entryは、シグナルエンジンとトレード管理機能、そして過去統計トラッキングを1つのチャートに統合しています: - 内蔵オプティマイザー: オプティマイザーはチャート上でワンクリックで実行できます。200通りのパラメー
Reversion King Indicator
Eugen-alexandru Zibileanu
5 (7)
新たな王者が登場 - インジケーター + 注文管理表示(TP1 + TP2 + TP3)+ オプションのTelegramシグナル送信機能付き(無料) (完全なトレード&シグナルシステム) ゴールド向け最高のEA: Gold Slayer このインジケーターには、高度な戦略、カスタマイズ可能な注文管理システム、そしてエンベロープ拡張を組み合わせた平均回帰システムが搭載されています。さらに、RSIなど複数のインテリジェントな確認フィルターによって、高確率の反転エントリーをBUY・SELLシグナルとして検出します。 単にトレードを学ぶだけでなく、複数ポジションを効果的に管理し、過去に利益を出しているオープンポジションで損失トレードをカバーする方法も学べます。 M5向けに構築・最適化されており、流動性が高くシグナルの精度が安定しているBTCUSDとXAUUSDで優れたパフォーマンスを発揮します。 このインジケーターは、ATRを基に自動計算されたエントリー、ストップロス、テイクプロフィットレベルを備えた明確なLong・Shortシグナルを提供するため、リスク管理が最初から組み込まれています。 マ
UNIX Scalper — Gold Scalping Indicator for MetaTrader 5 UNIX Scalper is a focused Gold scalping indicator designed primarily for XAUUSD on M1, M2, M3, M5, M10 and M15. It gives the trader a clear BUY, SELL or WAIT decision together with the complete trade plan: Entry, Stop Loss, TP1 and TP2 . The concept is simple: wait for the signal, follow the levels, move the Stop Loss to Break Even after TP1, and trade with discipline. Learn UNIX Scalper Everything you need to learn and use the product is
Gann Made Easy   は、ミスター・ギャンの理論を使用した取引の最良の原則に基づいた、プロフェッショナルで使いやすい外国為替取引システムです。 W・D・ガン。このインジケーターは、ストップロスとテイクプロフィットレベルを含む正確な買いと売りのシグナルを提供します。 PUSH通知を利用して外出先でも取引可能です。 ご購入後、取引方法の説明と優れた追加インジケーターを無料で入手するには、私にご連絡ください! おそらく、ギャンの取引手法についてはすでに何度も聞いたことがあるでしょう。通常、ギャンの理論は初心者のトレーダーだけでなく、すでにある程度の取引経験がある人にとっても非常に複雑なものです。なぜなら、ギャンの取引手法は理論的にはそれほど簡単に適用できるものではないからです。私はその知識を磨き、最良の原則を私の外国為替インジケーターに組み込むために数年を費やしました。 このインジケーターは非常に簡単に適用できます。必要なのは、それをチャートに添付し、簡単な取引推奨事項に従うだけです。このインジケーターは常に市場分析の仕事を行い、取引の機会を探します。適切なエントリーポイントを検
UZFX {SSS} スキャルピング・スマートシグナル v5.0 MT5は、変動の激しい市場において正確かつリアルタイムのシグナルを求めるスキャルパー、デイトレーダー、スイングトレーダー向けに設計された、リペイントのない高性能な取引インジケーターです。(UZFX-LABS)によって開発されたこのインジケーターは、価格行動分析、トレンド確認、スマートフィルタリングを組み合わせることで、すべての通貨ペアおよび時間枠において、高確率の売買シグナル、警告シグナル、トレンド継続の機会を生成します。 トレードの判断に迷うのはもうやめましょう。明確さ、正確さ、そして規律ある市場執行を求めるトレーダーのために設計された、体系的なシグナルシステムに従い始めましょう。 間違いなく、MQL5で入手可能な最高のインジケーターの一つです。絶対に見逃さないでください!!「スマートなトレーダーのためのスマートシグナル」 最新バージョン5.0がリリースされました。価格は予告なく最大499.99ドルまで値上がりする可能性がありますので、チャンスを逃さないようお早めにお求めください!! 購入を決める前に!無料トライアル
この製品は 2026 年の市場向けに更新され、最新の MT5 ビルドに最適化されています。 価格更新のお知らせ: Atomic Analyst は現在 $99 で提供されています。 次の 30 件の購入 後、価格は $199 に上がります。 特別オファー: Atomic Analyst を購入後、私にプライベートメッセージを送ることで、 Smart Universal EA を無料 で受け取り、Atomic Analyst のシグナルを自動売買に変えることができます。 Atomic Analyst は、リペイントなし、再描画なし、遅延なしの Price Action トレーディングインジケーターで、手動取引、シグナルの明確化、EA 自動化のために設計されています。 User manual: settings, inputs and strategy.   &   User Manual PDF . 価格行動、強さ、モメンタム、マルチタイムフレーム方向、高度なフィルターを分析し、トレーダーがノイズを減らし、弱いセットアップを避け、より構造化された取引判断を行えるようにします。 このイ
伝説が帰ってきました:Entry Points Pro 10。 MQL5 Marketのトップ3に3年間入り続けた伝説的インジケーターの再始動です。 2つのバージョンで合計589件の高評価レビュー、毎日数千人のトレーダーが実際のトレードに使用し、デモのダウンロードは31,000件以上   MT4+MT5 。 私はこの5年間に寄せられたレビューをすべて読み、約束を並べる代わりに、その答えをバージョン10に組み込みました。1999年から相場に携わり、 誠実さ、自らの評判、そして顧客を大切にする 作者による製品です。 Entry Points Proのエントリーシグナルは、リペイント(再描画)を一切行いません。 そして今回初めて、これは作者の言葉ではなく検証可能な事実になりました。確定シグナルはローソク足の終値確定後にのみ表示され、自動テストで リペイントはゼロ と確認されています(EURUSD、XAUUSD、BTCUSDで2,486,568回の不変条件チェック、違反0件)。検証方法は公開されており、ストラテジーテスターでご自身で再現できます。 ご購入後は、必ずすぐにダイレクトメッセージでご
ATSTRONG PRO:市場構造&ブレイクアウトインジケーター ブレイクアウト検出エンジン | 5つの動的TPターゲット | ライブダッシュボードパネル | リペイントなし 導入価格 現在の価格: $59 — 10回の販売ごとに価格が$10上昇します。 ATSTRONG PRO は、MetaTrader 5 用に設計された高度なブレイクアウトおよび機関投資家向け市場構造インジケーターです。 高確率のスイングピボットを検出し、クラスター化されたサポートとレジスタンスの蓄積ゾーンを特定し、 リアルタイムで構造の破壊(BOS)と性質の変化(CHoCH)のシグナルを発します。 このインジケーターは、ダイナミックなストップロスと5つの個別のテイクプロフィットレベル(TP1〜TP5)をチャート上に自動的に直接描画します。 リスクリワード予測ボックス、星付けされたシグナル品質の評価、およびリアルタイムのオンチャートパフォーマンス分析ダッシュボードを備えています。 取引に関する注意: これは手動取引および市場分析用のインジケーターです。ローソク足の確定時に明確な視覚的シグナル、レベル、アラー
M1 SNIPER は使いやすいトレーディングインジケーターシステムです。M1時間足向けに設計された矢印インジケーターです。M1時間足でのスキャルピングのためのスタンドアロンシステムとして、また既存のトレーディングシステムの一部としても使用できます。このトレーディングシステムはM1時間足での取引に特化して設計されていますが、他の時間足でも使用できます。元々、この手法はXAUUSDとBTCUSDの取引用に設計しましたが、他の市場においても役立つと考えています。 インジケーターのシグナルは、トレンドの方向と逆方向に取引できます。インジケーターのシグナルを利用して両方向に取引するのに役立つ特別な取引テクニックをご紹介します。この手法は、特別な動的なサポートとレジスタンスの価格帯を利用することに基づいています。 ご購入後、M1 SNIPER矢印インジケーターをすぐにダウンロードできます。さらに、M1 SNIPERツールのすべてのユーザーに、以下のスクリーンショットに表示されているApollo Dynamic SRインジケーターを無料で提供しています。この2つのインジケーターを組み合わせることで
[User Manual]   ,   [Online Course]   ,   [PDF]  And [DEMO] Axiom Matrix は、MetaTrader 5 用のプロフェッショナルなマルチシンボル・マルチタイムフレーム市場スキャナー兼意思決定ダッシュボードです。 Market Watch をスキャンし、複数の時間足を分析し、複数のエビデンスエンジンを読み取り、最も強いチャンスを比較し、1つのクリーンなマトリックスダッシュボード内で最適な BUY、SELL、WAIT、またはブロック状態を表示します。 私が Axiom Matrix を作った理由は、市場スキャンという重い作業を代わりに行ってくれる1つのツールが欲しかったからです。 RSI だけを確認したくありませんでした。 次に MACD だけ。 次に移動平均線。 次に出来高。 次にボラティリティ。 次にサポートとレジスタンス。 そして、1つのトレードアイデアを作るためだけに、銘柄と時間足を手動で切り替えることもしたくありませんでした。 私は、市場をスキャンし、エビデンスを比較し、最良のチャンスをランク付けし、今最も強い
通貨強さウィザードは、取引を成功させるためのオールインワン ソリューションを提供する非常に強力な指標です。このインジケーターは、複数の時間枠のすべての通貨のデータを使用して、このまたはその外国為替ペアのパワーを計算します。このデータは、使いやすい通貨インデックスと通貨パワーラインの形式で表され、特定の通貨のパワーを確認するために使用できます。 必要なのは、取引したいチャートにインジケーターを接続することだけです。インジケーターは、取引する通貨の実際の強さを示します。このインジケーターは、トレンドに合わせて取引するときに有利に利用できる売買高の圧力の極値も示します。このインジケーターには、フィボナッチに基づく可能なターゲットも表示されます。 このインジケーターは、PUSH 通知を含むあらゆるタイプのアラートを提供します。 購入後ご連絡下さい。私の取引のヒントをあなたと共有し、素晴らしいボーナスインジケーターを無料で提供します! 幸せで有益な取引をお祈りします。
GEM Signal Pro GEM Signal Pro は、MetaTrader 5 向けのトレンドフォロー型インジケーターです。より明確なシグナル、より整理されたトレードセットアップ、そして実用的なリスク管理をチャート上で確認したいトレーダーのために設計されています。 単純な矢印だけを表示するのではなく、GEM Signal Pro はトレード全体の考え方を、より見やすく分かりやすい形で表示します。条件が確認されると、インジケーターはエントリー価格、ストップロス、利確目標をチャート上に表示し、トレードセットアップをより効率的に確認できるようにします。 動作の仕組み このインジケーターは、まず内部ロジックに基づいて有効なシードシグナルを検出します。 確認条件が満たされると、GEM Signal Pro はチャート上に完全なセットアップを表示します。これにより、トレーダーはトレード構造をより明確に把握し、手作業による分析を減らすことができます。 チャート上のトレードレベル 確認済みシグナルに対して、GEM Signal Pro は以下を表示できます。 エントリー価格 ストップロス テ
FiboSniper Pro – Multi-Filter Fibonacci System with Auto SL/TP and Control Panel FiboSniper Proは、動的なFibonacci Envelopesと複数の確認フィルターを組み合わせ、選別されたBuyおよびSellシグナルを生成するテクニカルインジケーターです。FibonacciレベルはMoving AverageとATRを基に計算され、その後ADX、EMA、RSI、ATR、Volume、Time、Candle構造によってフィルタリングされます。インジケーターは、ATRに基づく自動Stop LossおよびTake Profitレベルをチャート上に直接表示し、さらに迅速な調整が可能なインタラクティブControl Panelを提供します。 購入後、推奨設定ファイルと詳細な使用方法については、私にご連絡ください。 Auto Trader Xを使用してFiboSniper Proのシグナルを自動化できます: [Auto Trader X] User GuideとSet Files: [Click her
Scalper Vault は、スキャルピングを成功させるために必要なすべてを提供するプロフェッショナルなスキャルピング システムです。このインジケーターは、外国為替およびバイナリー オプションのトレーダーが使用できる完全な取引システムです。推奨される時間枠は M5 です。 システムは、トレンドの方向に正確な矢印シグナルを提供します。また、トップとボトムのシグナルとギャン マーケット レベルも提供します。 インジケーターは、プッシュ通知を含むすべてのタイプのアラートを提供します。 インジケータの購入後にご連絡ください。私の個人的な取引の推奨事項と素晴らしいボーナス指標を無料で共有します! 幸せで有益な取引をお祈りします!
Crystal Quantum Pro
Muhammad Jawad Shabir
5 (3)
CRYSTAL QUANTUM PRO Institutional Signal & Trade Intelligence for MetaTrader 5 Final Price: 199 USD ----> Price goes up 10 USD after every 10 sales. Limited launch slots available, act fast. Most indicators give you an arrow and leave you alone. A naked arrow is a gamble. Winning consistently requires CONFLUENCE , a clear STOP and TARGET , and honest PROOF that the system works. Crystal Quantum Pro delivers all three in one clean, no-repaint package. Crystal Quantum Pro is a complete decision sy
BlueDigitsFx エコシステム公式アクセス 公式 BlueDigitsFx エコシステムを通じて、インフラのアップデート、ワークフローリソース、製品リリース、エコシステムへのアクセスを入手できます。 Telegram エコシステム ウェブサイト BlueDigitsFx Precision Order Flow MT5 — MetaTrader 5 向け完全オーダーフロー分析スイート バリューエリア、Point of Control、オークションコンテキスト、構造化された意思決定サポートを組み合わせた、本格的な MT5 トレーダー向けのプロフェッショナルなセッションベース市場構造フレームワーク。 バリューの所在を特定する VAH、POC、VAL を自動的に監視する London と New York のセッション構造を理解する 構造化された市場コンテキストで意思決定の疲労を軽減する MetaTrader 5 トレーダー向けに特別設計 開発者からのメッセージ Precision Order Flow を開発したのは、MetaTrader 5 内でセッション構造をより明確に読み
この製品は 2026 年の市場向けに更新され、最新の MT5 ビルドに最適化されています。 価格更新のお知らせ: Smart Price Action Concepts は現在 $200 で提供されています。 次の 30 件の購入 後、価格は $299 に上がります。 特別オファー: 購入後、私にプライベートメッセージを送ることで、 無料ボーナス + ギフト を受け取ることができます。 まず、このトレーディングツールはリペイントなし、再描画なし、遅延なしのインジケーターであり、プロフェッショナルな取引に最適であることを強調しておきます。 [Online course] ,   [User Manual]  ,  [How to Install]  ,   [PDF] Smart Price Action Concepts Indicator は、初心者から経験豊富なトレーダーまで使える非常に強力なツールです。20 種類以上の便利なインジケーターを 1 つにまとめ、Inner Circle Trader Analysis や Smart Money Concepts Trading S
CRT Candle Range Theory HTF MT5.   Ultimate CRT Indicator: Advanced ICT Concepts and Malaysian SnR Trading System Master the Market Maker's Footprints with the Most Advanced Candle Range Theory Indicator Unlock the true power of  Smart Money Concepts (SMC)  and trade precisely like the institutions with the  Ultimate CRT Indicator . Built exclusively for serious traders, this indicator automates the highly effective  Candle Range Theory (CRT) , a core pillar of  ICT Concepts (Inner Circle Trader
このインジケーターを購入された方には、以下の特典を 無料 で提供しています: 各トレードを自動で管理し、ストップロスとテイクプロフィットを設定し、戦略ルールに基づいてポジションを決済する補助ツール 「Bomber Utility」 様々な銘柄に合わせたインジケーターの設定ファイル(セットファイル) 「最小リスク」、「バランスリスク」、「待機戦略」 の3つのモードで使用できる Bomber Utility 用の設定ファイル このトレーディング戦略をすぐに導入・設定・開始できる ステップバイステップのビデオマニュアル ご注意: 上記の特典を受け取るには、MQL5のプライベートメッセージシステムを通じて販売者にご連絡ください。 オリジナルのカスタムインジケーター 「Divergence Bomber(ダイバージェンス・ボンバー)」 をご紹介します。これは、MACDのダイバージェンス(乖離)戦略に基づいた 「オールインワン」型のトレーディングシステム です。 このテクニカルインジケーターの主な目的は、価格とMACDインジケーターの間に発生するダイバージェンスを検出 し、将来の価格の動きを示
Smc Pro ToolKit
Talal N Z Aljarusha
5 (12)
SMC PRO TOOLKIT — SMART MONEY ANALYSIS & STRUCTURED TRADE PLANNING SMC Pro ToolKit is a professional Smart Money Concepts analysis workspace for MetaTrader 5. It combines market structure, multi-timeframe analysis, institutional price zones, setup evaluation, confirmation tools, volume context, alerts, and risk planning inside one organized chart environment. One workspace. Multiple layers of confirmation. One structured trading plan. OPEN COMPLETE USER GUIDE MULTI-CONDITION SETUP ENGINE At
Power Candles V3 - 自己最適化型強弱インジケーター Power Candles V3は 、通貨や銘柄の強さを、適用されたすべてのチャート上で実行可能なトレードプランに変換します。単にローソク足を色分けするだけでなく、バックグラウンドでリアルタイムの自動最適化を実行し、目の前の銘柄に対して最適なストップロス、テイクプロフィット、およびシグナルの閾値を提示します。ワンクリックで実取引に適用でき、エントリーポイント、ストップロス、テイクプロフィットのラインが正確な価格位置にチャート上に表示され、方向性を示すアラートがリアルタイムで発動します。 このツールは、Stein Investmentsのエコシステムの一部です。  18種類以上のツールをすべて閲覧し、AIを活用したセットアップの推奨事項を入手し、  https://stein.investments でコミュニティに参加しましょう クローズしたバーごとに3,000回以上のトレードシミュレーション。9つの強さの状態。2つの戦略を並行してテスト。勝率の高い設定をワンクリックで適用。 なぜこれが必要なのか ほとんどの強
FX Power: 通貨の強弱を分析して、より賢い取引を実現 概要 FX Power は主要通貨と金の実際の強弱をあらゆる市場状況で理解するための必須ツールです。強い通貨を買い、弱い通貨を売ることで、 FX Power は取引の意思決定を簡素化し、高い確率の取引機会を見出します。トレンドを追従する場合でも、極端なデルタ値を使用して反転を予測する場合でも、このツールはあなたの取引スタイルに完全に適応します。ただ取引するだけではなく、 FX Power で賢く取引をしましょう。 1. なぜ FX Power がトレーダーにとって非常に有益なのか 通貨と金のリアルタイム強弱分析 • FX Power は主要通貨と金の相対的な強弱を計算し、マーケットダイナミクスに関する明確な洞察を提供します。 • どの資産がリードしているか、または後れを取っているかを監視して、取引するペアを賢く選びましょう。 マルチタイムフレームの包括的なビュー • 短期、中期、長期のタイムフレームで通貨と金の強弱を追跡し、マーケットトレンドに基づいて取引戦略を調整できます。 • スキャルピングからスイングトレード
FX Trend NG:次世代マルチマーケット・トレンドインテリジェンス 概要 FX Trend NG は、複数の時間足に対応したプロフェッショナル向けトレンド分析およびマーケット監視ツールです。 市場全体の構造を数秒で把握することができます。 複数のチャートを切り替える必要はありません。どの銘柄がトレンド中なのか、どこでモメンタムが弱まっているのか、そしてどの時間足で強い整合性があるのかを瞬時に確認できます。 ローンチ特別オファー – FX Trend NG を $30(6ヶ月) または $80 永久ライセンス でご利用いただけます。 すでに Stein Investments のユーザーですか? -> メッセージを送信 して、プライベートグループへアクセスしてください。 セットアップや詳細情報が必要ですか? -> Stein Investments 公式ページ をご覧ください。 1. FX Trend NG が他と異なる理由 3ステート・トレンドロジック ― Buy と Sell だけではない • 多くのインジケーターは Buy または Sell の2状態のみを表示します。
作者のその他のプロダクト
Session Volume Profile (Daily) This indicator draws a daily Session Volume Profile directly on your chart. For each trading day it builds a horizontal volume histogram and marks the three key levels traders watch: the Point of Control (POC) , the Value Area High (VAH) and the Value Area Low (VAL) . The profile resets automatically at the start of every new day, and you can choose how many previous days to display alongside the current one. Key Features POC, VAH and VAL plotted and labelled for e
FREE
A fully automated double-side grid and hedge Expert Advisor for gold (XAUUSD) on MetaTrader 5. OVERVIEW Gold DoubleSide Grid EA trades both directions on the same symbol at the same time. It opens paired buy and sell positions, adds to the grid by Distance steps as price moves, scales lot size with a martingale multiplier, and aims to close each cycle in profit using a trailing profit lock. An automatic session filter learns the broker's daily market break from tick data, so the EA pauses around
QuickTrade - One-Click Trading Panel QuickTrade is a manual trading panel that places orders with a single click and sizes the lot automatically from a fixed money-per-trade amount. Instead of typing a lot size, you type how much money you want to put at risk, and QuickTrade calculates the correct lot from your chosen Stop Loss distance. Every order is sent with its Stop Loss and Take Profit already attached. Key Features One-click SELL / BUY - large buttons that also show the live Bid/Ask price
FREE
CustomRange VolumeProfile This indicator builds a Volume Profile for any part of the chart you want to study . Instead of resetting per day, you choose the range - either by dragging two vertical lines yourself, or by letting the indicator snap the range to a ZigZag swing leg automatically . It then draws the horizontal volume histogram together with the three key levels: the Point of Control (POC) , the Value Area High (VAH) and the Value Area Low (VAL) . Two Ways To Set The Range MANUAL - two
FVG Zones MTF This indicator detects Fair Value Gaps (FVG) and draws them as zones on your chart, from up to three timeframes at the same time - the chart timeframe plus two higher timeframes of your choice. Each timeframe set has its own colours and label, so you always know which timeframe a zone came from. Key Features Detects bullish and bearish FVG zones on the current timeframe plus two higher timeframes , all shown on one chart. Small control panel on the chart with one button per timefra
Triple MA Trend Alignment This indicator draws three moving averages on one chart and colours them by their alignment , so the state of the trend can be read at a glance instead of comparing the lines by eye. The default setup is EMA 9, EMA 34 and EMA 100, and every period, method, applied price, colour and line width can be changed. How The Colours Work The three lines are coloured by two independent rules. Fast and Mid always share one colour, decided by the fast line: above the mid line they
フィルタ:
レビューなし
レビューに返信