Multi Session VWAP with Deviation Bands

Multi Session VWAP with Deviation Bands

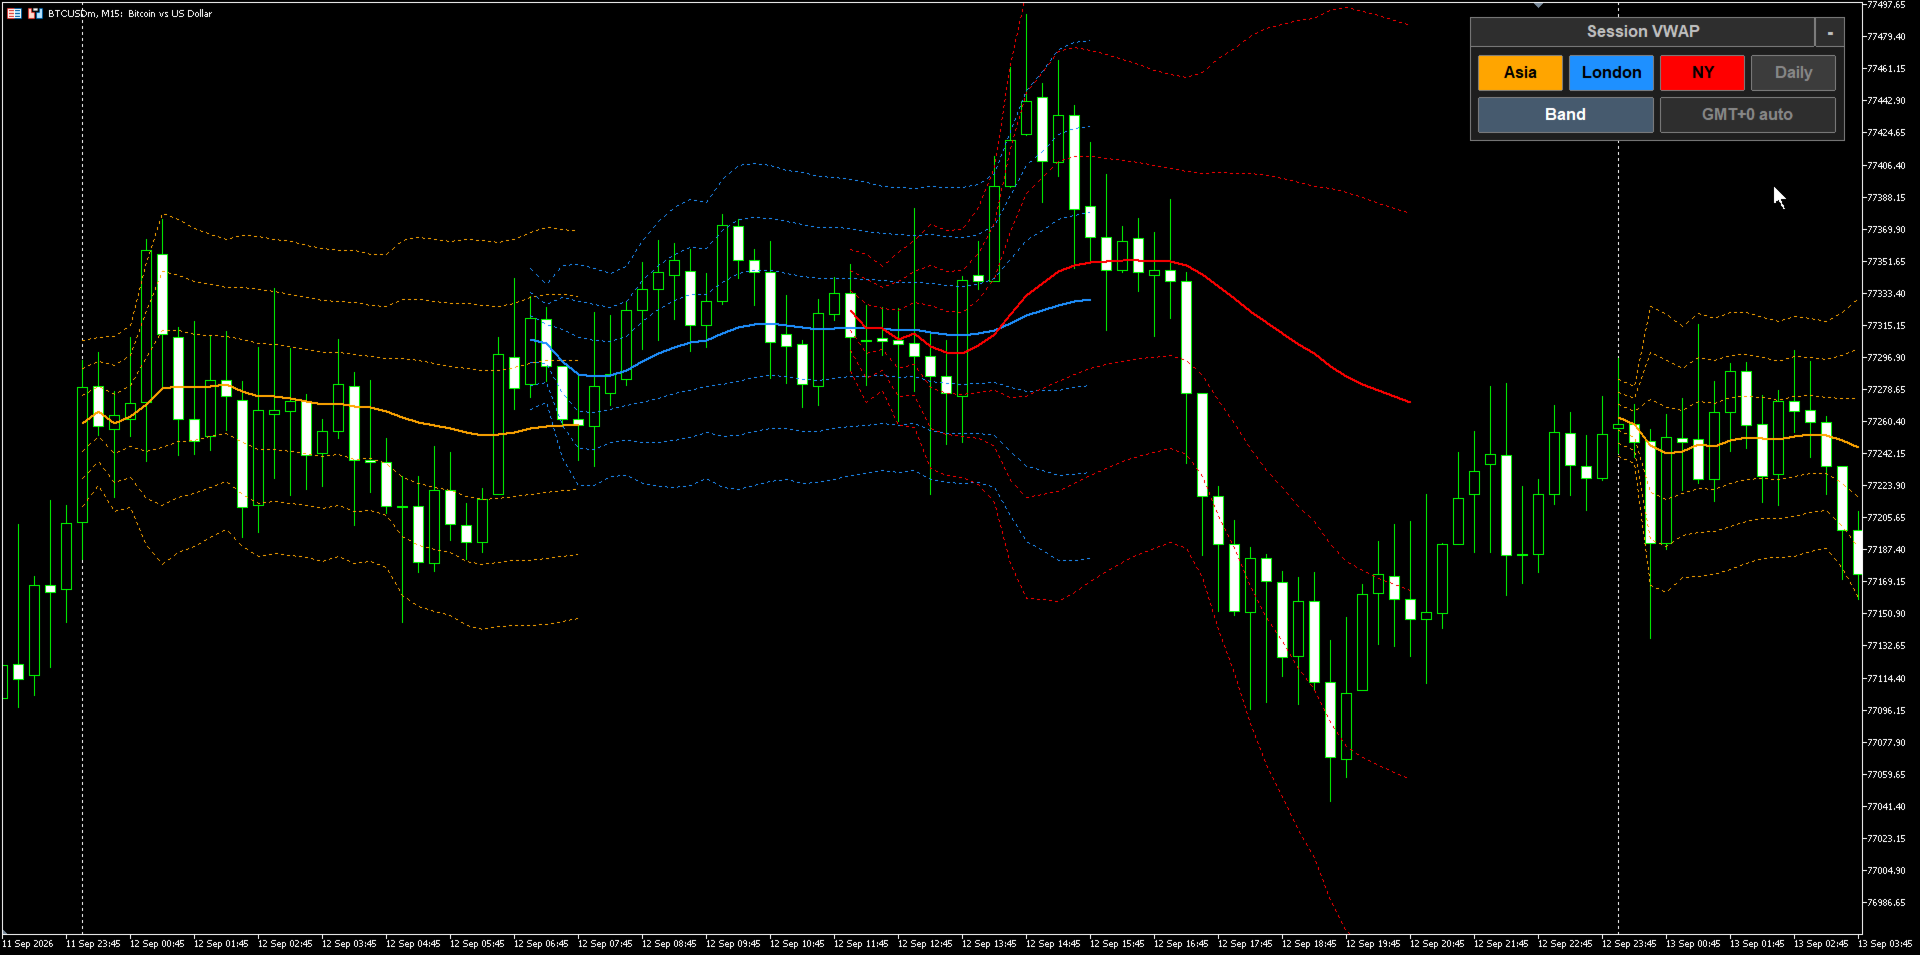
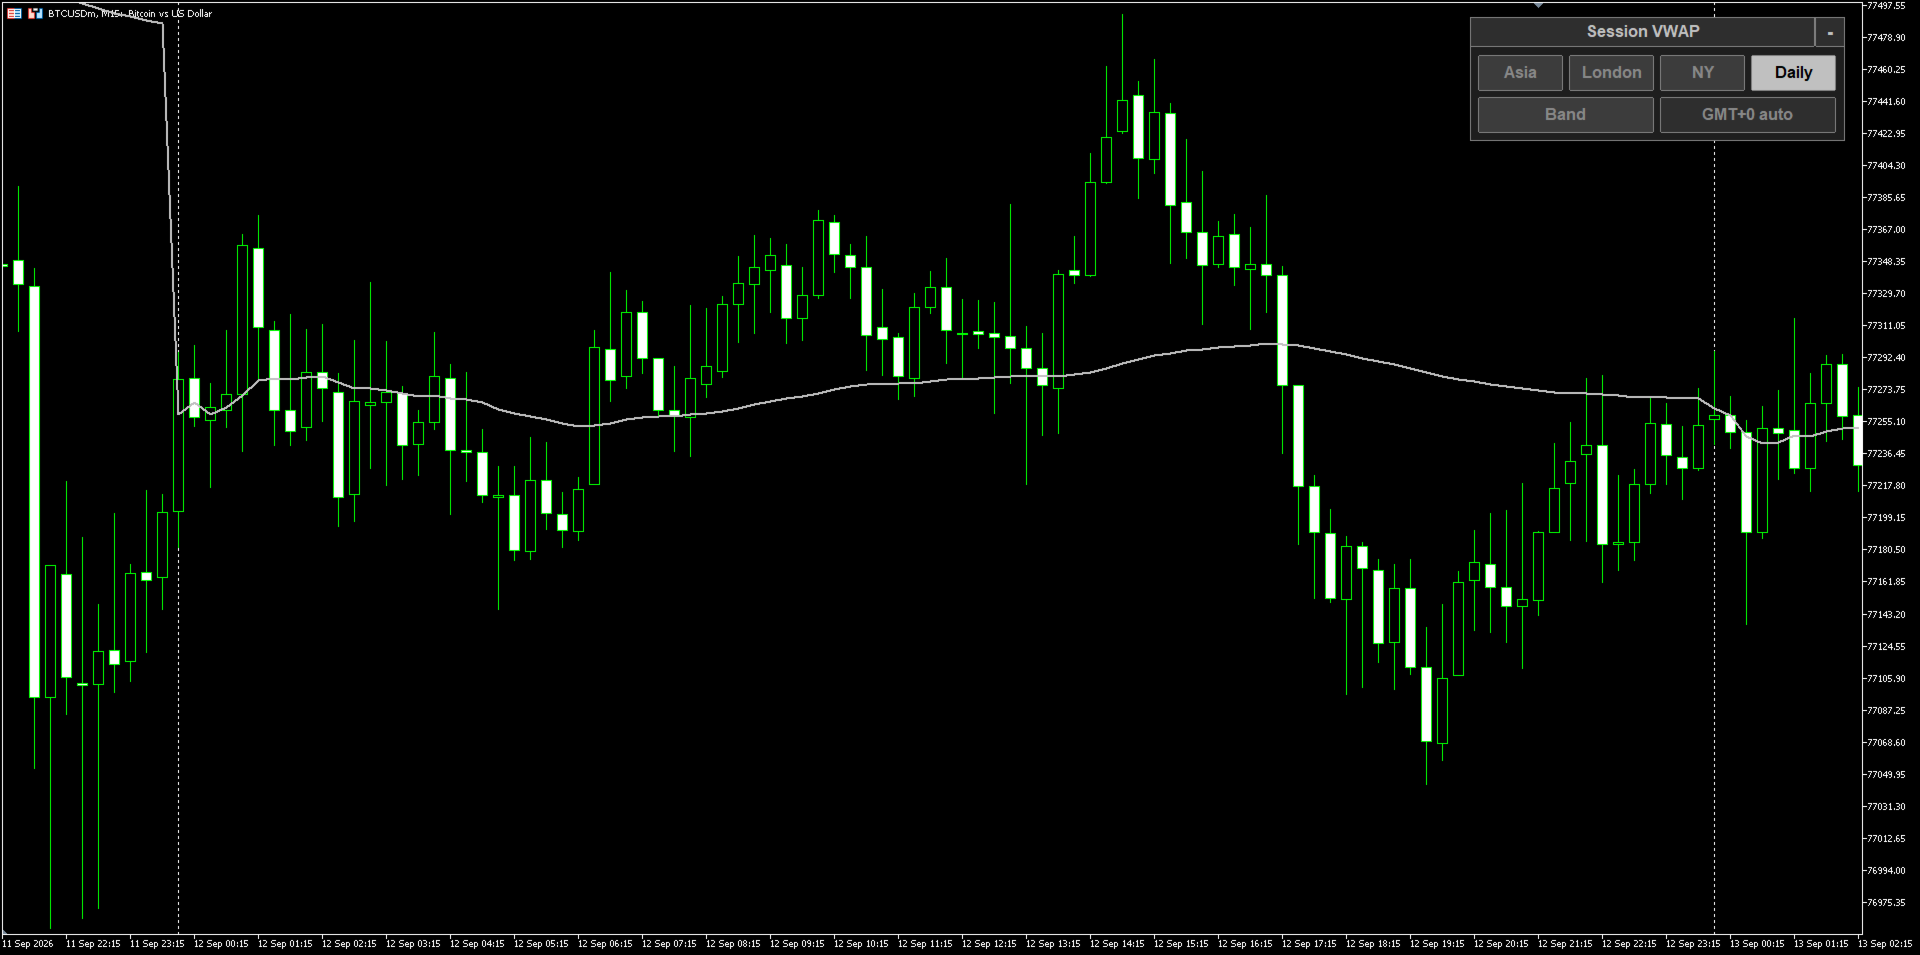
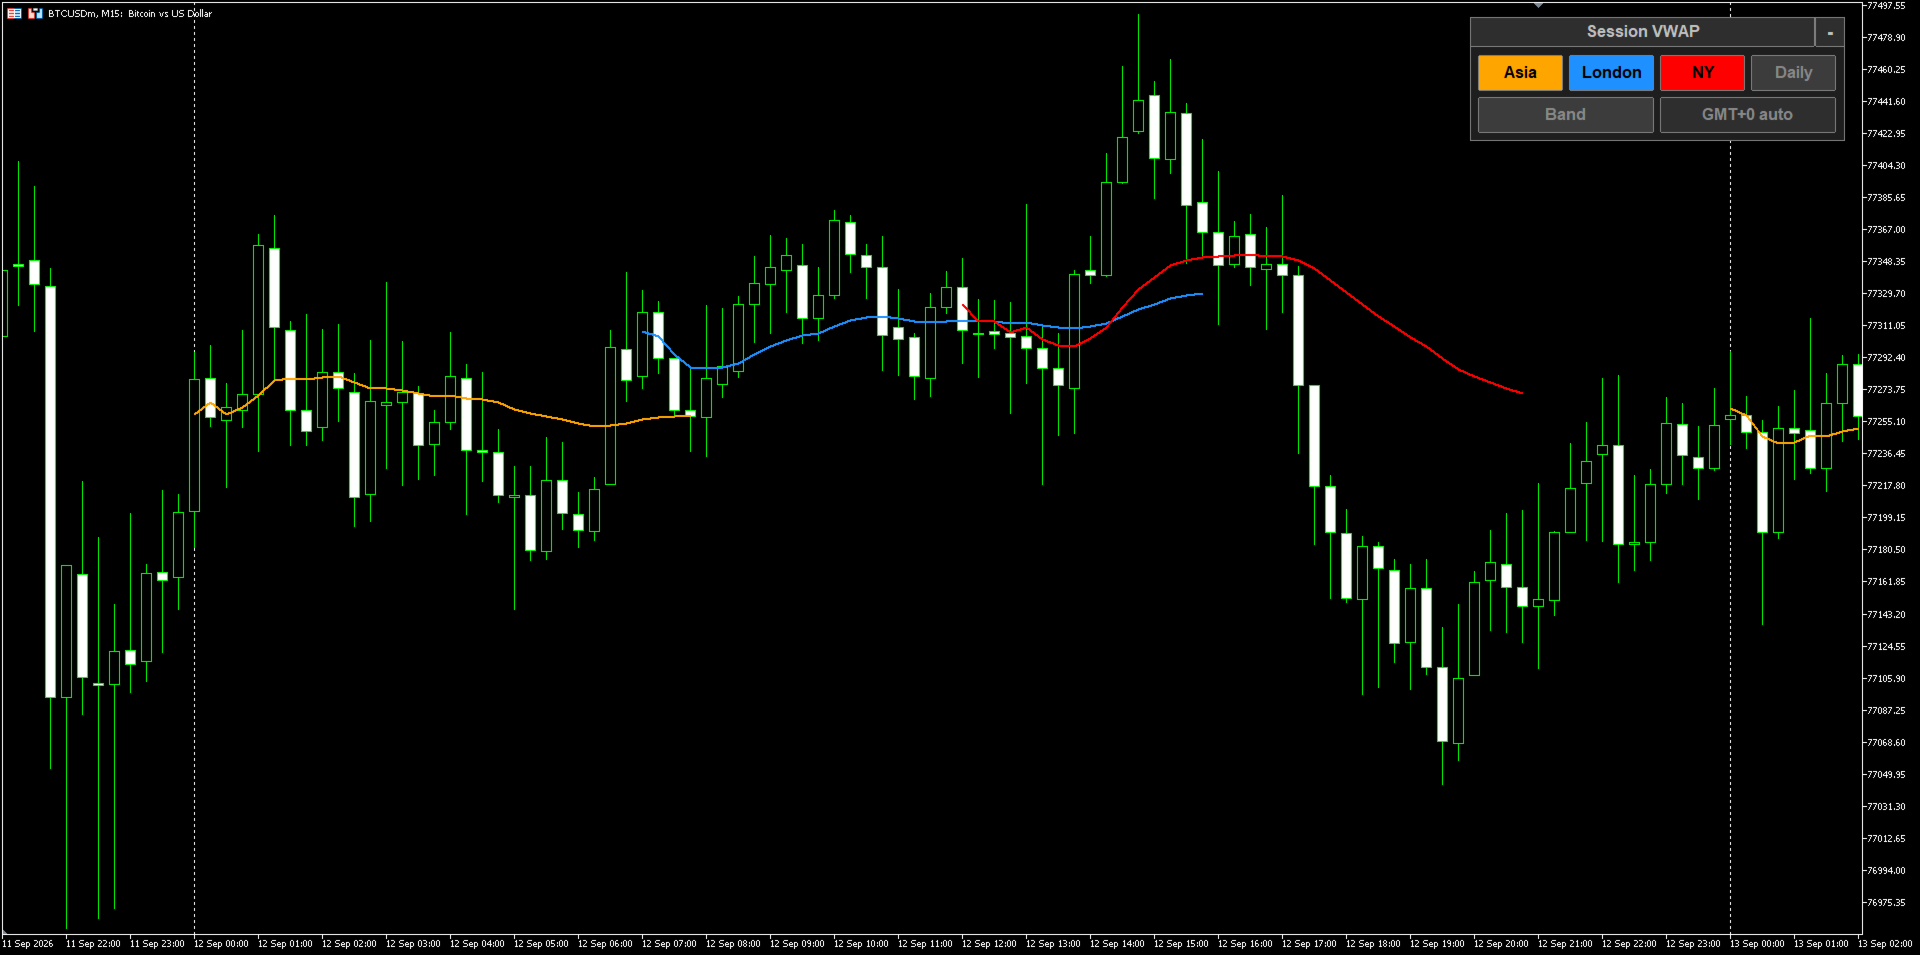
Four volume weighted average price lines in one indicator, each anchored to a different point in the trading day: the Asian session, the London session, the New York session and the daily open. Every anchor can be shown or hidden with one click on the chart, and each one carries its own set of standard deviation bands.

Session times are defined in UTC, not in broker time

Sessions are entered as UTC hours, and the indicator works out the broker server offset on its own by comparing server time with GMT. The detected offset is shown on the control panel, for example GMT+3 auto, and one click re-checks it. If a server reports an unusual time, the offset can be entered by hand instead. This means the same settings give the same session boundaries on every broker, without editing the hours for each server.

Key Features

  • Four anchors in one indicator: Asia, London, New York and Daily, shown together or one at a time.
  • Small control panel on the chart with one button per anchor plus a Band button - switch any line on or off without opening the settings.
  • The panel can be dragged anywhere, minimized to a small bar, and its position and button states are kept when you switch timeframe.
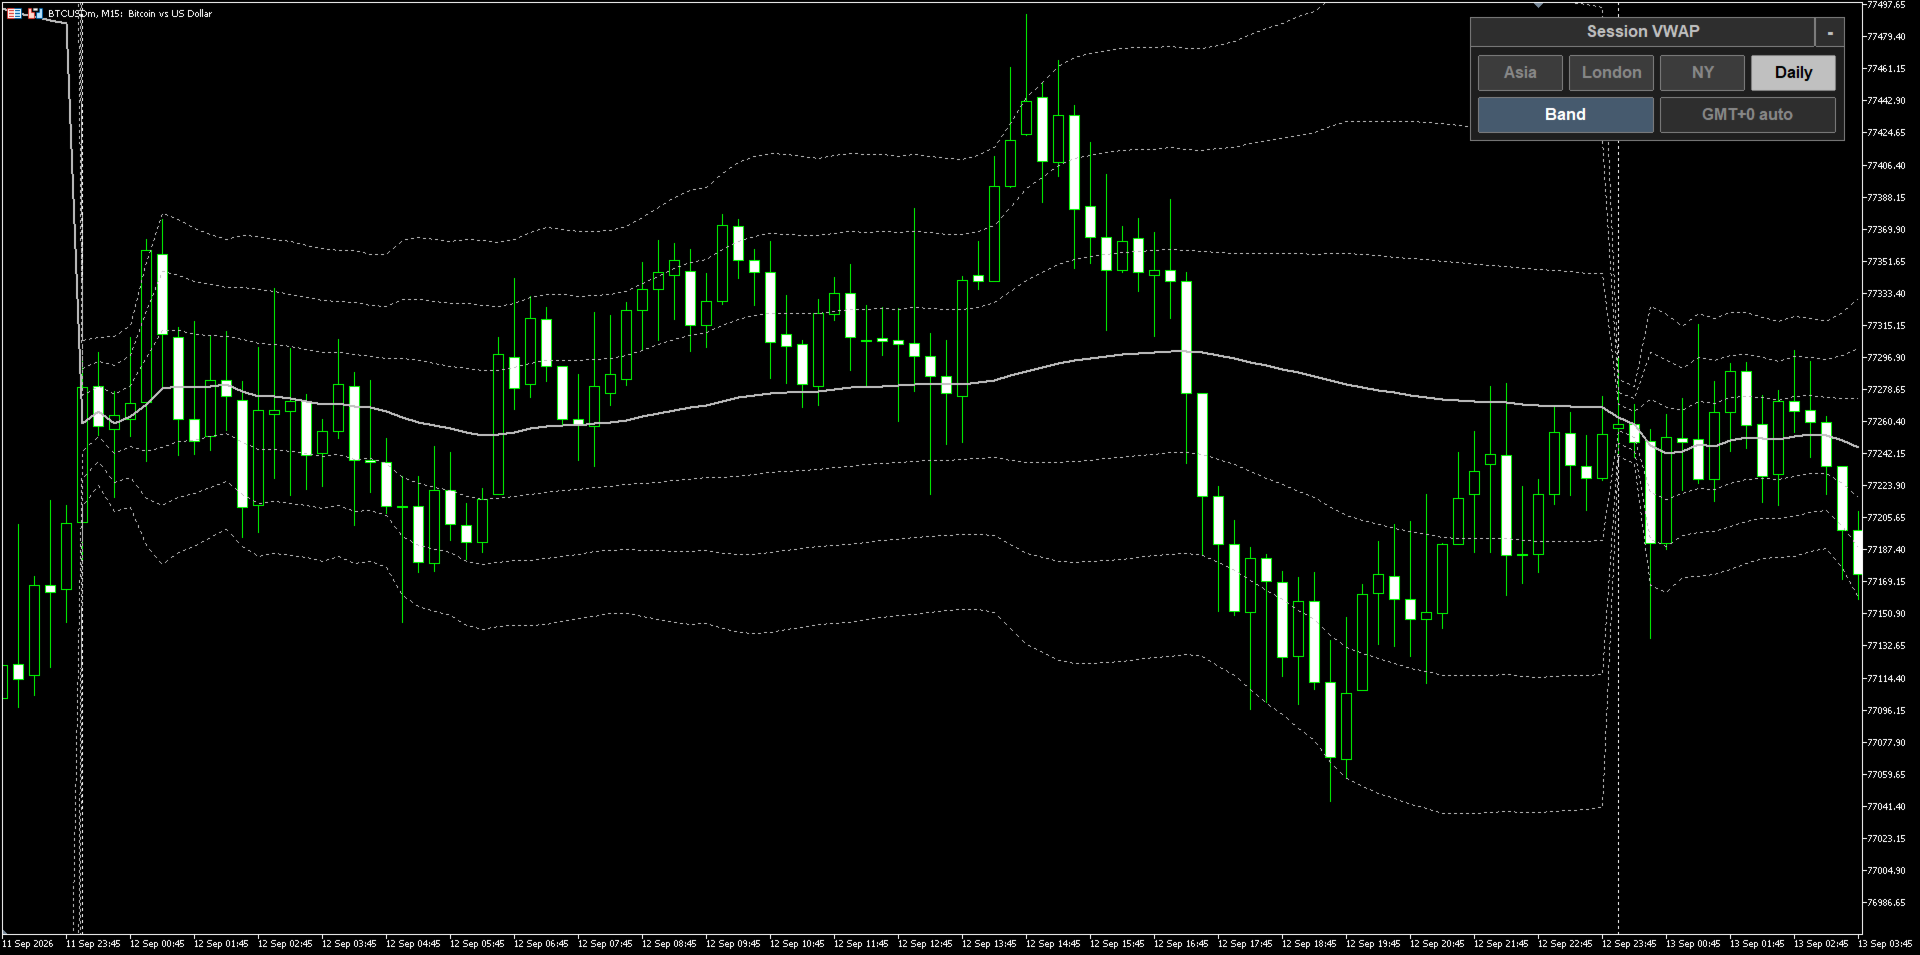
  • Standard deviation bands, up to three per side, with an adjustable multiplier for each level.
  • Session hours are set in UTC and the broker offset is detected automatically, with a manual override for unusual servers.
  • Sessions that run across midnight are handled, so the Asian session can be defined however your plan requires.
  • The VWAP is computed on a lower timeframe of your choice (one minute by default) and mapped onto the chart bars, so the value stays close to the true session average even on a higher chart timeframe.
  • The line for the session in progress updates on every tick, not only when a new bar opens.
  • Past sessions can be shown for a chosen number of days back, for reviewing how price behaved around earlier session VWAPs.
  • Weighting by tick volume or by real volume, whichever your symbol provides.
  • Every line appears in the Data Window with its own name, and a small tag marks each line on the chart.
  • Works on any symbol and any timeframe.

How It Works

For every bar of the calculation timeframe the indicator takes the typical price, that is the high plus the low plus the close divided by three, and weights it by the volume of that bar. Inside a session it keeps a running sum of price times volume and a running sum of volume; the VWAP at any point is the first sum divided by the second, so the line is the average price actually traded since the anchor rather than a simple moving average. The deviation bands come from the volume weighted variance of the same prices, so they open wide right after the anchor, when only a few bars have been counted, and tighten as the session fills out. Each anchor keeps its own running sums and resets when its session starts again, and the daily anchor resets once a day at the hour you choose.

Input Parameters

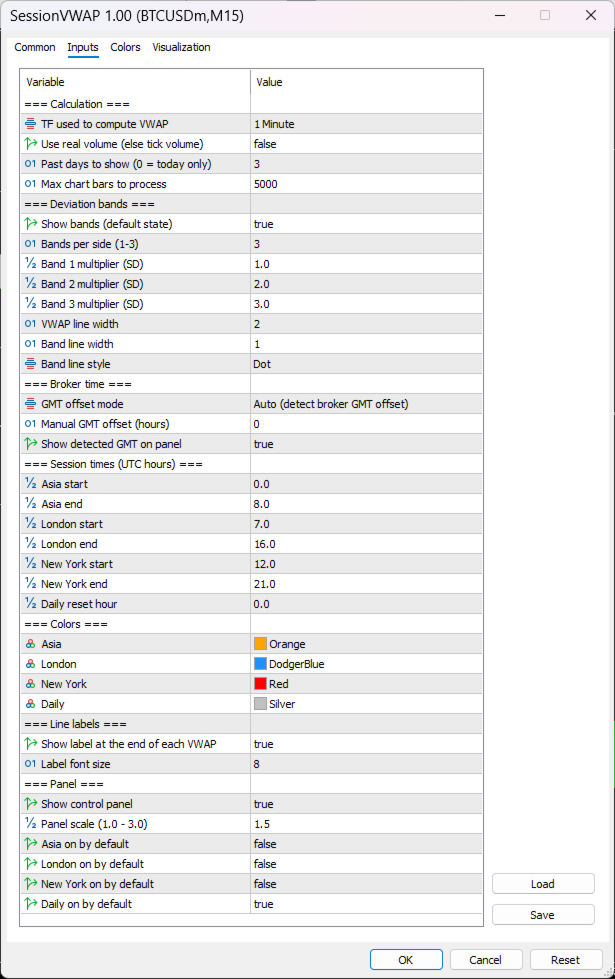
Calculation

  • TF used to compute VWAP - the lower timeframe the sums are built from, one minute by default. A timeframe above the chart timeframe falls back to the chart timeframe.
  • Use real volume - weight by real volume instead of tick volume.
  • Past days to show - how many earlier days of session lines to draw. Zero draws today only.
  • Max chart bars to process - upper limit on the number of chart bars scanned.

Deviation bands

  • Show bands - the state the Band button starts in.
  • Bands per side - one, two or three levels above and below the VWAP.
  • Band 1 / 2 / 3 multiplier - how many standard deviations each level sits at.
  • VWAP line width, Band line width and Band line style.

Broker time

  • GMT offset mode - detect the broker offset automatically, or set it by hand.
  • Manual GMT offset - the offset in hours used in manual mode.
  • Show detected GMT on panel - show the offset button on the control panel.

Session times, in UTC hours

  • Asia start / end - zero to eight by default.
  • London start / end - seven to sixteen by default.
  • New York start / end - twelve to twenty one by default.
  • Daily reset hour - the hour the daily anchor starts again, midnight UTC by default.

Colours

  • One colour per anchor - Asia, London, New York and Daily. The bands follow the colour of their own session and are drawn thinner and dotted.

Line labels

  • Show label at the end of each VWAP and Label font size.

Panel

  • Show control panel and Panel scale for high resolution screens.
  • Asia / London / New York / Daily on by default - which anchors are active when the indicator is first attached.

Notes

  • The automatic offset is read from the terminal clock. In the Strategy Tester that clock is less reliable than on a live chart, so use the manual mode there if the session boundaries look shifted.
  • This is a visual analysis tool. It does not send trading signals and does not open orders.
Produits recommandés
Découvrez RSIScalperPro - un indicateur innovant basé sur le RSI pour MetaTrader 5, optimisé pour le scalping sur des graphiques d'une minute ! Avec RSIScalperPro, vous aurez entre vos mains un puissant outil vous fournissant des signaux d'entrée et de sortie précis. RSIScalperPro utilise deux indicateurs RSI différents pour fournir des signaux clairs pour les niveaux de surachat et de survente. Vous pouvez ajuster les périodes et les valeurs limites des deux RSI selon votre stratégie de tradin
The  OBV MTF  is an Enterprise-grade On-Balance Volume indicator that transforms standard OBV into a complete trading system. It combines gradient-aware momentum analysis, divergence detection, multi-timeframe alignment, and dynamic customisable midpoint-filtering in a single intuitive professional volume analysis tool. Core Features 1. 5-State Momentum Engine Aqua (Strong Bullish) : OBV slope rising with positive acceleration SteelBlue (Weak Bullish) : OBV rising but losing momentum Gray (Neutr
StructureLens - Smart Money Concepts for MT5: Market Structure, Order Blocks, Fair Value Gaps, Liquidity StructureLens draws the market structure the way Smart Money traders read it, on any symbol and timeframe. Everything is calculated on closed candles: once a label is drawn it never changes. Market structure - Swing points HH, HL, LH and LL. A swing is confirmed only after "Swing length" candles on each side (default 10), so it never repaints. - BOS (break of structure, solid line) when pr
Vwap Bands Auto
Ricardo Almeida Branco
The Vwap Bands Auto indicator seeks to automatically map the maximum market frequency ( automatic update of the outermost band ) and has two intermediate bands that also adjust to daily volatility. Another tool from White Trader that combines price and volume, in addition to mapping the daily amplitude. The external band is updated automatically when the daily maximum or minimum breaks the current frequency, and can be an input signal, seeking a return to the daily vwap. Thus, in addition t
Indicateur de Contraction-Expansion (Contraction Expansion Meter) Un indicateur de volatilité clair et puissant qui visualise en temps réel la contraction et l’expansion du marché. Basé sur la logique des Bandes de Bollinger, l’indicateur mesure la largeur relative des bandes et la compare à sa propre moyenne mobile. Cela crée un oscillateur très intuitif qui montre quand le marché se compresse (contraction / squeeze) ou s’étend (rupture de volatilité). Ce que vous voyez sur le graphique : Histo
SMC Vision
Kriangkrai Pongtiwat
SMC ProVision 2.0 — Professional Smart Money Concept Analysis Stop guessing. Start reading the market like institutions do. SMC ProVision maps the full smart money footprint directly on your chart — with a clean, minimal design that won't clutter your screen. Market Structure — BOS / CHoCH with HH・HL・LH・LL labels Order Blocks — Standard & Refined with mitigation tracking Breaker Blocks — Auto-converted from mitigated OBs Fair Value Gaps — Fill percentage & mitigation status Liquidity —
FREE
CorrelationRadarPRO
Gabriel Balbino De Oliveira
Correlation Radar PRO — Multi-Asset Correlation Dashboard for MetaTrader 5 Short Description: Eliminate market noise and spot price divergences in seconds. Correlation Radar PRO calculates historical, monthly, weekly, and real-time correlations across multiple assets and lets you overlay candles directly on your chart without switching your main symbol. Full Description: Manually switching charts to understand inter-market relationships wastes precious time and leads to missed setups. Correlatio
Anchored VWAP Trading Indicator Struggling to identify true market value and key support/resistance levels? The Anchored VWAP Trading Indicator helps you track price based on real traded volume, giving you a clear edge in your trading decisions. This tool allows you to anchor VWAP from any point on the chart, making it ideal for analyzing trends, reversals, and institutional activity. Key Features Anchored VWAP from any candle Accurate volume-weighted price calculation Works on all symbol
Market Structure Evaluator MTF Market Structure Evaluator MTF is an institutional-grade price action indicator designed for Smart Money Concepts (SMC) and Market Structure traders. It automatically tracks Market Structure Breaks ( BOS ) and Change of Character ( CHOCH ) in real-time across multiple timeframes, giving you a complete macro-to-micro view of market trend alignment without cluttering your charts or having to analyse other timeframes. Whether you trade manually or build automated tr
ShortBS是一个很好的短线交易指示器,能很好与 BestPointOfInitiation ( https://www.mql5.com/zh/market/product/96671 )配合,能让你找到最合适的buy和sell位置,指标不含有未来函数,不会重新绘制。是一个针对(如果你感觉到这个指标能够帮助你进行更准确的交易,请帮忙给个好评,希望我的作品能够帮助更多有需要的人) ===================参数列表===================== maPeriod: 25 slowPeriod:20 fastPeriod:10 stepPeriod:5 =================参考使用方法=================== 此指标可以适用于任何交易品种,能够用在任何周期。
Orderflow Footprint
Panthita Aichoi
4 (1)
Asa Orderflow Footprint v3 — Description du produit Aperçu Asa Orderflow Footprint est un indicateur professionnel de graphiques footprint pour MetaTrader 5 qui affiche en temps réel le volume Bid/Ask (ou le nombre de ticks) à chaque niveau de prix à l'intérieur de chaque bougie. Conçu pour les traders de flux d'ordres (order flow) sérieux, il va bien au-delà d'un footprint basique en ajoutant l'analyse de la migration du POC, un tableau de bord d'order flow accessible en un coup d'œil, la dét
DMJ Magical AVWAP
Dominic Minguy Jean
Automated Anchored Volume Weighted Average Price You set a period, and the indicator will find the highest and lowest price point in the period and derive a AVWAP from there. It also prints out a median line. You can use the generated VWAP lines as a channel, as S/R levels or as a volatility indicator. It's based on tick volume to be compatible with most CFD brokers. Happy trading!
Institutional Structure Pro est un indicateur pour MetaTrader 5 axé sur la structure du marché, les Order Blocks, les Fair Value Gaps et la confluence multi-timeframe. Institutional Structure Pro a été développé pour aider les traders à lire la structure du marché avec plus de clarté. L’indicateur utilise des concepts d’analyse institutionnelle du prix tels que BOS, CHoCH, Order Blocks, Fair Value Gaps, zones Premium et Discount, Equal Highs et Equal Lows, divergence RSI, contexte de tendance a
ICT Institutional Zones Pro
Celestine Anyango Wabomba
ICT Institutional Zones Pro — Trade with Institutional Precision Stop wasting time manually drawing key ICT levels every day. ICT Institutional Zones Pro is a professional-grade MT5 indicator built for traders who use ICT (Inner Circle Trader) and Smart Money Concepts (SMC) to read market structure with precision. This indicator automatically maps the most important institutional levels directly on your chart, helping you instantly identify where smart money is likely accumulating, distributing
This Indicator adding power to traditional zigzag indicator. With High-Low numbers in vision it will be easier to estimate change of trend by knowing the depth of each wave. Information including points, pips, percentage%, and #bars can be displayed based on configuration. All information is real-time update. This indicator is especially useful in sideway market to buy low sell high.
Product Title:   IQ VWAP Oscillator Candles Full Version Stop Trading Blindly – Align with Institutional Volume and Momentum Right on Your Chart! Are you struggling to combine trend direction, momentum, and institutional volume into one single strategy? Most retail traders fail because they look at separate sub-window oscillators while ignoring where the "Big Boys" are actively placing their money. The   IQ VWAP Oscillator Candles   engine solves this problem permanently. It takes high-speed
KT Volatility Oscillator MT5
KEENBASE SOFTWARE SOLUTIONS
L'oscillateur de volatilité KT analyse les données de marché passées et actuelles à l'aide d'une formule mathématique pour afficher le résultat sous forme d'oscillateur. Les vagues croissantes et décroissantes correspondent respectivement à une volatilité élevée et faible de l'actif.  En résumé, la volatilité est simplement une mesure des fluctuations du prix d'un actif sur une certaine période de temps. Sans volatilité, il y aurait peu de mouvement sur le marché et les traders ne pourraient pas
Phoenix Trend Strength Suite
PHOENIX GLOBAL INVESTMENTS LTD
Les tendances évoluent rarement de la même manière sur toutes les périodes. Un graphique M15 haussier peut simplement correspondre à un repli au sein d’une tendance baissière sur H4, et négocier sur la base d’une vision à court terme sans tenir compte du contexte global, c’est ce qui transforme des points d’entrée apparemment intéressants en opérations allant à l’encontre de la tendance réelle. Phoenix Trend Strength Suite analyse simultanément la direction et la qualité de la tendance sur cinq
Mtf Rsi Fusion
Hadi Pourkerman
5 (1)
MTF RSI Fusion est un oscillateur pour MetaTrader 5 qui combine un indice de force relative (RSI) de base avec deux sources RSI facultatives au maximum. Chaque source possède une unité de temps, une période et un prix appliqué configurables. Les sources supplémentaires ont leurs propres poids et modes de combinaison. Il affiche la ligne Fusion RSI, une coloration de tendance facultative et des zones adaptatives de surachat et de survente fondées sur l’amplitude vraie moyenne (ATR). Le biais peut
Trix TURBO
Anderson De Assis
3 Indicateurs unissant leurs forces ! Le Trix TURBO est un indicateur, de la famille des oscillateurs, personnalisé pour MetaTrader 5 qui combine l'oscillateur Triple Exponential Moving Average (TRIX) avec le Parabolic SAR (SAR) pour une coloration dynamique et une Moyenne Mobile (MA) simple pour le lissage. Cet outil offre une représentation visuelle du momentum et de la direction de la tendance dans une fenêtre séparée. La ligne (ou histogramme) du TRIX est colorée en fonction de la position d
VWAP Indicator MT5
Kyra Nickaline Watson-gordon
Description : VWAP (Volume-Weighted Average Price) is the ratio of the value traded to total volume traded over a particular time horizon. It is a measure of the average price at which pair is traded over the trading horizon. Read More. All Symbols and All Timeframes are supported. Indicator Inputs :     VWAP Mode : Mode of VWAP Calculation. Options can be selected : Single,Session,Daily,Weekly,Monthly     Volumes : Real Volumes,Tick Volumes     Price Type : Used price for calculating. O
CRV Z-Score Engine is a professional market structure indicator that transforms raw price into normalized,  multi-horizon statistical structure model   It reveals: When price is statistically stretched When the market is transitioning between regimes When a move is structurally aligned across multiple horizons This is not a lagging oscillator . It is a multi-horizon statistical structure model built for serious traders. WHAT IS Z-SCORE? Z-Score measures how far price deviates from its n
L'indicateur aide à entrer dans un commerce en suivant la tendance, en même temps, après une certaine correction. Il trouve de forts mouvements de tendance d'une paire de devises sur un nombre donné de barres, et trouve également des niveaux de correction à cette tendance. Si la tendance est suffisamment forte et que la correction devient égale à celle spécifiée dans les paramètres, l'indicateur le signale. Vous pouvez définir différentes valeurs de correction, les valeurs de 38, 50 et 62 (nive
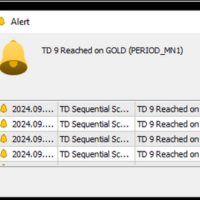
If you are unsure how to use this indicator, please feel free to reach out to me. I will explain it to you and provide reading materials to help you make the most of it. TD Sequential Scanner: An Overview The TD Sequential scanner is a powerful technical analysis tool designed to identify potential price exhaustion points and trend reversals in financial markets. Developed by Tom DeMark, this method is widely used by traders to gauge market cycles and potential turning points with precision. Ho
MFOP Market Forecast
Oscar Josue Pin Bacuzoy
Develop this indicator for periods of 30 minutes or more, focus on getting market trends right and making sure they are met. MFOP v8.1 gets straight to the point: it scans the market and tells you exactly when there is enough strength to enter a trade. This indicator doesn't do magic, it uses mathematical algorithms to filter out market noise, not enter into false breakouts and show you clear BUY (blue arrow) and SELL (red arrow) opportunities. It is designed and optimized specifically to take
Появилось желание торговать  движение, пробой на самой  высокой волатильности, или запустить советника-усреднителя торговать боковик в тихой низковолатильной гавани тогда этот продукт для Вас! Индикатор анализирует 28 валютных пар (основные и кроссы) и в зависимости от выбранных настроек покажет самые высоковолатильные (max) или наоборот (min).       Как измерить волатильность? Существует 2 способа. Первый это измерить  рендж заданного количества последних баров (bar). Второй замерить о
Monster Breakout Index V2 is a clean, visual momentum indicator engineered to spot potential breakout opportunities by evaluating extreme price extensions against median historical range channels. Overview The indicator continuously monitors the median price across a configurable lookback window and compares it against current high and low extremes. When price expansion breaks out of the established median bounds, MBI V2 immediately plots distinct histogram bars in a separate window, allowing tr
Utilities
Douglas Lucio De Araujo
Indicator with 3 features - Clock : Clock independent of the chart, counting continues even when the market is closed. - Template : After setting up a configuration in any graphic, be it color patterns, indicators, zoom ... The configuration will be copied to all active graphics. - TimeFrame : Set the TimeFrame on a chart, and with just one click all the active charts will be changed to the same TimeFrame.
Institutional Tick Engine Pro: Analyse de Vélocité des Ticks & Carte Thermique Institutional Tick Engine Pro est une suite d'analyse technique conçue pour traiter les données Tick brutes. Elle synthétise les métriques de flux d'ordres, y compris la vélocité, les cartes thermiques et les modèles de microstructure. Caractéristiques Principales 1. Moniteur de Vélocité des Ticks Mesure la vitesse du marché (Ticks Par Seconde) pour analyser l'agressivité des mouvements de prix. 2. Carte Thermique de
Les acheteurs de ce produit ont également acheté
Trend Sniper X
Sarvarbek Abduvoxobov
4.86 (43)
Trend Sniper X est un indicateur de suivi de tendance multi-unités de temps pour MetaTrader 5 qui aide les traders à identifier la direction de la tendance et les points d'inversion potentiels avec clarté et précision. pour MT4: https://www.mql5.com/en/market/product/193245 Informations sur le prix : Le prix actuel est un prix promotionnel et est susceptible de changer lors des prochaines mises à jour et nouvelles fonctionnalités. Offre bonus : Pour obtenir GRATUITEMENT l'Auto-Trade Assistant E
Smart Trend Trading System — MetaTrader 5 Après votre achat, envoyez-moi un message sur MQL5 pour recevoir GRATUITEMENT Smart Universal Expert Advisor, ainsi que le cours en ligne, le manuel PDF et l’accès au groupe privé. STTS réunit la direction de la tendance, les signaux d’entrée et de sortie, les zones de retournement et les niveaux de prix importants directement sur votre graphique. Suivez le système manuellement ou connectez un EA compatible distinct pour une exécution automatique selon l
Un nouveau Roi en ville - Indicateur + Gestion des ordres (TP1 + TP2 + TP3) + Envoi optionnel de signaux Telegram INCLUS (GRATUIT) (SYSTÈME COMPLET DE TRADING et DE SIGNAUX) Notre meilleur EA pour l’Or : Gold Slayer Cet indicateur inclut une stratégie avancée, un système de trading avec gestion des ordres personnalisable ainsi qu’un système de retour à la moyenne combinant des extensions d’enveloppes, soutenu par plusieurs filtres intelligents de confirmation comme le RSI afin de détecter des en
Gardez votre avantage de trading dans votre ligne de mire ! M5 Sniper est un nouvel indicateur de MeanFX. Il combine des signaux de trading précis avec des niveaux de TP/SL adaptatifs — créant ainsi les meilleures opportunités de trading statistiques possibles ! Le prix augmente tous les 5 achats, le prochain prix est de 69$ Envoyez-moi un message après l’achat pour recevoir des conseils/un guide et un EA bonus Qu’est-ce qui le distingue ? Performance statistique éprouvée sur Gold XAUUSD ( fonct
SuperScalp Pro
Van Minh Nguyen
4.54 (37)
SuperScalp Pro - Professional Multi-Layer Confluence Scalping System SuperScalp Pro est un indicateur de scalping avancé qui améliore le Supertrend classique grâce à plusieurs filtres intelligents de confirmation. Il vous aide à identifier des opportunités de trading Buy/Sell présentant une probabilité de réussite plus élevée, tout en réduisant considérablement les faux signaux. Des flèches Buy et Sell bien visibles apparaissent directement sur le graphique, avec des niveaux de Stop Loss et de T
En 2019, j'ai montré au monde entier ce dont cet indicateur est capable. J'ai tradé ses signaux manuellement, sur un compte réel, en toute transparence — le compte était suivi sur Myfxbook, et je relatais cette expérience en détail sur Facebook. Résultat : en quatre mois, 10 000 dollars sont devenus 941 411. Le risque était délibérément extrême — le drawdown allait jusqu'à 54 %, car dans notre métier, le profit et le risque vont toujours de pair. La capture d'écran de Myfxbook est la première im
Ultra Indicator
Ihor Otkydach
5 (1)
ULTRA est un indicateur technique « tout-en-un » : il analyse le marché de manière autonome, génère des signaux de trading, affiche les niveaux permettant de définir des ordres stop-loss et suggère le moment opportun pour clôturer les positions afin de sécuriser les bénéfices ou de minimiser les pertes. En d'autres termes, peu importe que vous ne sachiez pas analyser le marché, déterminer les niveaux (où placer votre stop-loss) ou que vous ayez du mal à gérer votre capital. ULTRA s'occupera de t
SMC Intraday Formula
VividMind Digital Solutions
5 (26)
Commençons par être honnêtes. Aucun indicateur ne vous rendra rentable à lui seul. Si quelqu’un vous dit le contraire, il vous vend un rêve. Tout indicateur qui affiche des flèches parfaites d’achat/vente peut être rendu impeccable — il suffit de zoomer sur la bonne partie de l’historique et de capturer uniquement les trades gagnants. Nous ne faisons pas cela.  SMC Intraday Formula est un outil. Il lit la structure du marché pour vous, identifie les zones de prix à la probabilité la plus élevée
Gann Made Easy   est un système de trading Forex professionnel et facile à utiliser qui est basé sur les meilleurs principes de trading en utilisant la théorie de mr. WD Gann. L'indicateur fournit des signaux d'ACHAT et de VENTE précis, y compris les niveaux Stop Loss et Take Profit. Vous pouvez échanger même en déplacement en utilisant les notifications PUSH. VEUILLEZ ME CONTACTER APRÈS L'ACHAT POUR RECEVOIR GRATUITEMENT DES INSTRUCTIONS DE TRADING ET D'EXCELLENTS INDICATEURS SUPPLÉMENTAIRES! V
M1 Sniper MT5
Oleg Rodin
5 (7)
M1 SNIPER   est un système d'indicateurs de trading facile à utiliser. Il s'agit d'un indicateur à flèche conçu pour l'unité de temps M1. Cet indicateur peut être utilisé seul pour le scalping sur l'unité de temps M1 ou intégré à votre système de trading existant. Bien que conçu spécifiquement pour le trading sur l'unité de temps M1, ce système peut également être utilisé avec d'autres unités de temps. Initialement, j'avais conçu cette méthode pour le trading du XAUUSD et du BTCUSD. Cependant, j
Auto Optimized SpeedAngle est un système de vectorisation du momentum de niveau institutionnel qui élimine l'ajustement de courbe ( curve-fitting ) grâce à une optimisation continue par avancement ( Walk-Forward Optimization , WFO). Plutôt que de s'appuyer sur des entrées statiques qui se dégradent lorsque les régimes de marché changent, l'indicateur recalibre dynamiquement ses paramètres en utilisant une validation hors échantillon ( Out-of-Sample , OOS), garantissant ainsi que les signaux affi
Prochaine mise à jour — Version 2.52 bientôt disponible ! [NOUVEAU] Préparez-vous à découvrir 4 nouvelles fonctionnalités majeures conçues pour améliorer votre analyse du marché et votre flux de travail de trading Nous faisons passer l’analyse du marché au niveau supérieur avec 4 nouvelles fonctionnalités conçues pour répondre à vos besoins en trading. Découvrez : 1. TRADE OVERVIEW DASHBOARD 2. CONFLUENCE AT ZONE 3. STRONG & WEAK HIGH/LOW 4. OTE 1. TRADE OVERVIEW DASHBOARD Un tableau de bord qu
Atomic Analyst MT5
Issam Kassas
4.5 (64)
Atomic Analyst — MetaTrader 5 Après votre achat, envoyez-moi un message sur MQL5 pour recevoir GRATUITEMENT Smart Universal Expert Advisor, ainsi que le cours en ligne, le manuel PDF et l’accès au groupe privé. Atomic Analyst réunit l’action des prix, la direction de la tendance, les signaux d’entrée et de sortie, le Stop Loss et plusieurs niveaux de Take Profit directement sur votre graphique. REPÉREZ LE SIGNAL. COMPRENEZ LA CONFIGURATION. Atomic Analyst présente son analyse sous forme d’inform
Boba Analysis Suite
Trade Ready Solutions LLC
5 (2)
Boba Analysis Suite Boba Analysis Suite est un indicateur d’analyse pour MetaTrader 5. Il réunit la structure du marché, les zones de prix pertinentes et le contexte général du marché dans une même vue graphique. Développé à partir de l’expérience pratique d’un trader et formateur en trading, il accompagne une démarche d’analyse structurée : évaluer la direction du marché, identifier les niveaux importants et analyser plusieurs unités de temps conjointement. Une analyse en contexte La significat
Azimuth Pro
Ottaviano De Cicco
5 (7)
Azimuth Pro V2: Synthetic Fractal Structure and Confirmed Entries for MT5 Overview Azimuth Pro is a multi-level swing structure indicator by Merkava Labs . Four nested swing layers, swing-anchored VWAP, ABC pattern detection, three-timeframe structural filtering, and closed-bar confirmed entries — one chart, one workflow from micro-swings to macro-cycles. This is not a blind signal product. It is a structure-first workflow for traders who care about location, context, and timing. Halloween P
Zain Gold Scalping
Ahmed Gamal Abdel Nasser Mohamed
A complete price-action analysis tool built around dual independent entry logic, each confirmed against a volatility band, combined with a configurable set of nine optional confirmation filters that let you shape exactly how conservative or aggressive the tool's signals behave. Core Strategy Two independent entry setups, each triggering only when price moves outside a dynamic volatility band — giving two distinct ways to spot potential reversal points, which can be used together or separately.
FiboSniper Pro
Van Minh Nguyen
5 (4)
FiboSniper Pro – Multi-Filter Fibonacci System with Auto SL/TP and Control Panel FiboSniper Pro est un indicateur technique qui combine des Fibonacci Envelopes dynamiques avec plusieurs filtres de confirmation afin de générer des signaux Buy et Sell sélectionnés. Les niveaux de Fibonacci sont calculés à partir de Moving Average et ATR, puis filtrés par ADX, EMA, RSI, ATR, Volume, Time et la structure des bougies. L’indicateur affiche directement sur le graphique les niveaux automatiques de Stop
Power Candles MT5
Daniel Stein
4.58 (12)
Power Candles V3 - Indicateur de force à optimisation automatique Power Candles V3 transforme la force des devises et des instruments en un plan de trading exploitable sur chaque graphique auquel il est associé. Au lieu de se contenter de colorer les bougies, il effectue une optimisation automatique en temps réel en arrière-plan et vous fournit les meilleurs niveaux de Stop Loss, Take Profit et seuils de signal pour le symbole que vous avez sous les yeux. Un simple clic suffit pour l'adopter en
Quantum TrendPulse
Bogdan Ion Puscasu
5 (26)
Présentation de   Quantum TrendPulse   , l'outil de trading ultime qui combine la puissance de   SuperTrend   ,   RSI   et   Stochastic   dans un seul indicateur complet pour maximiser votre potentiel de trading. Conçu pour les traders qui recherchent précision et efficacité, cet indicateur vous aide à identifier les tendances du marché, les changements de dynamique et les points d'entrée et de sortie optimaux en toute confiance. Caractéristiques principales : Intégration SuperTrend :   suivez f
Tokyo mt5 Indicator
Vasiliy Strukov
5 (14)
Le Tokyo Indicator offre une vue d'ensemble visuelle et claire de l'orientation de la tendance, des signaux de trading potentiels et des conditions du marché. Sa ligne de tendance en escalier, codée par couleur, distingue les phases haussières (en bleu) des phases baissières (en magenta). Des flèches directionnelles associées mettent en évidence les opportunités d'achat et de vente potentielles lors des changements de tendance. Un tableau de bord intégré regroupe le signal actuel, l'orientation
Adaptive Price Action Engine Achetez un indicateur, obtenez l'EA gratuitement Analyse auto-optimisée des tendances et des figures de chandeliers Multi-Timeframe Les marchés évoluent constamment, et tous les modèles de Price Action n’ont pas la même valeur dans toutes les conditions de marché. Adaptive Price Action Engine a été conçu pour s’adapter aux changements du marché en combinant structure de tendance, analyse Multi-Timeframe, figures de chandeliers et optimisation statistique au sein d’un
Superhero
Ihor Otkydach
5 (3)
L'indicateur SUPERHERO est un système de trading multidevises conçu selon un principe « tout compris ». Cet indicateur analyse le marché de manière autonome et fournit des signaux indiquant quand ouvrir et clôturer des positions. Il utilise des ordres Stop Loss et Take Profit. Le rapport R:R est de 1:1. Ce système peut envoyer des notifications push sur votre smartphone, ce qui vous permet de passer des ordres « où que vous soyez », sans avoir à rester devant un ordinateur. C'est la solution idé
Trend Catcher ind mt5
Ramil Minniakhmetov
5 (18)
INDICATEUR DE DÉTECTEUR DE TENDANCE L'indicateur de détecteur de tendance analyse les mouvements de prix du marché grâce à une combinaison d'indicateurs d'analyse de tendance adaptatifs, propriétaires et personnalisés. Il identifie la véritable direction du marché en filtrant les fluctuations à court terme et en se concentrant sur la force de la dynamique sous-jacente, l'expansion de la volatilité et la structure des prix. Il utilise également une combinaison d'indicateurs personnalisés de lis
Indicateur de force et de momentum multi-devises MT5 Dynamic Forex28 Navigator est l'évolution de nos indicateurs populaires de longue date et réunit la puissance de trois outils en un : Advanced Currency Strength28 Indicator (700 avis) Advanced Currency IMPULSE with ALERT (530 avis) CS28 Combo Signals (bonus actuel) Les deux indicateurs précédents totalisent plus de 1 200 avis sur le MQL5 Market et font partie des outils incontournables de la communauté MT4 depuis 2016. Dynamic Forex28 Navigato
Apex Patterns PRO Achetez l'indicateur - Obtenez GRATUITEMENT l'Expert Advisor basé sur celui-ci. Intelligence auto-optimisée des figures chartistes et des cassures Les scanners de figures traditionnels s'appuient sur des paramètres fixes, sous-performant souvent lorsque la volatilité et les structures du marché changent. Apex Patterns PRO est conçu pour s'adapter aux conditions changeantes du marché en combinant la reconnaissance des figures chartistes structurelles, le filtrage du momentum et
Crystal Heikin Ashi Signals
Muhammad Jawad Shabir
5 (5)
Crystal Heikin Ashi Signals—Professional Trend & Signal Detection Indicator Advanced Heikin Ashi Visualization with Intelligent Signal System for Manual & Automated Trading Final Price: $149 ---------> Price goes up $10 after every 10 sales . Limited slots available — act fast . Overview User Guide PDF Crystal Heikin Ashi Signals is a professional-grade MetaTrader 5 indicator that combines pure Heikin Ashi candle visualization with an advanced momentum-shift detection system. Designed for both m
Neuro Poseidon MT5
Daria Rezueva
4.75 (52)
Neuro Poseidon is a new indicator by Daria Rezueva. It combines precise trading signals with adaptive TP/SL levels - creating best possible trades as a result! Message me and get  Neuro Poseidon Assistant  as a gift to automize your trading process! What makes it stand out? 1. Proven profitability on all assets and timeframes 2. Only confirmed BUY and SELL signals present on the chart 3. Adaptive TP & SL levels generated by the software for each trade 4. Easy to understand - suitable for al
Break and Retest Hunter is a powerful MetaTrader 5 indicator designed to automatically identify support and resistance levels, breakout structures, and potential retest opportunities in real time. Bonus Indicator: After purchasing Break and Retest Hunter , contact me to receive Trade Indicator Assistant EA completely free as a bonus utility. $65 for the next 10 copies . Next price is $120.  Combining adaptive market analysis, clear BUY/SELL signals, Fibonacci-based profit targets, and a premiu
Unix Scalper
Issam Kassas
4 (4)
Unix Scalper — MetaTrader 5 Après votre achat, envoyez-moi un message sur MQL5 pour recevoir GRATUITEMENT Smart Universal Expert Advisor, ainsi que le cours en ligne, le manuel PDF et l’accès au groupe privé. Repérez la configuration. Consultez le plan. Choisissez comment intervenir. UNIX Scalper réunit l’analyse du marché, les décisions BUY/SELL/WAIT et les niveaux Entry, Stop Loss, TP1 et TP2 dans un panneau organisé. VISUALISEZ LE SIGNAL ET LE PLAN • Des décisions claires : BUY, SELL ou WAIT.
CGE Trading Suite
Carl Gustav Johan Ekstrom
5 (3)
Institutional-Grade Analytics for MT5 The full analytical edge of a professional trading desk, built into your MT5 chart. A full guided tour walks you through every feature step by step. Standard retail platforms lack the depth required for professional market analysis. The CGE Trading Suite bridges this gap, transforming MetaTrader 5 into a comprehensive workspace. By integrating 18 proprietary modules into a single, unified chart interface, the suite eliminates fragmented analysis. It provide
Plus de l'auteur
A fully automated double-side grid and hedge Expert Advisor for gold (XAUUSD) on MetaTrader 5. OVERVIEW Gold DoubleSide Grid EA trades both directions on the same symbol at the same time. It opens paired buy and sell positions, adds to the grid by Distance steps as price moves, scales lot size with a martingale multiplier, and aims to close each cycle in profit using a trailing profit lock. An automatic session filter learns the broker's daily market break from tick data, so the EA pauses around
Session Volume Profile (Daily) This indicator draws a daily Session Volume Profile directly on your chart. For each trading day it builds a horizontal volume histogram and marks the three key levels traders watch: the Point of Control (POC) , the Value Area High (VAH) and the Value Area Low (VAL) . The profile resets automatically at the start of every new day, and you can choose how many previous days to display alongside the current one. Key Features POC, VAH and VAL plotted and labelled for e
CustomRange VolumeProfile This indicator builds a Volume Profile for any part of the chart you want to study . Instead of resetting per day, you choose the range - either by dragging two vertical lines yourself, or by letting the indicator snap the range to a ZigZag swing leg automatically . It then draws the horizontal volume histogram together with the three key levels: the Point of Control (POC) , the Value Area High (VAH) and the Value Area Low (VAL) . Two Ways To Set The Range MANUAL - two
QuickTrade - One-Click Trading Panel QuickTrade is a manual trading panel that places orders with a single click and sizes the lot automatically from a fixed money-per-trade amount. Instead of typing a lot size, you type how much money you want to put at risk, and QuickTrade calculates the correct lot from your chosen Stop Loss distance. Every order is sent with its Stop Loss and Take Profit already attached. Key Features One-click SELL / BUY - large buttons that also show the live Bid/Ask price
FVG Zones MTF This indicator detects Fair Value Gaps (FVG) and draws them as zones on your chart, from up to three timeframes at the same time - the chart timeframe plus two higher timeframes of your choice. Each timeframe set has its own colours and label, so you always know which timeframe a zone came from. Key Features Detects bullish and bearish FVG zones on the current timeframe plus two higher timeframes , all shown on one chart. Small control panel on the chart with one button per timefra
Triple MA Trend Alignment This indicator draws three moving averages on one chart and colours them by their alignment , so the state of the trend can be read at a glance instead of comparing the lines by eye. The default setup is EMA 9, EMA 34 and EMA 100, and every period, method, applied price, colour and line width can be changed. How The Colours Work The three lines are coloured by two independent rules. Fast and Mid always share one colour, decided by the fast line: above the mid line they
SMC Swing Structure and Fair Value Gaps Most market structure indicators draw every break and every gap they can find, and the chart ends up covered in lines from months ago. This one shows one swing at a time . You pick a swing with the arrows on the chart panel, and only that swing is drawn: its leg, the structure level it broke, and the fair value gaps created inside it. Key Features One swing at a time. The chart stays clean because nothing outside the selected swing is drawn. Step through s
Multi MA Ribbon Crossover and Pullback This indicator draws nine exponential moving averages as one ribbon on the price chart. Every line is coloured by its own slope, so the ribbon shows at a glance which part of the trend is still rising and which part has already turned. On top of the ribbon it marks two kinds of signals: a crossover of the fastest line with the main line, and a pullback to the main line inside an established trend. All signals are confirmed on closed bars only. How The Ribbo
QuickTrade Lines Risk Panel QuickTrade Lines Risk Panel is a manual trading panel that works with three lines on the chart: entry, stop loss and take profit. You drag the lines to the prices you want, and the panel reads their positions and works out the order by itself - buy or sell, limit or stop. The lot is calculated from the stop loss distance, either from the money you are willing to risk or from a fixed lot that you type in. Every order is sent with its stop loss and take profit already a
Filtrer:
Aucun avis
Répondre à l'avis