Execution Cost Audit
- Utilities
-
Carlos Macaya Rodriguez
 I build tools for MetaTrader 5 — trade and risk management utilities, panels, and diagnostics that work with the terminal's own data.
 - Version: 2.0
- Activations: 10
Ever wondered what your trading really costs you? Execution Cost Audit reads the closed history already on your account and tells you: the spread you were quoted at the moment of each fill, how far each fill slipped, and what commission and swap added on top. Nothing to install in advance, nothing to wait for. It only reads, it never sends an order.
Why I built it
I wanted to know what my own trading was costing me, and every tool I found gave the same answer: install it and come back in a few weeks. But the history was already there, on my account, with every deal and every price. The spread at the moment of each fill was in the broker's tick archive. All the pieces existed; nobody was putting them together.
So I wrote something that does. Drop it on a chart and it reads the closed history you already have, rebuilds every round trip from its deals, and looks up in the tick archive what was being quoted at the millisecond of each fill and how far that fill landed from the price the order asked for. Commission and swap come from the deals themselves. A minute later you know what the last ninety days cost you, or the last year, or everything the terminal remembers.
It never opens, modifies or closes an order. There is no trading function anywhere in the code, and it does not need automated trading to be switched on.
What it tells you
- The spread, as it was quoted at the moment of each fill. Not the one on your screen now, not a broker average, and not the spread field of an M1 bar, which averages a whole minute, including the minute it widened.
- The slippage, as the difference between what the order asked for and what it got. The requested price for a market order, the level for a stop or a limit. The sign is arranged so that a positive number always means it went against you.
- Commission, fees and swap, per round trip, straight from the deals.
- And when the tick archive has nothing for a fill, it tells you. The fill stays unmeasured rather than invented, and the report says what share that was.
Keeping the four costs apart
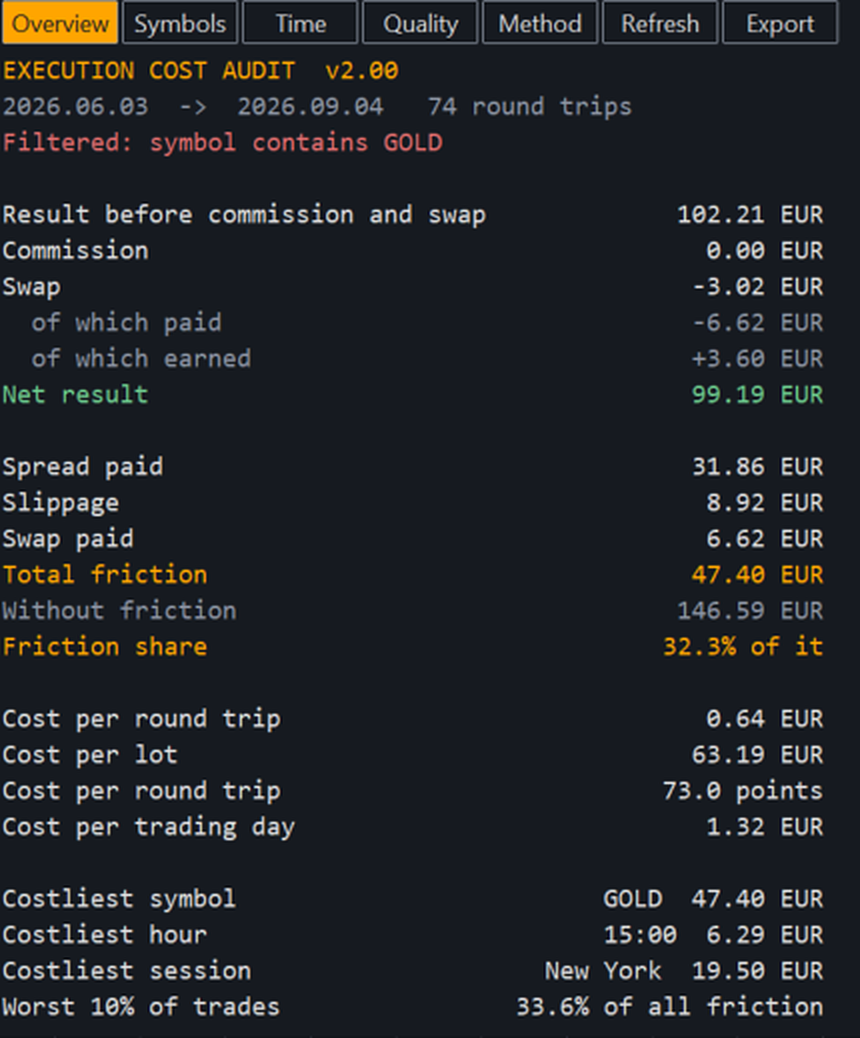
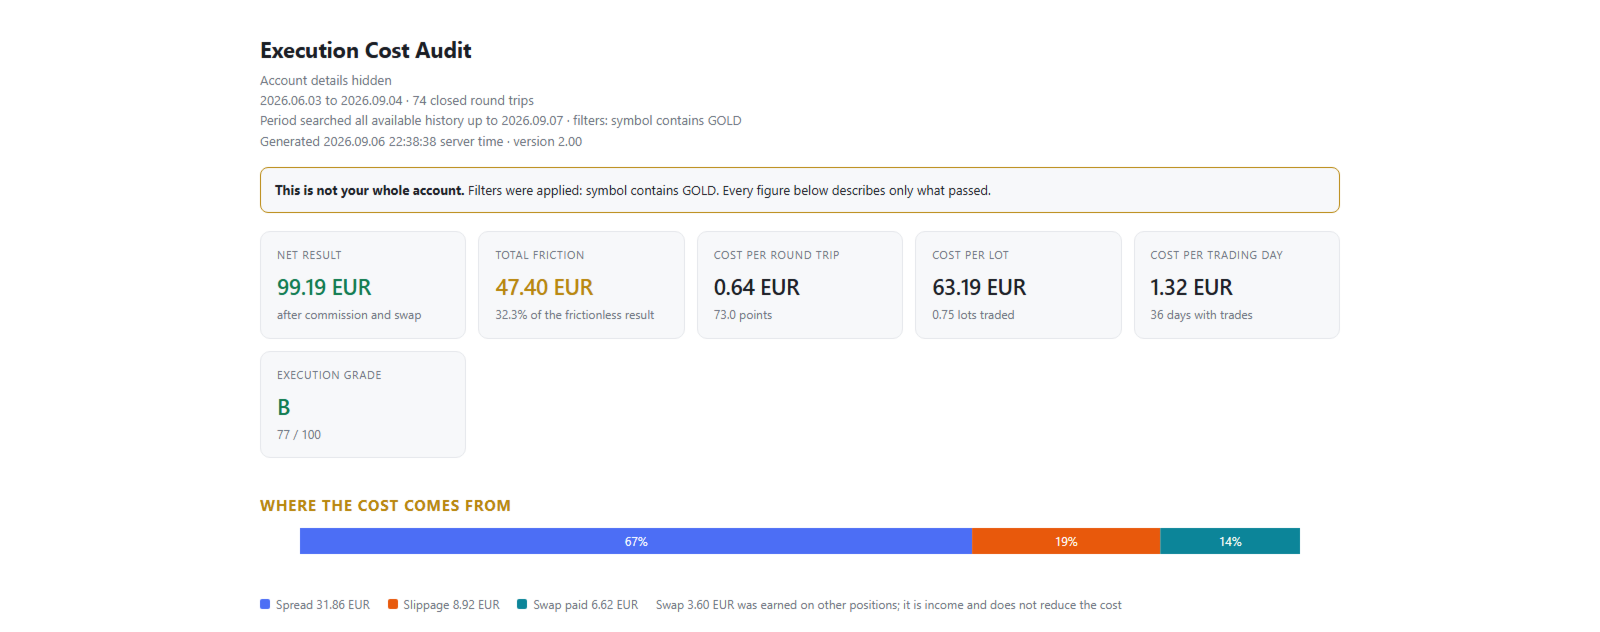
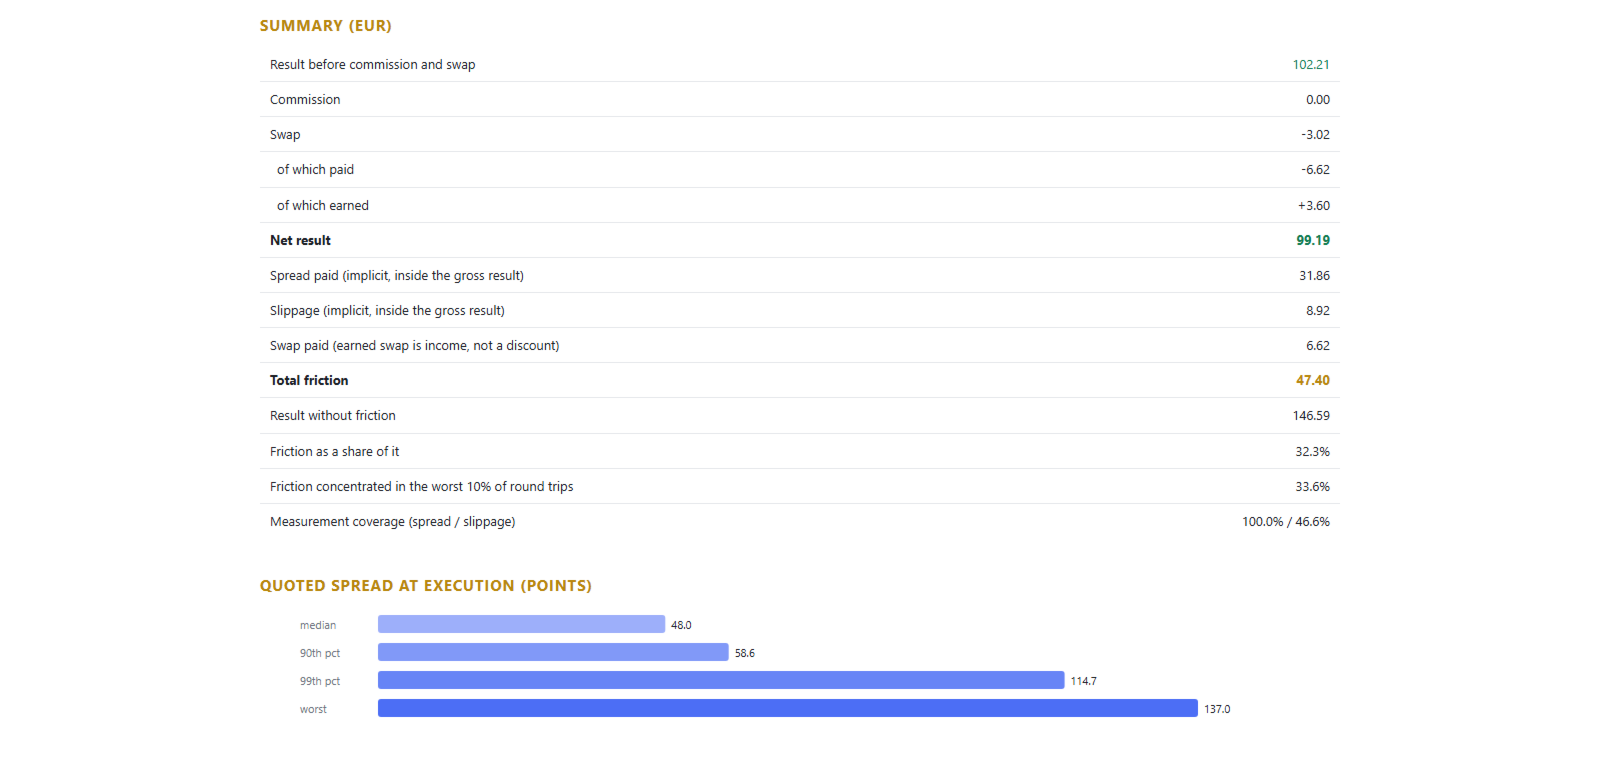
Here is an easy mistake to make: add spread, slippage, commission and swap together and subtract the lot from your gross result. It double counts. Spread and slippage are already inside the gross result, because you bought at the ask and sold at the bid; commission and swap are charged on top. The report keeps them separate. It shows what actually reached your account and, next to it, what the same trades would have returned if they had been filled at mid price with no commission and no swap. When it states cost as a percentage, that second figure is the denominator.
Swap gets the same care. You see it netted in the result and then split into what you paid and what you earned. Only the paid part counts as a cost, so the cost rows always add up to the total.
Where the money went
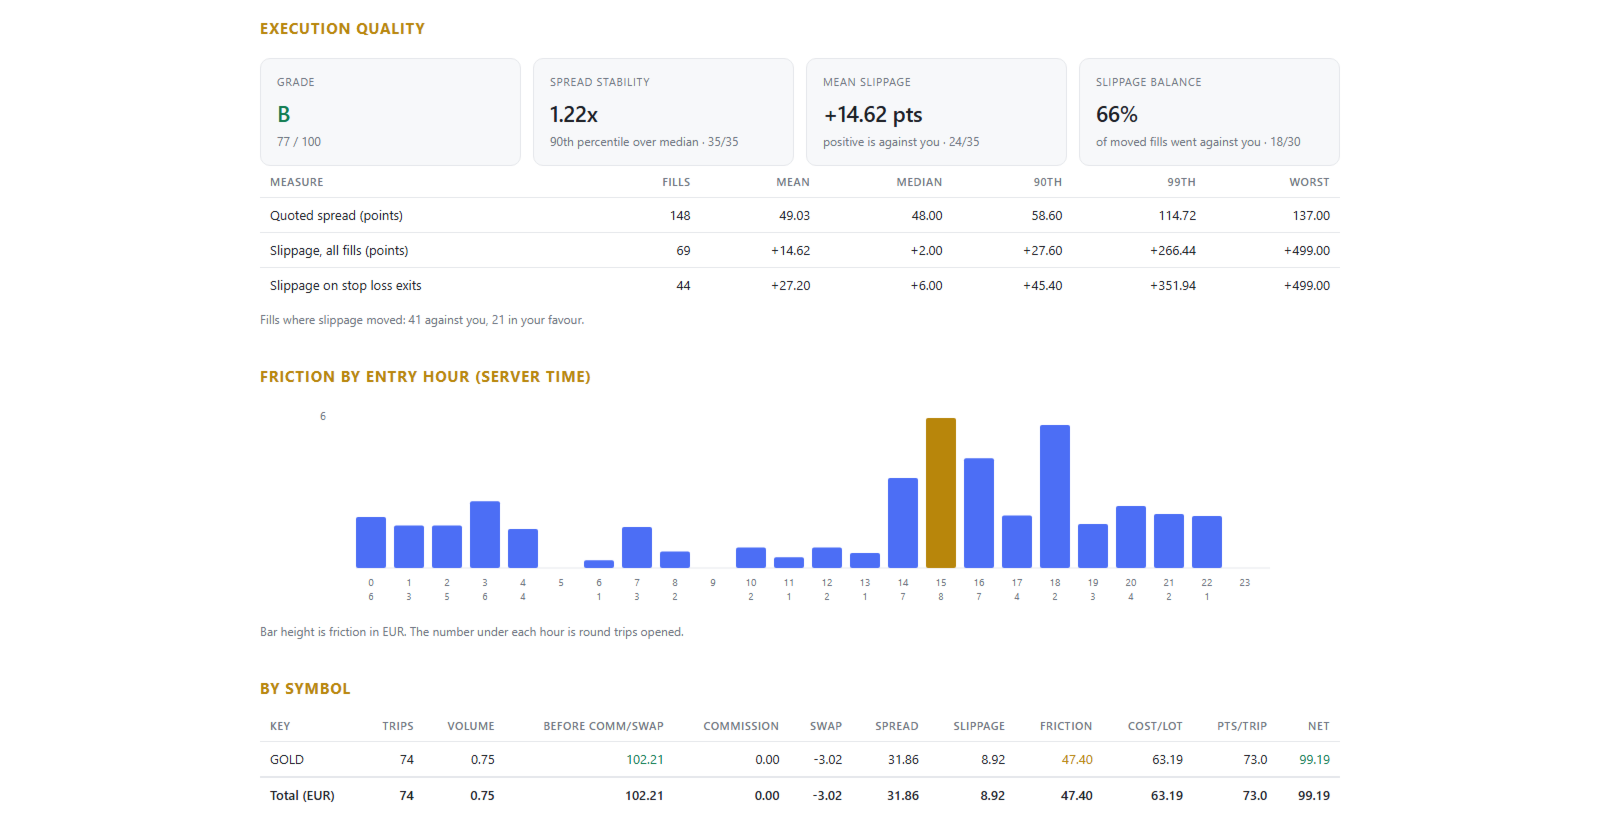
Every figure is broken down by symbol, by the hour you entered, by weekday, by session, by direction, by magic number and by how the position was closed. Slippage on stop loss exits is reported on its own, because that is usually where the surprises are. You also get the ten costliest round trips and how much of your total friction sits in the worst ten percent of them. It is often more than you would think, and it points at something you can change.
How your broker fills you
Three things you can hold a broker to, none of which say anything about whether your strategy is any good:
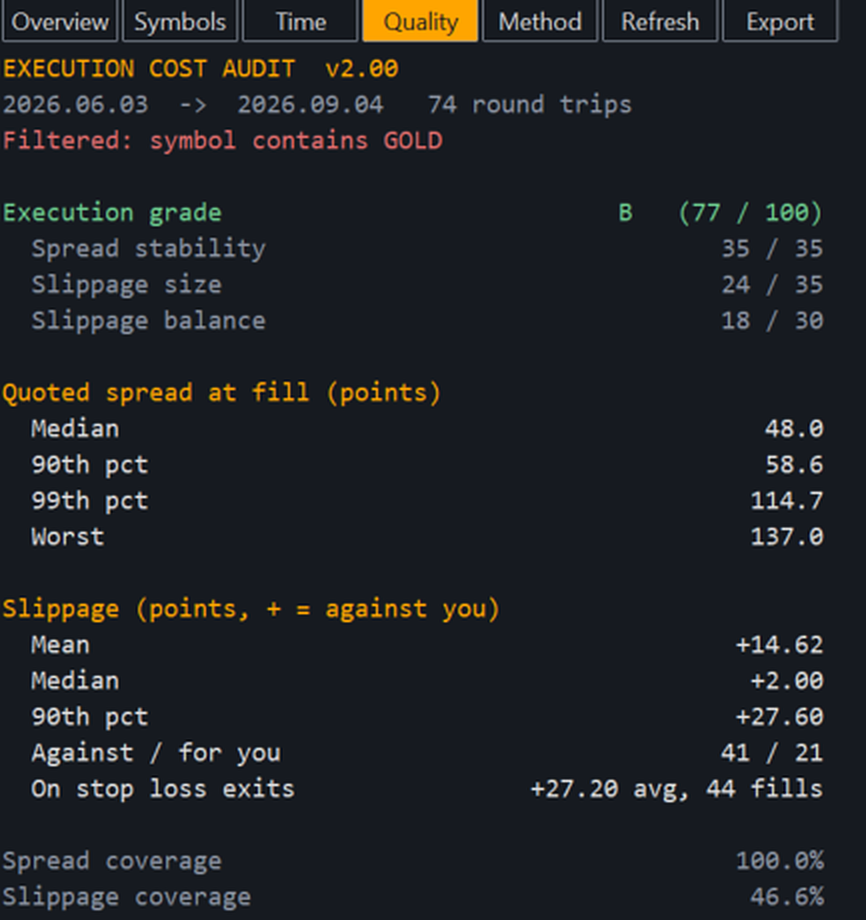
1. Is the spread stable? The 90th percentile of the quoted spread against its median. An advertised spread that only applies when nothing is happening shows up here.
2. How much slippage is there? Measured against the typical spread of the instrument, so a few points on gold and a few points on EURUSD are not judged the same way.
3. Is it balanced? Of the fills that moved, how many moved against you. A book that only ever slips one way does not have a latency problem.
The three combine into a score from 0 to 100 and a letter grade. If a component does not have enough samples it is dropped and the rest is rescaled, so an account whose broker publishes no tick archive is still graded on its fills.
Turning points into money without fooling yourself
The usual shortcut is the current tick value, and it carries today's exchange rate into a trade from four months ago. Instead, each closed position calibrates its own conversion from its realised profit: it moved a known distance and booked a known result, and that reveals the conversion the broker applied at that moment, cross rate included. The tick value is only a fallback for positions that barely moved.
It tells you what it leaves out
A filtered report looks exactly like a complete one, and that is how someone audits four trades of an account with seventy and concludes their costs are fine. This one always states the span of the trades it audited, the period it searched, the filters in force and how many closed round trips lie outside that period. In the panel, in the HTML report and in the CSV.
What comes out
- A panel on the chart with five pages: Overview, Symbols, Time, Quality and Method. It anchors to any corner, fits itself to the chart height and scrolls when there is more than fits.
- A standalone HTML report with the charts built in. No external files, so it opens on any computer and prints cleanly. Good for sending to your broker, or to yourself six months from now.
- A CSV with one row per round trip, UTF-8 with byte order mark and the separator of your choice, for your own spreadsheet.
Try it before you buy it
The Strategy Tester has no account history to audit, so in the tester the product builds a simulated set of trades on the tick stream and audits that instead. No orders are sent. The spreads, the price movement between deciding and being filled, and the stop loss fills all come from the broker's recorded ticks for that symbol and period, so the execution figures describe that instrument at that broker. Only the trade schedule is invented, and every screen says so. Use the model "Every tick based on real ticks": the OHLC and open price models generate ticks too sparse to time a fill, and when that happens the report says how many fills it left unmeasured.
It has a useful side effect. Point it at any symbol and period and it answers a question you may have asked yourself before opening an account: what would trading this instrument at this broker have cost me?
What you need
MetaTrader 5, no DLL. Hedging or netting accounts, any symbol, any timeframe. Spread measurement needs the tick archive for the symbols you traded. The first run on a symbol may take a minute while the terminal downloads its ticks; the panel and the report name the symbols still missing, and the audit retries on its own for a few minutes.
Main parameters
- Period: last N days, a custom date range, or the full available history.
- Filters: symbols (with or without broker suffix), magic numbers and ranges, direction, minimum volume.
- Measurement: quote lookup window in milliseconds, half or full spread per fill, automatic money calibration or current tick value.
- Sessions: Asia, London and New York hours in server time, midnight crossing allowed.
- Panel: corner, offsets, font size, colours, automatic refresh interval.
- Reports: HTML and CSV on or off, CSV separator, export on first audit, hide account details, report folder and name suffix.
- Strategy Tester demonstration: size, trades per day, holding time, assumed commission, stop distance.
Limits, stated plainly
- Only fully closed round trips are counted. An open position is half a round trip, and half a round trip has no exit to measure.
- On accounts with market execution the order carries no requested price, so entry slippage cannot be measured. The report shows the coverage figure instead of filling the gap.
- On some servers a market order is recorded at its fill price. When every market fill on the account shows exactly zero slippage, those fills are treated as unmeasured rather than graded as perfect, and the report says so.
- Spread and slippage are measurements of what the archive holds, and the archive is the broker's.
- The execution grade describes fills, not profitability. A perfect broker does not make a losing strategy win.
Questions
If something in your report does not add up, ask in the product comments or send me a private message on MQL5. I read both, and a report that cannot be explained is exactly the kind of thing I want to hear about.