Makito AD Indicator
- Indicators
- Version: 1.1
- Updated: 15 September 2026
- Activations: 20

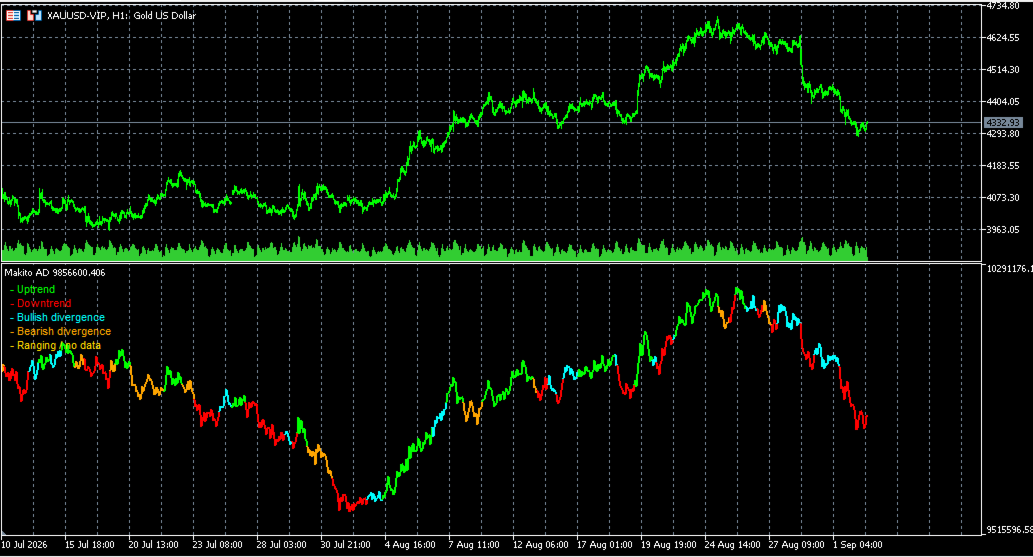
Makito AD is a volume-based market analysis indicator designed to identify market trends and changes in market direction by analyzing the relationship between price action and volume.
The indicator uses a dynamic line that changes color based on the current market condition, making it easier to visually identify whether market pressure is becoming bullish, bearish, or showing potential divergence.
Key Features
- Volume-Based Analysis — Uses volume and price action to assess market direction.
- Dynamic Trend Colors — The indicator line changes color as market conditions change.
- Bullish Trend — Green indicates bullish market pressure.
- Bearish Trend — Red indicates bearish market pressure.
- Bullish Divergence — Aqua highlights potential bullish divergence conditions.
- Bearish Divergence — Yellow highlights potential bearish divergence conditions.
- Clean Visual Design — Easy-to-read line makes trend conditions visible directly on the chart.
- Multi-Timeframe Use — Can be applied to different timeframes depending on your trading strategy.
- Alerts — Sends push notifications when regime changes
Color Guide
🟢 Green — Bullish trend
🔴 Red — Bearish trend
🩵 Aqua — Bullish divergence
🟡 Orange — Bearish divergence
How It Can Be Used
Makito AD can be used as a trend filter, confirmation tool, or divergence analysis tool. Traders can combine its signals with price action, support and resistance, moving averages, or other technical indicators.
Makito AD is an analytical tool and does not guarantee profitable trading results. Always use appropriate risk management and evaluate the indicator according to your own trading strategy.