Hizoa Market Sessions

  • Indicators
  • Ferry Nijland
    Ferry Nijland
    HIZOA — Structure Beyond the Visible
    Welcome to HIZOA.
    HIZOA is focused on the development of analytical tools for traders who want to look beyond price alone.
  • Version: 1.54
  • Updated: 6 October 2026
  • Activations: 5

HIZOA Market Sessions

is a professional market-session and volume-flow visualization tool designed to provide a clearer view of when market conditions change, which major trading session is active, and how volume pressure develops around those transitions.

Instead of displaying trading sessions only as simple time blocks, HIZOA Market Sessions combines session timing with integrated volume-flow analysis. This allows traders to view both the time structure of the market and the activity occurring within it directly on the chart.

The indicator is designed to provide useful market context across multiple chart timeframes, with automatic timeframe-specific Volume Flow profiles to maintain a balanced and responsive visualization.

MARKET SESSIONS

The indicator visualizes the major traditional trading sessions directly on the chart, including:

  • Sydney / Asia
  • Europe
  • USA
  • Daily rollover periods
  • Weekend rollover

Each session is identified as OPENING, OPEN, CLOSING or CLOSED.

This allows traders to quickly understand whether a session is entering its opening phase, fully active, approaching its close or already closed without manually calculating session times.

AUTOMATIC TIME CONVERSION

HIZOA Market Sessions uses UTC-based session references and automatically converts these times to the broker/server chart time.

The indicator can automatically determine the broker's UTC offset, allowing the same session structure to be displayed across different broker and server time zones.

The default configuration also includes automatic regional daylight-saving-time adjustment for the relevant Sydney, Europe/London and USA/New York session references.

Seasonal summer-time and winter-time changes are therefore taken into account automatically, reducing the need to adjust session times manually when daylight-saving periods change.

A manual broker UTC offset and alternative time-interpretation mode remain available when manual configuration is preferred or required.

BROKER-SPECIFIC QUOTE AND TRADE SCHEDULES

HIZOA Market Sessions reads the available Quote and Trade sessions for the active symbol from the broker's Contract Specifications.

The broker schedules are evaluated separately for each symbol and weekday. This allows the indicator to account for instruments with different Monday, regular weekday and Friday trading hours.

Broker-provided schedules are used as the standard reference for symbol availability and session-line placement.

This improves visualization on instruments with:

  • Symbol-specific trading schedules
  • Closed trading periods
  • Different Monday or Friday trading hours
  • Missing chart candles during market closures
  • Quote sessions that differ from executable Trade sessions

Broker schedules and available chart data can differ between Forex, commodities, indices, metals and cryptocurrencies. The indicator displays the structure available through the connected broker while retaining manual settings for traders who require a custom configuration.

PRE-MARKET AND SESSION TRANSITIONS

HIZOA Market Sessions does more than mark a single opening or closing time.

Silver dotted line

Marks the closing phase of the current session and the beginning of the pre-market period for the next session.

Silver solid line

Marks the definitive session transition: the current session has closed and the next session has officially opened.

This makes the transition between sessions visible instead of reducing it to a single timestamp.

DAILY ROLLOVER

Orange lines identify the transition surrounding the end of the USA session and the daily rollover into the next trading day.

Orange dotted line

Marks the closing phase of the USA session and the beginning of the daily rollover period.

Orange solid line

Marks the definitive USA session close and completion of the rollover into the next trading day.

These periods can be important because liquidity, spreads and market behavior may differ from normal active-session conditions.

WEEKEND ROLLOVER

The Friday weekend transition is visualized separately.

Red dotted line

Marks the point where the USA session enters its closing phase before the weekend and the weekend rollover period begins.

Red solid line

Marks completion of the weekend rollover. After this point, traditional market sessions remain closed until the new trading week begins.

This provides a clear visual distinction between the normal daily rollover and the transition into the weekend.

CRYPTO DURING THE WEEKEND

Cryptocurrency markets can remain available during the weekend while the traditional market sessions represented by HIZOA Market Sessions are closed.

For this reason, normal session structures are intentionally not displayed during the weekend period.

Crypto can continue trading 24/7, but weekend conditions may differ considerably from normal weekday conditions. These differences can include lower participation, reduced volume, wider or inconsistent spreads and less reliable price behavior.

The indicator therefore distinguishes between a cryptocurrency being tradable and the traditional session structure being active.

INTEGRATED CLEAN VOLUME FLOW

HIZOA Market Sessions includes an integrated Clean Volume Flow analysis.

The histogram provides a direct visual representation of bullish and bearish pressure:

  • Green bars represent bullish pressure
  • Red bars represent bearish pressure
  • Bar size and intensity provide additional context about relative activity

Automatic timeframe profiles adjust the internal Volume Flow parameters for the selected timeframe, while manual configuration remains available for advanced users.

The calculation engine is optimized for fast chart operation and responsive timeframe switching, including profiles that use longer historical lookback periods.

This allows session timing and volume behavior to be analyzed together without requiring a separate volume-flow indicator.

LIVE MARKET STATUS

The indicator continuously summarizes the current volume environment and directional pressure directly on the chart.

For example:

MEDIUM VOLUME | BEARISH PRESSURE

The live status is displayed in a dedicated bordered status field. The text and border automatically follow the color associated with the current market condition.

The status field automatically adapts to longer status messages while maintaining a clean interface.

This information is intended as market context and not as a buy or sell signal.

A bullish or bearish pressure reading describes the observed volume-flow condition. It does not predict the next market direction.

SESSION LINES AND DISPLAY HISTORY

Session lines can be switched ON or OFF directly from the chart.

The displayed session history can be adjusted from 1 to 7 days. The selected number of days is shown directly on the Session Lines button.

Examples:

SESSION LINES: ON 1 DAY

SESSION LINES: ON 3 DAYS

SESSION LINES: ON 7 DAYS

This allows traders to choose between a compact recent view and a broader overview of previous session transitions.

The lines can also be hidden temporarily to return to a clean price chart without removing the indicator or changing its settings.

SESSION LABELS AND COMPACT VIEW

Session labels can be controlled independently from the session lines using the dedicated SESSION LABELS chart button.

SESSION LABELS: ON

Displays the normal session labels together with the selected session history.

SESSION LABELS: OFF

Hides the normal session labels while leaving the session lines available.

When the labels are hidden, HIZOA switches to a compact session display. Only the currently active market session is shown near the chart controls.

This provides a cleaner chart while retaining immediate information about which major trading session is currently active.

Session Lines and Session Labels therefore operate as independent display controls, allowing the trader to choose the amount of session information visible on the chart.

ADAPTIVE CHART SPACE

HIZOA Market Sessions automatically manages the available space on the right side of the chart.

The chart shift adapts to the width of the chart window and reserves sufficient visual space for the Live Market Status interface.

This means that a chart displayed on a smaller window can receive proportionally more chart shift, while a chart stretched across a larger or multi-monitor workspace can use proportionally less.

The objective is to prevent current Volume Flow bars and price information from becoming visually obstructed by the status interface while avoiding unnecessary empty chart space.

ROLLOVER AND RECONNECTION STABILITY

Broker UTC-offset detection is stabilized during daily rollover and periods without incoming quotes.

Temporary quote interruptions do not immediately change the detected broker offset or shift the complete session structure.

The session display also includes automatic refresh and recovery logic designed to restore the current session structure when a new trading day begins or when valid broker/chart data becomes available again after an inactive period.

This is particularly useful around daily rollover, market reopening and the transition from the weekend into a new trading week.

The objective is to maintain consistent session-line placement without requiring routine manual refreshes.

CUSTOMIZABLE SETTINGS

HIZOA Market Sessions provides adjustable settings that allow traders to adapt the indicator to their chart environment, broker conditions and personal preferences.

Available settings include:

  • Automatic or manual broker UTC offset
  • Automatic regional daylight-saving-time adjustment
  • Automatic broker Contract Specifications synchronization
  • Manual session times when broker synchronization is disabled
  • Session-line history from 1 to 7 days
  • Session Lines ON or OFF
  • Session Labels ON or OFF
  • Session and rollover line colors
  • Line styles and visual settings
  • Automatic timeframe-specific Volume Flow profiles
  • Manual Volume Flow configuration
  • Volume Flow display settings
  • Volume Flow alert settings
  • Adaptive chart-space management

Considerable attention has been given to the default configuration. The standard settings have been tested and tuned to provide a balanced starting point, allowing the indicator to be used without extensive manual configuration.

Advanced users remain free to adjust the available parameters to suit their own preferences and trading environment.

WHY COMBINE TIME AND VOLUME?

Market activity is not distributed evenly throughout the trading day.

Session openings, session transitions, rollover periods and changes in market participation can create very different trading environments.

HIZOA Market Sessions is designed to make those changes easier to recognize by combining:

  • Market timing
  • Session transitions
  • Pre-market periods
  • Daily and weekend rollover
  • Broker-specific trading availability
  • Volume activity
  • Bullish and bearish pressure
  • Live session and market-status information

The goal is not to tell traders what to trade, but to provide a clearer picture of the environment in which a trading decision is being made.

DESIGNED FOR MARKET AWARENESS — NOT SIGNALS

HIZOA Market Sessions does not generate buy or sell signals and does not attempt to predict future price direction.

The indicator is designed as an analytical and visual decision-support tool.

The trader remains fully responsible for interpreting the displayed information and deciding whether market conditions are suitable for their own strategy.

IMPORTANT INFORMATION

Session timing is calculated using the available broker/server time, Contract Specifications and chart data.

Broker trading hours, Quote sessions, Trade sessions, server time, symbol specifications and available historical data can differ between brokers and instruments.

HIZOA Market Sessions uses the information supplied by the connected broker as its standard reference. The displayed session structure therefore represents the data and trading schedule available through that broker.

For automatic UTC and session-time conversion, the computer's system date, time and time zone must be configured correctly.

For correct visualization, make sure the relevant chart history and broker data are fully loaded and up to date.

HIZOA Market Sessions is intended for informational and analytical purposes only. It does not execute or manage trades and does not constitute financial advice.

Clear sessions. Broker-aware timing. Structure beyond the visible.

Your Feedback Matters

HIZOA is continuously developed with a focus on usability, clarity and practical value for traders.

We would be happy to hear about your experience with the HIZOA Market Sessions. Comments, reviews and ratings are greatly appreciated, and constructive feedback or suggestions for improvement are always welcome.

If you discover something that could be improved, or have an idea that could make the indicator even better, feel free to let us know.

Your feedback helps us continue improving HIZOA tools.


HIZOA — Structure Beyond the Visible

© 2026 HIZOA. All rights reserved.

Recommended products
Institutional Flow Indicator A smart volume-based tool that detects institutional activity zones through direct order flow patterns. It reveals where large institutions operate. An advanced volume indicator that filters out noise to identify probable institutional patterns. Key Features Smart cluster detection Automatic identification Signal classification: Violet / Yellow – Institutional Zone – Strong, sustained institutional activity Red / Green – Strong Signal – Significant buying/selling pre
POC, Volume Profile, Market Profile, Volume Indicator, Dynamic POC, Tick Volume, Forex Volume The Dynamic POC Hi Tf Arrow indicator is a reliable volume analysis tool (volume profile, market profile, tick volume) for accurately determining POC levels and price reactions. Dynamic POC Hi Tf arrow for MT4 Description Dynamic POC Hi Tf arrow is a professional volume analysis indicator designed to accurately identify key price levels and market direction. It is built on tick volume data and displ
Smart Keys Sniper Entry
Stephen Sanjeeve Sahayam
This 2 in 1 trade manager is ideal for trading candle breakouts. It can cost average a trade by placing additional limit orders on pullbacks. This ensures you get the best price on all your positions and a higher RR on your wins. Risk is calculated by the most recently closed candle height. The trade assistant buttons help manage all manually placed orders. Use it with any entry method; price action or indicators and for any trading style; scalping, intraday or swing trading. Features: Trade ca
ChartTrader is a professional trading tool that every trader needs in their toolbox. It has been developed to work with the MT4 Platform. ChartTrader offers a number of options to make placing orders in the Forex market quick and easy. The GUI sits on the chart window so there is no need to navigate to separate windows when placing orders. The program allows you to set pending and instant orders. It has a built in risk management system, so every trade can risk a percentage or a fixed amount in
Here   our more valuable tools SMC Trend Trading   ,  Easy SMC Trading  ,  Institutional SMC Architect Volume Analysis Tools  ,  Volume flow Profile  ,  Market volume profile  , FVG with Volume  , Liquidity Heatmap Profile  ,  Volume Spread Analysis The Market Profile & Volume Profile Indicator is a powerful technical analysis tool designed to visualize market activity and price distribution over specific timeframes. Unlike standard technical indicators that focus solely on price over time, th
Stay updated with Multicurrency Overview!! The algorithm of this EA releases an average of the movement percentage of all the Forex currencies linked to a single currency, isolating it, letting us to comprehend its real and specific trend. Above on the left, a panel show us efficiently the trend of the currency, in the timeframe actually used. The second panel will keep you updated on macroeconomic news. P.N.:The news time is based on your pc clock time, this way you won't have any problem reg
Heaven Assistant: Simplify Your MT4 Management Simplify the management of the MetaTrader 4 (MT4) platform with the Heaven Assistant . This Expert Advisor (EA) is a robust tool that allows you to control and customize your trading environment in an efficient and user-friendly manner. Key Features: Multiple Pairs Opening: Quick access to most currency pairs, both major and minor, plus exotic pairs. The ability to open indices, metals, and cryptocurrencies with a single click. Template Change: Easi
AZ AI Trend Core Pro
Shahrull Hissham Bin Saad
AZ AI Core Pro Indicator Overview AZ AI Core Pro Indicator is a smart trading analysis tool designed to help traders identify potential market opportunities through trend analysis, multi-timeframe confirmation, support and resistance zones, AI-based filtering, and early signal detection. The indicator combines multiple analytical layers into a single visual system, allowing traders to identify BUY and SELL opportunities with greater confidence while reducing unnecessary market noise. Suitable fo
Trade Like a Serpent — Calm, Precise, Lethal. The Serpent Strategy equips you with a visual edge — clarity in confusion, precision in volatility, and confidence in timing. Let your trades strike like a serpent — swift, silent, and accurate. Overview The Serpent Strategy   is a powerful custom-built MetaTrader 4 indicator designed to identify high-probability trade zones using a unique combination of market volatility, trend direction, and momentum confirmation. It visualizes price action i
This indicator alerts you when/before new candle bar formed. In other words,this indicator alerts you every 1/5/30/60/240 minutes. This indicator is especially useful for traders who trade when new bars formed. *This indicator don't work propery in strategy tester.Use Free Version to check functionality in live trading. Input Parameters Alert_Or_Sound =Sound ----- Choose alert or sound or both to notify you when new bar is coming. Enable_1mBarAlert ----- Enable alert for 1 min bar diff_1m --

MyZtrade Margin Zones (NKZ) The indicator shows on the chart the zones where major players — market makers and central banks — concentrate their activity, as well as key price levels derived from extremes. **Zones:** - market maker / central bank percentage zones - **5%, 10%, 15%, 20%, 25%** and fine 0.5%…5%; - NKZ zones from highs and lows - 1/4, 1/2, 3/4, 100%, 200%; - ATR zones of higher timeframes (H4, D1, W1, MN). **Features:** - automatic zone building from the latest price extremes; -
Channel indicator based on the principles of mathematical statistics. It uses neural networks to simplify a lot of complex calculations, which makes the indicator fast, even for weak computers. How it works The indicator is based on the moving average, the period of which you can set. The indicator analyzes price deviations from the moving average line for the last 1440 or 2880 bars, and each line indicates a certain probability of a price reverse depending on the selected settings: Standard,
Volume Profil MT4
Vincent Jose Proenca
Volume Profile Rectangle  Summary An interactive volume profile indicator that displays a horizontal analysis of traded volume at each price level within a selected area. It automatically creates a movable rectangle and shows colored bars representing bullish and bearish volume distribution. What it does: Displays horizontal volume : Visualizes the volume distribution at each price level as horizontal bars Bullish/Bearish analysis : Colors bars in green (bullish-dominant volume) or red (bearish-
Moving Average Alert
Christianiel Robles Faustino
4 (2)
Stop Watching the Moving Average. Get Alerted. Moving Average Alert  automatically monitors price interaction with your Moving Average and alerts you when your selected   candle and price-action conditions   occur. Don't settle for a basic MA crossover alert. KEY FEATURES   Close Above MA Detect bullish candles closing above the Moving Average.   Close Below MA Detect bearish candles closing below the Moving Average.   Close Above/Below MA Monitor both bullish and bearish MA brea
Stop Switching Between Charts. Monitor Them All. Multi Chart Moving Average Alert  gives you a powerful dashboard to monitor Moving Average conditions across up to 20 open charts from a single window . Instead of checking every currency pair and timeframe manually, see the market status at a glance and get alerted when your selected MA conditions occur. KEY FEATURES Monitor Up to 20 Charts Track multiple symbols from one dashboard. Two Independent Timeframes Monitor two selected tim
Currency Strength Matrix
Raymond Gilmour
4.5 (26)
THE ONLY CURRENCY STRENGTH INDICATOR BUILT ON PRICE ACTION Most currency strength meters average an oscillator, or measure how far price has travelled. But these are not accurate measures of trend, Currency Strength Matrix measures trend strength, not just if a currency price has gone up or down. Currency Strength Matrix reads market structure . For each of the 28 major pairs it finds the confirmed cycle highs and lows, and decides whether that pair is in an uptrend, a downtrend, or neither. A
Trading Special – 40% OFF Advanced Trade Manager – The Ultimate All-in-One Solution for Faster, Smarter, and Safer Manual Trading. Transform your manual trading with NextGen Trade Manager AI – the professional on-chart panel that combines instant execution, visual trade planning, and powerful risk management into one intuitive tool. Execute orders, manage risk, and protect profits faster than ever before, all without leaving your chart. Perfect for all traders looking to enhance their precisi
Call/Put Ratio is one of the most well-known indicators of the market sentiment. The indicator has been developed by Martin Zweig. It is based on real volumes of the CBOE option market. As we know, a Call option gives its owner the right to buy the underlying asset at a predetermined price. A Put option gives the right to sell it. Thus, increasing volumes for Call options indicate the increasing demand. The growth of Put option volumes shows that supply starts exceeding demand. If we divide the
TMA AI Bands
Monique Ellen Miranda Dos Santos
The TMA AI Bands indicator is based on the Triangular Moving Average (TMA) with dynamic upper and lower bands and clear buy/sell arrows plotted directly on the chart. It features integrated AI for adaptive optimization and guarantees no repaint, providing precise reversal signals when price touches the bands. Pairs: works with all currency pairs Recommended timeframes: D1 / W1 / MN Configurable external variables: TimeFrame – calculation period HalfLength – smoothing of the average BandsDeviatio
Trend Scan Friend
Israr Hussain Shah
Here   our more valuable tools SMC Trend Trading   ,  Easy SMC Trading  ,  Institutional SMC Architect Volume Analysis Tools  ,  Volume flow Profile  ,  Market volume profile  , FVG with Volume  , Liquidity Heatmap Profile  ,  Volume Spread Analysis Trend Identification: Look for the color change. When candles turn Green , look for Buy opportunities. When they turn Red , look for Sell opportunities. Entry: Enter on the break of the trend line or on the pullback to the line. Stop Loss: Use the
Are you searching for a tool that can uncover hidden market imbalances and guide your trading decisions? Look no further than the Fair Value Gap Indicator. This powerful tool acts as a magnet, pulling the price back to its starting point before making a move. By identifying these gaps on charts, you can take advantage of bearish bias trades and predict potential future price movements with greater accuracy. Created by a three-candle sequence, the Fair Value Gap Indicator is suitable for both bul
ZBubbles Delta
Vadim Verkhovtsev
ZBubbles Delta — Professional Volume Indicator for MT4 See volume the way institutions see it. Trade where smart money enters. ZBubbles Delta is an advanced volume analysis indicator for MetaTrader 4, combining statistical anomaly detection, ADX trend filtering, and built-in binary options statistics with Martingale tracking. Unlike standard volume histograms, ZBubbles Delta draws dynamic colored bubbles directly on price action, showing where institutional volume entered and how strong the
Blahtech Supply Demand
Blahtech Limited
4.58 (36)
Was: $299  Now: $99   Supply Demand uses previous price action to identify potential imbalances between buyers and sellers. The key is to identify the better odds zones, not just the untouched ones. Blahtech Supply Demand indicator delivers functionality previously unavailable on any trading platform. This 4-in-1 indicator not only highlights the higher probability zones using a multi-criteria strength engine, but also combines it with multi-timeframe trend analysis, previously confirmed swings
Market Profile Heat indicator  — is a classic Market Profile implementation that can show the price density over time, outlining the most important price levels, value area, and control value of a given trading session. This indicator can be attached to timeframes between M1 and D1 and will show the Market Profile for daily, weekly, monthly, or even intraday sessions. Lower timeframes offer higher precision. Higher timeframes are recommended for better visibility. It is also possible to use a fr
MQL5 Blogs : https://www.mql5.com/en/blogs/post/761446 MT4 Version : https://www.mql5.com/en/market/product/136790 MT5 Version : https://www.mql5.com/en/market/product/136791 Time Wizard is a professional trading assistant built for traders who need speed, timing, and execution control in one clean dashboard. This Expert Advisor is designed for event-based trading, scheduled execution, and fast semi-automatic order management. It allows you to prepare your orders in advance, define the exact e
MR Volume Profile 4
Sergey Khramchenkov
The "MR Volume Profile 4" indicator is a charting tool that displays trading volume at different price levels rather than time intervals. A key concept in volume profile is the point of control (POC)—the price level with the highest volume traded during the session or time range. While tools like VWAP or OBV provide volume trends, the "MR Volume Profile 4" indicator offers granular detail about where the most market activity occurs at specific price levels. This makes it a more precise tool for
First and foremost, the Insight Flow Indicator stands out as a Non-Repainting, Non-Redrawing, and Non-Lagging tool. This makes it a prime choice for both manual and algorithmic trading, ensuring reliable and consistent signals. User Manual: Settings, Inputs, and Strategy The Insight Flow Indicator leverages price action, strength, and momentum to provide a clear edge in the market. Equipped with advanced filters, it eliminates noise and false signals, enhancing trading potential. By using multip
RelicusRoad Multi Timeframe Trendbar is a multi-timeframe trend indicator for MetaTrader 4 and MetaTrader 5 that shows an Uptrend, Neutral or Downtrend state for nine timeframes, M1 to MN1, as a row of colored dots in the chart corner. Each timeframe gets one dot with its name above it, in the lower-right corner of the chart. The color tells you the state, so you can see which timeframes agree without switching charts. How it works For each timeframe, the indicator compares two standard tools on
FREE
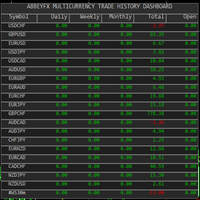
Abbeyfx Multicurrency Trade History Dashboard  is an indicator that tracks and analyzes in a table format the trading performances across multiple forex pairs, stocks, crypto assets, or other instruments.  This p ulls trades directly from MT4 trade history. The Multicurrency Comparison table shows s ide-by-side results for all pairs. With quick glance, you can see your best and worst performing pairs. This indicator is a t ime-based Analysis  Daily, weekly, monthly performance.
Market Monitor
Rodrigo Rethka Goncalves
Market Monitor – Smart Asset Performance Dashboard for MT4 Turn your MetaTrader 4 into a professional trading intelligence center! Market Monitor is a powerful monitoring tool that displays, in real time, the most relevant performance metrics of each symbol being traded — helping you make faster, smarter, and more strategic decisions. What Does This Indicator Do? Market Monitor scans all open and historical orders, consolidates the data by symbol, and displays everything in visual pa
Buyers of this product also purchase
SR Liquidity
Oleg Rodin
5 (2)
SR Liquidity is a trading indicator designed to reveal the hidden zones where market liquidity concentrates and price reacts most strongly. These special liquidity areas act as powerful support and resistance levels, giving you a clear map of where the market is most likely to reverse. Instead of drawing ordinary Support/Resistance lines, SR Liquidity analyzes real price behavior to detect the zones where buying and selling pressure accumulate. These are actually the pools of liquidity that driv
Trend SniperX MT4
Sarvarbek Abduvoxobov
5 (5)
Trend Sniper X is a multi-timeframe trend-following indicator for MetaTrader 5 that helps traders identify trend direction and potential reversal points with clarity and precision. For MT5: https://www.mql5.com/en/market/product/181101 Price Information: The current price is promotional and is subject to change as upcoming updates and new features are released. Code2Profit Channel Master the Market with Multi-Timeframe Analysis! How to Maximize Your Win Rate with Trend Sniper X: Key Rules & Sess
Atomic Analyst
Issam Kassas
5 (14)
Atomic Analyst — MetaTrader 4 For product questions, setup guidance, or technical support, message me directly here on MQL5. The indicator turns complex market calculations into simple visual signals, color-coded candles, trend readings, stop-loss levels, and multiple take-profit zones that traders can understand quickly and use in real market conditions. Main Trading Uses: Scalping and intraday trading: Designed for fast decision-making, clear arrows, alerts, candle colors, and structured entry
Tokyo mt4 Indicator
Vasiliy Strukov
5 (7)
Tokyo Indicator provides a clear visual overview of trend direction, potential trading signals, and market conditions. Its colour-coded, stepped trend line distinguishes bullish phases in blue from bearish phases in magenta. Matching directional arrows highlight potential buying and selling opportunities when the displayed trend changes. An integrated dashboard brings together the current signal, market bias, momentum, volatility, and signal quality in one convenient view. This allows traders t
Neuro Poseidon MT4
Daria Rezueva
4.74 (46)
Neuro Poseidon is a new indicator by Daria Rezueva. It combines precise trading signals with adaptive TP/SL levels - creating best possible trades as a result! Message me and get  Neuro Poseidon Assistant  as a gift to automize your trading process! What makes it stand out? 1. Proven profitability on all assets and timeframes 2. Only confirmed BUY and SELL signals present on the chart 3. Adaptive TP & SL levels generated by the software for each trade 4. Easy to understand - suitable for all
Smart Trend Trading System is a chart indicator for MetaTrader 4 that brings trend information, entry and exit signals, and price levels into one workspace. It combines 10+ trading tools into one system, including trend detection, reversal zones, smart cloud, trailing stop logic, support and resistance, candle coloring, alerts, and multi-timeframe analysis. The system is designed to help you trade different market conditions: Trending markets: Identify the main trend, detect pullbacks, follow mo
GoldRush Trend Arrow Signal V1.6 The GoldRush Trend Arrow Signal indicator V1.6 continues to provide precise, real-time trend analysis tailored for high-speed, short-term scalpers in XAU/USD , but it now has additional features and improved efficiency and reliability. Built specifically for the 1-minute time frame, this tool displays directional arrows for clear entry points, allowing scalpers to navigate volatile market conditions with confidence. The indicator consists of PRIMARY and SECONDARY
Break and Retest Hunter MT4 is a powerful MetaTrader 5 indicator designed to automatically identify support and resistance levels, breakout structures, and potential retest opportunities in real time. Bonus Indicator: After purchasing Break and Retest Hunter , contact me to receive Trade Indicator Assistant EA completely free as a bonus utility. $65 for the next 10 copies . Next price is $120.  Combining adaptive market analysis, clear BUY/SELL signals, Fibonacci-based profit targets, and a pre
Miraculous Indicator Binary & Forex v3 StrategySafe Miraculous Indicator Binary & Forex v3 StrategySafe is a professional trading indicator designed for traders who want clear signals, powerful confirmation tools, and a structured way to analyze both Binary and Forex markets. This version brings a stronger trading experience with advanced dashboards, GANN Law analysis, Square of 9 levels, angle confirmation, and a clean StrategySafe approach that helps traders filter stronger setups instead of e
PRO Renko System
Oleg Rodin
5 (31)
PRO Renko System is a highly accurate trading system specially designed for trading RENKO charts. The ARROWS and Trend Indicators DO NOT REPAINT! The system effectively neutralizes so called market noise giving you access to accurate reversal signals. The indicator is very easy to use and has only one parameter responsible for signal generation. You can easily adapt the tool to any trading instrument of your choice and the size of the renko bar. I am always ready to provide extra support to help
Currency Strength Wizard is a very powerful indicator that provides you with all-in-one solution for successful trading. The indicator calculates the power of this or that forex pair using the data of all currencies on multiple time frames. This data is represented in a form of easy to use currency index and currency power lines which you can use to see the power of this or that currency. All you need is attach the indicator to the chart you want to trade and the indicator will show you real str
Elliott Wave Trend was designed for the scientific wave counting. This tool focuses to get rid of the vagueness of the classic Elliott Wave Counting using the guideline from the template and pattern approach. In doing so, firstly Elliott Wave Trend offers the template for your wave counting. Secondly, it offers Wave Structural Score to assist to identify accurate wave formation. It offers both impulse wave Structural Score and corrective wave Structure Score. Structural Score is the rating to sh
Gann Made Easy
Oleg Rodin
4.84 (172)
Gann Made Easy is a professional and easy to use Forex trading system which is based on the best principles of trading using the theory of W.D. Gann. The indicator provides accurate BUY and SELL signals including Stop Loss and Take Profit levels. You can trade even on the go using PUSH notifications. PLEASE CONTACT ME AFTER PURCHASE TO GET TRADING  INSTRUCTIONS   AND GREAT EXTRA INDICATORS  FOR FREE! Probably you already heard about the Gann trading methods before. Usually the Gann theory is a
Liquidity Scalper System: a liquidity-based trading system in indicator form. Most indicators only show an arrow, and the trader then has to decide where the stop goes, where the target is and whether the signal can be trusted at all. Liquidity Scalper System covers the full trade cycle: it finds liquidity pools, gives a signal when they are broken, immediately calculates Entry, Stop Loss and three targets, and shows statistics and out-of-sample test results on the panel. The system picks its o
Trend Catcher ind
Ramil Minniakhmetov
5 (11)
TREND CATCHER INDICATOR Trend Catcher Indicator analyzes market price movements, using a combination of the author’s proprietary and customized adaptive trend-analysis indicators.  It identifies the true market direction by filtering out short-term noise and focusing on underlying momentum strength, volatility expansion, and price structure behavior.  It also uses a combination of smoothing and trend-filtering customized indicators such as moving averages, RSI, and volatility filters.   Real ope
M1 Sniper
Oleg Rodin
4.97 (30)
M1 SNIPER  is an easy to use trading indicator system. It is an arrow indicator which is designed for M1 time frame. The indicator can be used as a standalone system for scalping on M1 time frame and it can be used as a part of your existing trading system. Though this trading system was designed specifically for short-term trading, it still can be helpful for all traders. This trading system can be used with any forex pair and time frame, though lower time frames are recommended from M1 up to M
Trading Special –40% OFF Best Solution for any Newbie or Expert Trader! This Indicator is a unique, high quality and affordable trading tool because we have incorporated a number of proprietary features and a new formula. With only ONE chart you can read Currency Strength for 28 Forex pairs! Imagine how your trading will improve because you are able to pinpoint the exact trigger point of a new trend or scalping opportunity? User manual: click here That's the first one, the original! Don't buy a
Fibonacci Trend Marker   — is a trend indicator that analyzes the behavior of the current candle relative to the High-Low (HL) range of previous candles using Fibonacci retracement levels. It visually tracks trend strength, signaling potential weakening or reversal through a change in candle color. Features: Designed for trend-focused traders, it helps quickly identify trend changes based on Fibonacci levels. Effective on any timeframe with sufficient market volatility, when a sequence of 3–5 c
Supply and Demand Dashboard PRO
Bernhard Schweigert
4.81 (21)
Trading Special – 30% OFF This dashboard is a very powerful piece of software working on multiple symbols and up to 9 timeframes. It is based on our main indicator (Best reviews:   Advanced Supply Demand ). The dashboard gives a great overview. It shows: Filtered Supply and Demand values including zone strength rating, Pips distances to/and within zones, It highlights nested zones, It gives 4 kind of alerts for the chosen symbols in all (9) time-frames. It is highly configurable for your pers
AW Prime Oscillator
AW Trading Software Limited
5 (1)
A combination of two oscillators. The first one displays the entry points, the second shows the current trend . The indicator can display oscillator signals by arrows in two modes, all fast oscillator signals or signals only in the direction of the current trend. It has a multi-timeframe panel and three types of signal notifications. Benefits: Suitable for day and scalping trading Trend filtering Simple and sensitive setup Multi-timeframe panel Suitable for integration into an advisor. Works on
Currency Pulse — currency strength ranking board for MetaTrader 4 What it is for Currency Pulse shows, in one compact panel on your chart, which currencies are strong and which are weak right now, on several timeframes at once. From that ranking the indicator points out the pairs with the widest divergence between currencies: buy the strong one, sell the weak one. The indicator does not depend on the symbol of the chart it is attached to. MT5 -version:  https://www.mql5.com/en/market/product/200
M1 Arrow
Oleg Rodin
4.81 (21)
M1 Arrow is an indicator which is based on natural trading principles of the market which include volatility and volume analysis. The indicator can be used with any time frame and forex pair. One easy to use parameter in the indicator will allow you to adapt the signals to any forex pair and time frame you want to trade. Besides the main algorithm which is based on buy and sell signals, the indicator also has multiple built-in extra strategies which you can choose in the inputs. These strategies
Identify over 30 candlestick patterns with precision This indicator recognizes over 30 Japanese Candlestick Patterns and highlights them beautifully on the chart. It is simply one of those indicators price action traders can't live without. [ Installation Guide | Update Guide | Troubleshooting | FAQ | All Products  ] Boost your technical analysis overnight Detect japanese candlestick patterns easily Trade reliable and universal reversal patterns Hop onto established trends safely using continua
Quantum Naked SMC Prime is a streamlined Smart Money Concepts indicator designed for traders who prefer a clean chart, structured market analysis and clear visual trade setups without unnecessary complexity. The indicator combines market structure, liquidity behavior, institutional zones and confirmation logic into a compact analytical framework. Instead of flooding the chart with technical indicators, Quantum Naked SMC Prime focuses on the core elements of price action and Smart Money Concepts
DayTrader PRO MT4
Davit Beridze
4.6 (10)
DayTrader PRO (Buy DayTrader PRO and Get another Paid Self Optimizing indicator for Free as Bonus) MT5:  https://www.mql5.com/en/market/product/186222 DayTrader PRO   is an advanced trading indicator that combines John Ehlers' Laguerre Filter with a powerful Auto-Optimization Engine. Instead of using fixed parameters, the indicator automatically searches for the best settings based on recent market conditions, helping you adapt to changing volatility without constant manual adjustments. The in
Quantum Trend Sniper MT4
Ian Andrew Nicholson
5 (1)
Quantum Trend Sniper PRO for MetaTrader 4 Quantum Trend Sniper PRO is a professional-grade MT4 indicator built for traders who want selective entries, clear trade structure, and live on-chart decision support . This is not a basic buy/sell arrow tool. It is a complete trading workflow that helps you identify higher-quality setups, project the full trade structure, monitor progression through multiple profit targets, and review trade behavior directly on the chart. Designed for traders who value
Scalper Inside PRO
Alexey Minkov
4.74 (69)
Scalper Inside PRO helps you read the intraday trend and plan a trade before you enter the market. It is built around three exclusive strategies for a sharper read of the market. The moment a signal appears, the indicator evaluates market direction and calculates the key levels, so you see the potential entry, the expected stop-loss and several profit-taking levels in advance. Detailed performance statistics show how different instruments and strategies performed in history and help you pick ass
Gold Targets are the best trend indicator. The indicator's unique algorithm analyzes the movement of the asset price, taking into account factors of technical and mathematical analysis, determines the most profitable entry points, issues a signal in the form of an arrow and the price level (BUY Entry / SELL Entry) to open an order. The indicator also immediately displays the price level for Stop Loss and five price levels for Take Profit. ATTENTION: The indicator is very easy to use. Install t
The Extreme point indicator helps in determining the probable price reversal points on the chart. The indicator facilitates the search for points to enter the market with greater accuracy. The indicator displays certain impulses, after which there is a high probability of the price continuing its movement in the same direction. The indicator can be used in conjunction with other indicators for a more accurate detection of the position entry points. The indicator can also be used independently. F
JSL Orderflow Footprint turns every candle into a price ladder that shows how much volume traded on the bid and on the ask at each price level. It highlights diagonal imbalances, stacked imbalance zones, absorption at candle extremes, cumulative delta (CVD), delta divergence and the daily session volume profile, then combines five of these order-flow conditions into a 0–100 confluence score. A signal is only issued on bar close when the score is high, clearly one-sided and confirmed by the candl
More from author
HIZOA Dynamic Support & Resistance is a clean, adaptive market-structure indicator for MetaTrader 4, designed to visualize dynamic support and resistance across multiple market horizons. Instead of displaying only one fixed support and resistance calculation, the indicator continuously analyzes three different historical lookback periods. This creates three dynamic resistance levels and three dynamic support levels, allowing traders to view short-, medium- and longer-term market structure direc
HIZOA Candle Statistics Objective Candle Structure, Market Activity and Pattern Recognition HIZOA Candle Statistics is a compact informational and educational indicator that provides a clear numerical view of the current candle and the most recently closed candle. Instead of producing buy or sell signals, the indicator helps traders understand the structure and relative activity of the candles currently shaping the market. By displaying the proportions of the candle body, upper wick and lower w
FREE
HIZOA SPREAD AND TIMER PANEL is a clean and practical information utility for MetaTrader 4. It displays the current spread, rolling average spread, candle closing time and daily closing time directly on the chart. The panel automatically adapts to the active symbol and timeframe, allowing traders to monitor essential spread and timing information without unnecessarily covering important chart areas. HIZOA Spread and Timer Panel is available completely free of charge. MARKET CLOSE AWARENESS HIZOA
FREE
HIZOA RSI Divergence Oscillator  is a visual market-analysis tool designed to automatically detect and display regular bullish and bearish RSI divergences between price and momentum. Divergence can be an important indication that the relationship between price and momentum is changing. However, during active trading it is surprisingly easy to overlook — especially when monitoring multiple markets or timeframes. HIZOA RSI Divergence Oscillator continuously analyzes price structure and RSI behavi
HIZOA Clean Volume Flow provides a clear visual representation of directional volume pressure. No complicated dashboard and no unnecessary signals. The indicator presents the information in a clean and easy-to-read format: Green bars above zero indicate bullish volume pressure. Red bars below zero indicate bearish volume pressure. Bar height and color intensity reflect the strength of the current tick volume compared with its local average. The status display shows the symbol, timeframe, volume
HIZOA FED Events is an informational economic-event awareness utility for MetaTrader 4. The utility connects to official Federal Reserve and New York Fed sources, retrieves the available event information and displays important scheduled events directly on the chart through compact information boxes, event lines and volatility warnings. Instead of repeatedly checking external calendars, traders can immediately see when significant scheduled events may affect market conditions. Informational Uti
HIZOA Volume Reversal Flow Volume Pressure, Reversal Development and Directional Confirmation HIZOA Volume Reversal Flow is an analytical volume oscillator designed to visualise bullish and bearish pressure, identify developing volume reversals and reduce distracting counter-flow noise during clearer directional conditions. Instead of treating every opposing volume bar as equally meaningful, the indicator evaluates volume intensity, directional flow, price behaviour and multi-stage follow-thr
Filter:
No reviews
Reply to review