Yesterday For Today D
- Indicators
-
Daniele Fughelli
 Hi! I'm Daniele. I've been developing trading EAs for more than 4 years. Everything I create is based upon years of data and stress-tested by me. I always use out-of-sample data for final validation. For any questions, message me, and I'll answer you as soon as possible. Making EAs takes effort and
 - Version: 1.0
- Activations: 10
Every trading day starts with two levels that already matter before the first intraday setup even appears: yesterday's High and Low.
Highs and Lows are among the most widely used levels to define a range, whether you want to ride a breakout or identify a valid area for a reversal. But what actually defines a good High and a good Low mathematically? You could use a certain number of bars or a specific time range, but there is one price range that carries real relevance every single day: the range of the previous day's candle.
That's why I created "Yesterday For Today D", my first published indicator after releasing only Expert Advisors so far!
You may wonder why I decided to create an indicator instead of another EA, and the answer is quite simple. I know many of you enjoy the excitement of trading manually, that feeling of anticipation when you are about to click the Buy or Sell button. So, I decided to create something that does not force you to stay in front of the screen all day, while still letting you experience that thrill when the right moment comes.
"Yesterday For Today D" does exactly that.
Open the chart, see yesterday's key range instantly, and know whether the market is coming from a contraction.
As you can see from the pictures below, the indicator displays two horizontal lines marking the High and Low of the previous day's candle, together with their exact price levels, on any timeframe below D1.
But the indicator does not end there!
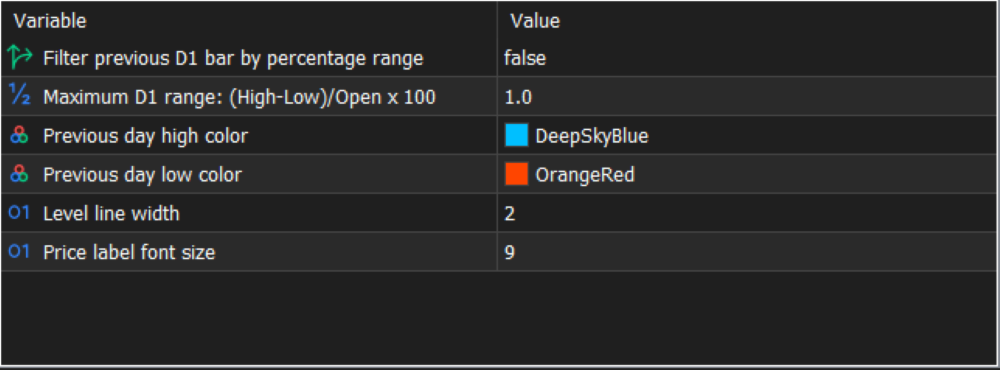
You can also activate a filter based on the percentage range of the previous day's candle, allowing you to filter out any range exceeding the value you choose.
Furthermore, an internal calculation can trigger the words "High Chance" above and below the two lines. When this happens, it means that price experienced a contraction in the past days, resulting in a higher chance of a strong reaction occurring.
This gives you a quick visual framework for identifying the previous day's range, filtering out oversized daily candles, and spotting contraction conditions without having to calculate anything manually.
I hope you will enjoy using it as much as I do. If you have any questions, feel free to message me privately or write in the comment section, and I will answer as soon as possible.
Further additions may also be introduced in the future based on specific requests that I will personally evaluate.
From my personal experience, I find this indicator particularly interesting on GOLD (XAUUSD), although it can be used on any financial instrument.
If manual trading is not your thing and you prefer something fully automated, you can also check out my Expert Advisors by clicking on my name.
As always, past performance is not indicative of future results. Trading involves risk, and you should only trade with capital you can afford to lose.