KD Mtf VWAP

  • Indicators
  • Dien Du Khanh Duong
    Dien Du Khanh Duong
    KD Trading System: Trade with context. Read structure. Confirm across timeframes. Plan the risk.
    ====================================================================================
  • Version: 2.2
  • Updated: 16 September 2026
  • Activations: 10

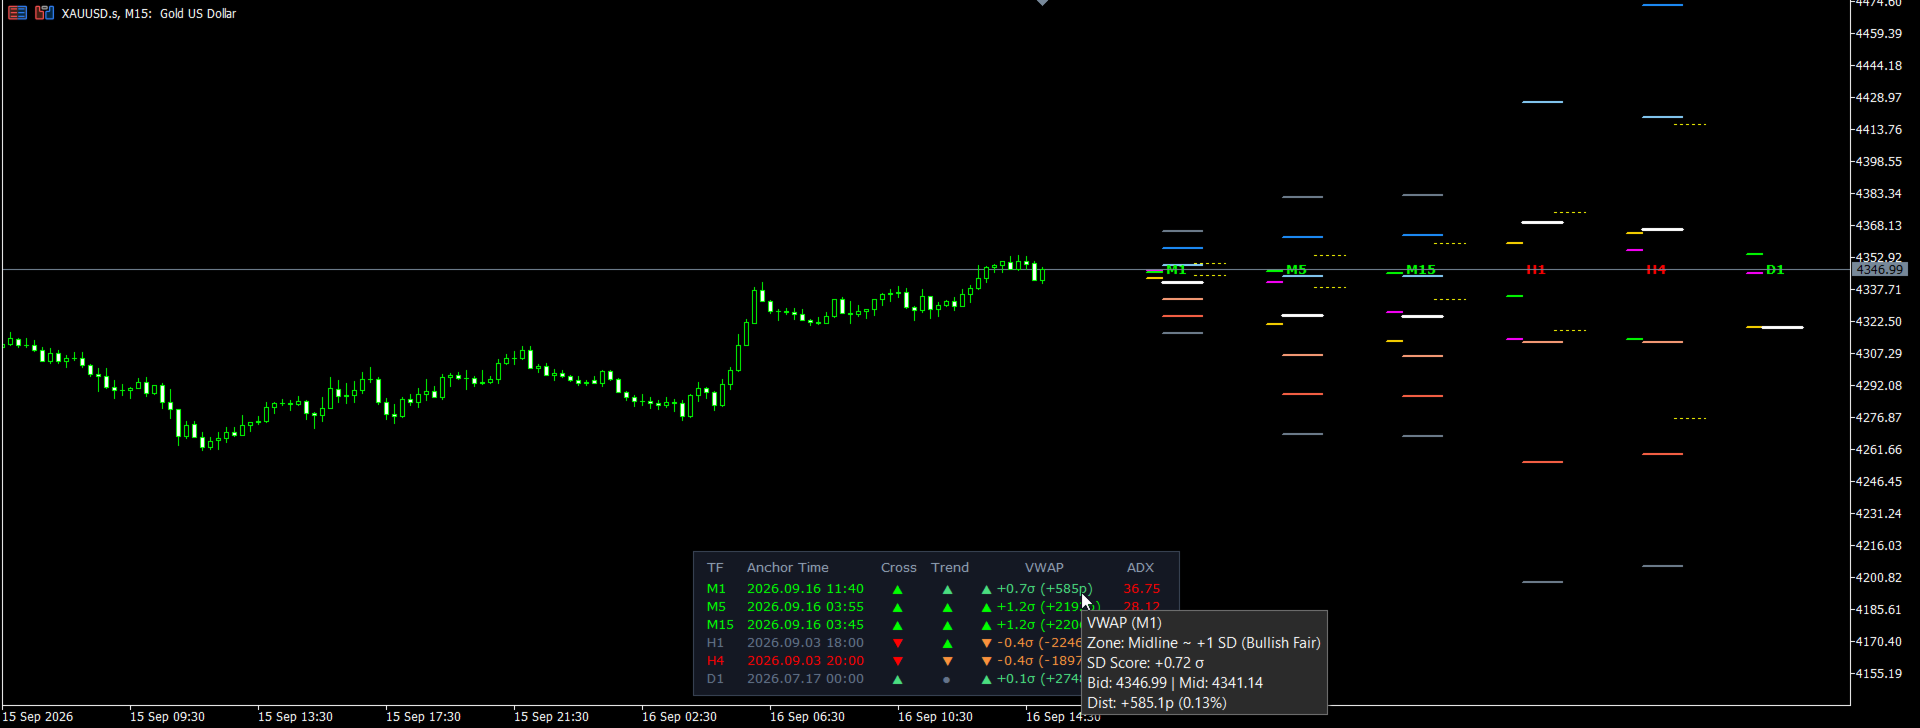
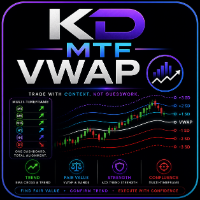
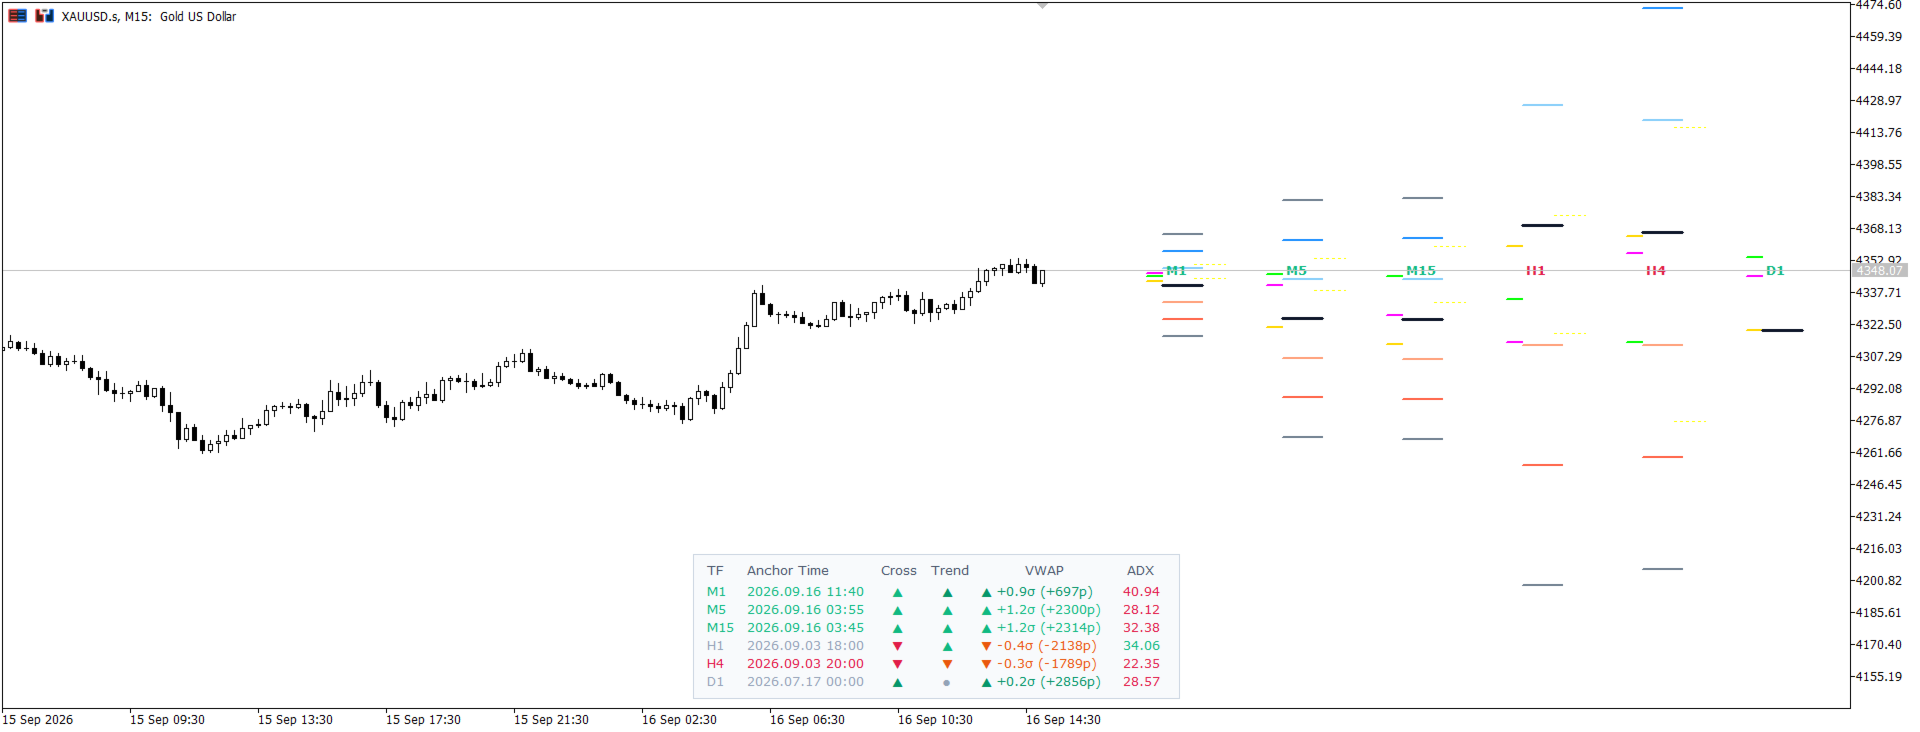
KD MTF VWAP is a Volume Weighted Average Price (VWAP) indicator for MetaTrader 5, designed for lower-timeframe traders (M1, M5, M15) and intraday momentum trading. It projects multi-timeframe Anchored VWAPs, 3-Tier Standard Deviation Bands (±1σ, ±2σ, ±3σ), EMA trend filters, and a Sigma & Pip Distance HUD onto a single chart.

VWAP is a benchmark commonly referenced in institutional and algorithmic trading. Combining multi-timeframe VWAP projections with standard deviation bands can help identify statistically extended price conditions and areas where liquidity may rebalance.

Key Features

  • Multi-Timeframe VWAP Projection: Plot and project M1, M5, M15, H1, H4, and Daily VWAP lines directly on your execution chart without switching tabs.
  • Dynamic 3-Tier Standard Deviation Bands (±1σ, ±2σ, ±3σ): Identify statistical extremes where price is mathematically overbought/oversold relative to VWAP.
  • On-Chart Heads-Up Display (HUD): A dashboard showing VWAP Standard Deviation scores (Sigma: e.g. +2.1σ ) and pip distance from VWAP across timeframes.
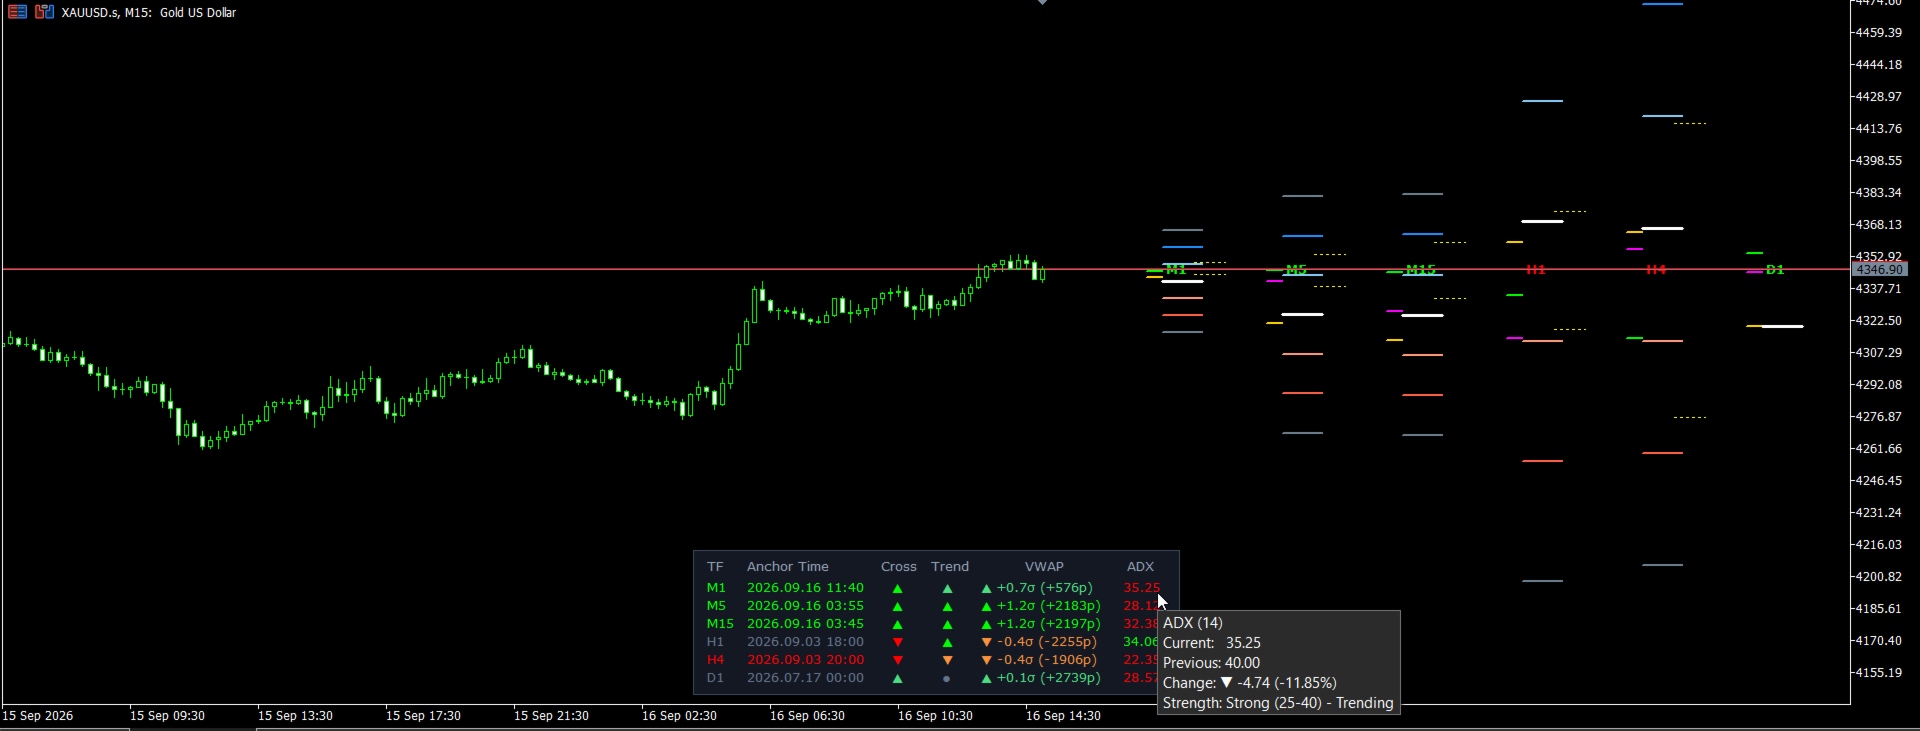
  • Triple EMA & ADX Trend Filter: Built-in EMA 9, 50, 200 crossover logic and ADX trend strength filtering to help assess the prevailing trend before trading.
  • ZigZag Structure Integration: Identifies swing highs/lows aligned with VWAP reactions.
  • Adaptive Theme System: Supports Dark Slate, Light Slate, Custom, and Auto-Detect color schemes with 6 flexible screen anchor positions.
  • Optimized Performance: Buffer caching is used to reduce lag during fast market conditions.

Synergy with the KD Trading System

KD MTF VWAP is the 4th pillar — a volume and fair-value reference within the system:

  1. KD Ultimate SMC: Maps structure shifts (BOS/CHoCH), Order Blocks and Liquidity Pools that this tool's VWAP reactions can be compared against.
  2. KD SMC Mini Charts: Displays higher/lower-timeframe structural context alongside this tool's VWAP lines.
  3. KD Auto SLTP: Can set a Stop Loss and Take Profit once this tool's reading supports an entry.
  4. KD MTF VWAP (This Tool): Provides institutional volume benchmark levels and Standard Deviation reference points for M1/M5 entries.
  5. KD MTF Candle Timer: Can be used to wait for bar closure before acting on this tool's bands.
  6. KD HTF Candles: Higher-timeframe candlestick context around VWAP reactions.
  7. KD MTF Dashboard: Can be used to check whether the trend is strong or ranging before treating a Standard Deviation Band touch as a reversal zone.

Practical Use Cases

Use Case 1: The Mean Reversion Reading (M1 / M5)

  • Setup: Price moves away from the Session VWAP and reaches the +2.0σ or +3.0σ Standard Deviation Band while inside a KD Ultimate SMC Bearish Order Block.
  • In practice: The Sigma HUD shows ≥ +2.0σ with ADX showing momentum weakening.
  • Purpose: Highlights a statistically extended price condition, with the central VWAP line (Mean) and a stop level from KD Auto SLTP as reference points for a trader to evaluate.

Use Case 2: The VWAP Trend Pullback (M5 / M15)

  • Setup: Price is above EMA 50 & 200 (an uptrend). Price pulls back to the M15/H1 VWAP line or -1.0σ Band resting inside a bullish Fair Value Gap.
  • In practice: A bullish wick forms at the VWAP line.
  • Purpose: Highlights a pullback to a reference level within an existing uptrend, with the +2.0σ upper band and the previous Swing High as additional reference points.

User Settings & Customization

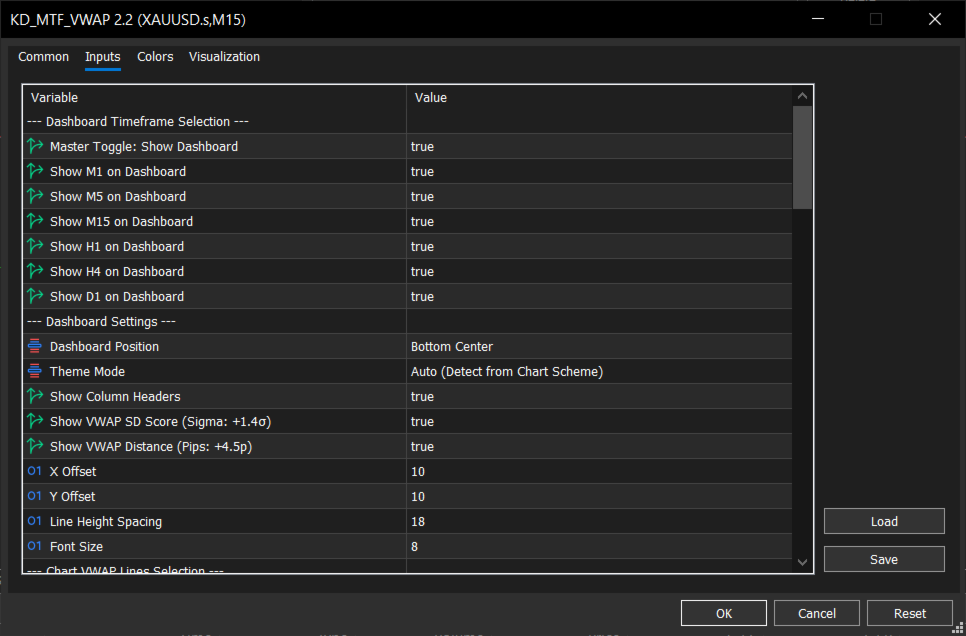
  • Dashboard Timeframes: Freely toggle M1, M5, M15, H1, H4, D1 on the HUD.
  • Chart VWAP Lines: Select which timeframe VWAP projection lines to display on the chart.
  • SD Band Multipliers: Customize Band 1 (1.0σ), Band 2 (2.0σ), and Band 3 (3.0σ).
  • Strategy Filters: Adjust EMA Fast (9), EMA Trend (50), EMA Slow (200), ATR Period (14), and ADX Period (14).
  • Visuals & HUD: Customize HUD corner anchor, theme mode, font size, line thickness, and color scheme.
    Recommended products
    White Weis Volume Ticks
    Ricardo Almeida Branco
    5 (4)
    White Weis Volume This indicator shows the sum of the volume in each wave, bulish or bearish, as idealized by David Weis , but it brings an important addition , which is the marking of the bar with the highest volume of the wave (White Bar)! In coding the indicator, it was sought to optimize the code to require minimal processing during use and not to overload mt5. The indicator can be used for pre-trading analysis and study, where the trader analyzes possible points of support and resistance
    Desi Bulls PA King Pro
    Muhammad Bilal Hussain Khan Muhammad
    Desi Bulls PA King Pro — Pure Naked Price Action Sniper Indicator Desi Bulls PA King Pro is an institutional-grade, 100% NON-REPAINTING Naked Price Action indicator designed for precision scalping on Gold (XAUUSD) and Bitcoin (BTCUSD) on the M5 and M15 timeframes. Unlike conventional indicators that clutter your chart with lagging moving averages, RSI, or stochastics, PA King Pro uses pure candlestick geometry, fractal liquidity sweeps, and macro trend flow to identify high-probability instit
    Institutional Tick Engine Pro: Tick Velocity & Heatmap Analysis Institutional Tick Engine Pro is a technical analysis suite designed to process raw Tick Data directly from the broker. It synthesizes Order Flow metrics including Velocity, Heatmaps, and Micro-Structure patterns without requiring Level 2 (DOM) data feeds. The tool analyzes the speed and aggression of price movements, allowing traders to distinguish between slow price drifts and high-momentum impulses. Key Features 1. Tick Velocity
    Mean Volume indicator for MT5
    Renaud Herve Francois Candel
    Mean Volume Most indicators are based on price analysis. This indicator is based on volume. Volume is overlooked piece of information in most trading systems. And this is a big mistake since volume gives important information about market participants. Mean Volume is an indicator that can be used to spot when volume is above average. It usually means that institutional traders are active. Peak in volume can be used to confirm an entry since increased volume can sustain the move in one or anot
    Boom 600 Precision Spike Detector The Boom 600 Precision Spike Detector is your ultimate tool for trading the Boom 600 market with precision and confidence. Equipped with advanced features, this indicator helps you identify potential buy opportunities and reversals, making it an essential tool for traders aiming to capture spikes with minimal effort. Key Features: Non-Repainting Signals: Accurate, non-repainting signals that you can trust for reliable trading decisions. Audible Alerts: Stay on t
    VolumeDeltaWaves
    Stanislav Korotky
    This indicator is an extended implementation of Weis waves. It builds Weis waves on absolute volumes (which is the classical approach) or delta of volumes (unique feature) using different methods of wave formation and visualization. It works with real volumes, if available, or with tick volumes otherwise, but also provides an option to use so called "true volume surrogates", as an artificial substitution for missing real volumes (for example, for Forex symbols), which was introduced in correspo
    Weis Wave Double Side
    Eduardo Da Costa Custodio Santos
    The Weis Wave Bouble Side Indicator for MT5 is part of the toolkit (Wyckoff Academy Wave Market) The Weis Wave Bouble side Indicator for MT5 was created based on the already established Weis Wave created by David Weis. The Weis Wave Double Side indicator reads the market in waves as it was done by R. Wyckoff in 1900. It helps in the identification of effort x result, cause and effect, and Supply and demand Its differential is that it can be used below the zero axis, further improving plus operat
    WAPV Weis Wave Chart Forex
    Eduardo Da Costa Custodio Santos
    The Weis Wave Chart Forex for MT5 is a Price and Volume indicator. The Price and Volume reading was widely disseminated through Richard Demille Wyckoff based on the three laws created by him: Supply and Demand, Cause and Effect and Effort vs. Result. In 1900 R.Wyckoff already used the wave chart in his analyses. Many years later, around 1990, David Weis Automated R. Wyckoff's wave chart and today we bring you the evolution of David Weis' wave chart. It shows the amount of Volume and the amount o
    Weis Wave Double Side Alert
    Eduardo Da Costa Custodio Santos
    The Weis Wave Bouble Side Indicator for MT5 is part of the toolkit (Wyckoff Academy Wave Market) The Weis Wave Bouble side Indicator for MT5 was created based on the already established Weis Wave created by David Weis. The Weis Wave Double Side indicator reads the market in waves as R. Wyckoff did in 1900. It helps in the identification of effort x result, cause and effect, and Supply and demand Its differential is that it can be used below the zero axis and has a breakout alert showing Who is s
    Fixed Volume Profile
    Carlos Pascual Perez Maturano
    This indicator, titled "Fixed Volume Profile.mq5", is a custom tool for MetaTrader 5 (MQL5) designed to calculate and display a Volume Profile over a user-defined fixed time range. The Volume Profile shows the distribution of trading volume at different price levels during a specific period, helping to identify areas of high activity (such as Points of Control or POCs) and volume-based support/resistance areas. Main Functionality: Interactive Range: The indicator creates two vertical lines on
    FREE
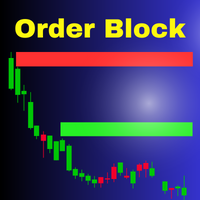
    Introducing the Order Block Indicator , the pinnacle of trading technology. Order blocks, the large cluster of buy or sell orders placed by institutional traders, significantly influence market direction. They form at critical price levels and can act as robust support and resistance zones. Our cutting-edge indicator allows you to harness the full potential of these influential market dynamics, providing a never-before-seen level of precision and customization. Here's why this tool stands apart:
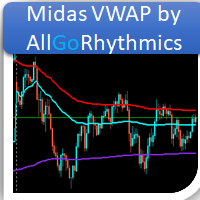
    Midas VWAP
    Paulo Henrique Faquineli Garcia
    4 (2)
    Volume Weighted Average Price (VWAP) is a trading benchmark commonly used by Big Players that gives the average price a Symbol has traded throughout the day. It is based on both Volume and price. This indicator contains Daily VWAP and MIDAS' VWAP, which means you are able to anchor the beggining of MIDAS' calculations and, therefore you will be able to use this methodology to study price versus volume moves after anchor point. You will be able to anchor up to 3 HIGH MIDAS VWAP's and 3 LOW. Wish
    FREE
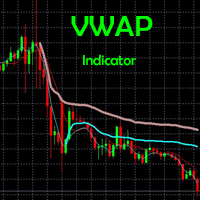
    VWAP Deviation Indicator The VWAP Deviation Indicator is a volume-weighted price analysis tool designed to identify the current price's relationship to a dynamically calculated VWAP basis and its deviation levels. Unlike a simple moving average, this indicator incorporates tick volume weighting , allowing the VWAP calculation to give greater importance to price levels associated with higher trading activity. The indicator displays a central VWAP Basis together with 2x and 3x deviation bands ,
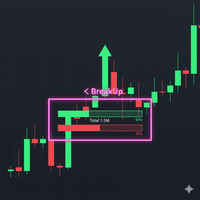
    Breakout Boxes with Volume Pressure This indicator automates the identification of key consolidation zones (Supply and Demand) based on Market Pivots and Volatility (ATR). Unlike standard support/resistance tools, this indicator provides a unique   Volume Pressure Analysis   inside every box, giving you insight into the battle between Buyers and Sellers before a breakout occurs. Key Features Automated Supply & Demand Zones:   Automatically detects significant Pivot Highs and Lows to draw dyna
    GRat Clusters  is an indicator that shows various data in the form of clusters on a price chart: volume, delta, ratio of sales and purchases, etc. It allows you to visually see the market profile in real time and on history at a given depth. Capabilities 1.8 types of cluster data: volume, delta, purchases   and sales , volume and delta, imbalance between sales and purchases , volume profile, delta profile, buy and sell profile. 2. A cluster period can be either any available in MT5 timeframe or
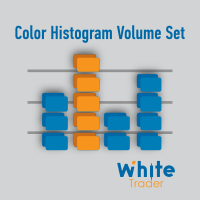
    Do you use volume in your reading of the market? Certainly many traders use it, and do not imagine operating without it. The Color Histogram Volume Set indicator allows the user to choose the value that he considers interesting to monitor. When you pass this you will have visual confirmation and if you want you will also have the audible alert that is given by the indicator. Of course, there are other ways to try to find a high volume, such as assessing whether the volume is above av
    Volume Trio Multi is a three-layer market-structure tool for MetaTrader 5: session Volume Profile (POC, VAH/VAL, Value Area), a CVD volume-pressure histogram with a strict Regular divergence engine, and anchored VWAP with standard-deviation bands — extended with a watchlist scanner that runs all three across the symbols in your Market Watch. This is the Pro edition of my free indicator, Volume Trio. The base engine is identical, so this page describes only what Pro adds. For the three layers the
    VWAP Indicator
    LUC JACOBUS A VERHEECKE
    4.14 (28)
    Volume Weighted Average Price (VWAP) The volume weighted average price (VWAP) is a  trading   benchmark  used by traders that gives the average price a security has traded at throughout the day, based on both volume and price. It is important because it provides traders with insight into both the trend and value of a security. This indicator VWAP V2 is free and is the manual version of the extended Easy VWAP indicator (30 Euro), where the date and time properties are automatically entered. With
    FREE
    Tik Tok
    Ivan Simonika
    The Tik Tok indicator was created on the basis of the original extreme search indicators, the indicator is well suited for determining a reversal or a big sharp jerk in one direction, thanks to it you will know when this happens it will notify you when a blue dot for buying red for sale appears. It basically uses the process of detecting the rate of change in price growth and allows you to find entry and exit points from the market. fundamental technical indicator that allows you to assess the
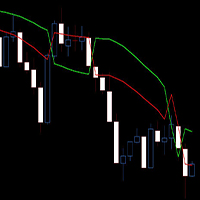
    Here I present you this awesome indicator I made. This is a nique combination witch puts you in the same level as MM's. So you can surf a lot of waves and identify the rally time, breakouts, and the perfect time to get in the market. ---- The SSL Channel is a great all-rounder based on 2 Simple Moving Averages, one of recent Highs, one of recent Lows. The calculation prints a   channel   on the chart consisting of 2 lines. This strategy gives a Long signal when price closes above the top of thes
    Introduction The Wave Trend Oscillator Indicator for MT5 is one of the well known indicators in the market, helping traders find strong entry points into the market. Like any other MetaTrader 5 indicator , it can produce both good and bad signals, but the number of accurate buy/sell signals is significantly higher than the weak ones. This makes it a powerful tool for improving your forex trading strategy , whether you are a beginner or an advanced trader. How does this indicator work? This indic
    VWAP Bands
    Rafael Caetano Pinto
    This indicator uses VWAP and projects this VWAP into up to 3 levels, shifted by a percentage of the chart's symbol. How to configure: Choose the symbol and desired graphic time Set the start time of the symbol (in bovespa, WIN and WDO start at 9 o'clock). This time is used as the cutoff reference for VWAP. Check which VWAP period fits the chart better: Ideally, a period when VWAP is not too distant from the chart Set percentage levels: Ideally, you should set levels based on history, so that le
    VWAP Z-Score (Rolling) Positive values indicate price trading above VWAP, while negative values indicate price trading below VWAP. Typical Use Cases Mean-reversion strategies Overbought / oversold detection VWAP-based statistical analysis Confirmation tool for discretionary or algorithmic trading Risk-aware trade entries and exits Notes Uses tick volume for VWAP weighting (standard for Forex symbols). The indicator does not repaint. Designed for analytical and decision-support purposes only.
    GDXM Session Open Line PO3
    Gustavo Barros Alexandre D Almeida
    5 (1)
    This indicator is a specialized utility for traders following the ICT (Inner Circle Trader) methodology, specifically focusing on the Power of Three (PO3) concept: Accumulation, Manipulation, and Distribution. The ICT PO3 Open Line automatically identifies and plots critical opening prices from specific market sessions, allowing you to visualize price action relative to the "True Open" of the day or specific sessions. Key Features 1. Daily PO3 Open Levels The indicator tracks and draws horizonta
    FREE
    Market session with fibonacci
    Batsukh Sumchin Khuyagbaatar
    This indicator is the most common indicator we use every day, including our most used strategies, ICT and SMC, Stop loss limits and liquidity limits that occur at the opening and closing hours of exchanges, as well as the volume of exchanges that have been worked on by Fibonacci and zooming in and out, and the most common actions you want to see automatically. Once you learn to analyze all types of trading with this indicator, I am 100% sure that you will not be able to work without this indicat
    The VWAP Rejection Signals Indicator: A Comprehensive Overview The Genesis of a Precision Trading Instrument This isn't just another indicator cluttering your chart. The VWAP Rejection Signals Indicator represents a sophisticated fusion of institutional-grade volume analysis, session-based anchoring, and structural price action confirmation. It's a complete trading ecosystem designed to identify high-probability setups where the convergence of multiple independent factors creates a compelling
    Eternal Spike Detector
    Emma-ekong Ben Eshiet
    N/B: All our product purchase comes with our free ‘’DAILY   SCALPER EA’’ -   bit.ly/4qlFLNh Whatsapp Developer for yours after successful purchase Eternal Spike Detector Pro - M5 Mastery System   HOW TO TRADE THIS SYSTEM   TRADING RULES For CRASH 500/900/1000: SELL SETUP: · Wait for RED DOWN ARROW to appear · Enter SELL at the close of the M5 candle where arrow appears · Stop Loss: 1.5x ATR above the entry high · Take Profit: 2-3x ATR below entry · Only trade maximum 7 signals per day
    NQX Range Edge Hook Calm
    Marcel De Oliveira Farias
    NQX Range Edge Hook Calm is a signal indicator for MetaTrader 5: range edge hook signals (it only signals in calm conditions, when volatility is below its recent average). Proprietary NQX logic that detects price leaving the edge of its recent range, confirmed by the candle. It only signals in calm conditions, when volatility is below its recent average. It draws the suggested entry, a short stop and long targets (3:1, 5:1, 10:1, up to 20:1 on swing); you decide. What it draws on the chart - An
    Percentage Range Consolidation O Percentage Range Consolidation é um indicador poderoso projetado para identificar zonas de consolidação de preço com base em variações percentuais ao longo do tempo. Ideal para traders que buscam detectar áreas de compressão de volatilidade e possíveis pontos de ruptura (breakout). Principais características: Identifica até 3 zonas de consolidação simultâneas, cada uma configurável de forma independente. Cálculo baseado na variação percentual entre a máxima e mín
    LiquidityLabs FVG Pro Intraday LiquidityLabs FVG Pro Intraday is a professional Fair Value Gap and liquidity-analysis indicator designed for shorter-duration intraday opportunities. The indicator continuously analyzes market structure, liquidity behavior, directional conditions and Fair Value Gap activity to identify potential intraday setups and display a complete trade plan directly on the MetaTrader 5 chart. Rather than simply marking every Fair Value Gap, LiquidityLabs FVG Pro Intraday filte
    Buyers of this product also purchase
    Trend Sniper X
    Sarvarbek Abduvoxobov
    4.86 (44)
    Trend Sniper X is a multi-timeframe trend-following indicator for MetaTrader 5 that helps traders identify trend direction and potential reversal points with clarity and precision. for MT4: https://www.mql5.com/en/market/product/193245 Price Information: The current price is promotional and is subject to change as upcoming updates and new features are released. Bonus Offer: To get the FREE Auto-Trade Assistant EA for this indicator, please message the author after purchasing. Code2Profit Channe
    A new King in town - Indicator + Order management indications(tp1+tp2+tp3) + Optional Telegram Signal sender   INCLUDED (FREE) + Bonus EA Robot ( FULL TRADING  and SIGNAL SYSTEM ) Our best EA for Gold: Gold Slayer TRY > Reversion Queen  Expert advisor >JOIN Community Channel < NEW Free Automation EA link < click here ( disclaimer: this is new and still on testing and phase , use at your risk on demo) Free Telegram Bridge < click here  This indicator includes an advanced Strategy, a trading sys
    Entry Points Pro shows you where to enter, where to put the stop and what lot to trade — before you place the order. PRICE Now 199 USD: 8 copies at this price, then 249 USD. The final price is 349 USD. I make my money trading the markets, and I show it, so I don't need to sell this indicator to everyone. It is a tool for traders who think for themselves, not a magic button. No breakout, no trade. A gray arrow is a cancelled signal: price did not break the signal candle, so there was no entry
    M5 Sniper
    MeanFX
    5 (4)
    Get your trading edge in the line of sight M5 Sniper   is a new indicator by MeanFX. It combines   precise trading signals   with   adaptive TP/SL levels   - creating best possible statistical trades as a result! The price increases every 5 purchases, the next price is 79$ Message me after purchase to receive tips/guide and bonus EA plus trading methodology Auto Optimisation only works on LIVE chart , needs data feed >JOIN Community Channel < What makes it stand out?   Proven statistical per
    Gann Made Easy   is a professional and easy to use Forex trading system which is based on the best principles of trading using the theory of W.D. Gann. The indicator provides accurate BUY and SELL signals including Stop Loss and Take Profit levels. You can trade even on the go using PUSH notifications. PLEASE CONTACT ME AFTER PURCHASE TO GET TRADING  INSTRUCTIONS   AND GREAT EXTRA INDICATORS  FOR FREE! Probably you already heard about the Gann trading methods before. Usually the Gann theory is a
    Ultra Indicator
    Ihor Otkydach
    5 (1)
    ULTRA is a technical indicator that operates on an “all-in-one” basis—it independently analyzes the market, generates trading signals, displays levels for setting stop-loss orders, and suggests when to close trades to lock in profits or minimize losses. In other words, it doesn't matter if you don't know how to analyze the market, determine levels—where to set your stop-loss—or struggle with money management. ULTRA will do all of that for you! BUYER BONUS: After purchasing the ULTRA indicator, s
    SuperScalp Pro
    Van Minh Nguyen
    4.54 (37)
    SuperScalp Pro - Professional Multi-Layer Confluence Scalping System SuperScalp Pro is an advanced scalping indicator that upgrades the classic Supertrend with multiple intelligent confirmation filters. It helps you identify higher-probability Buy/Sell opportunities while significantly reducing false signals. Clear Buy and Sell arrows appear directly on the chart, along with automatic ATR-based Stop Loss and Take Profit levels calculated in real time. After purchase, please message me on MQL5 to
    SMC Intraday Formula
    VividMind Digital Solutions
    5 (26)
    Secure the Lowest Price Today. After purchase, contact via   MQL5 inbox   to receive your buyer kit and bonus. Let's be honest first. No indicator will make you profitable on its own. If someone tells you otherwise, they're selling you a dream. Every indicator that shows perfect buy/sell arrows can be made to look flawless — just zoom into the right window of history and screenshot the winners. We won't do that. SMC Intraday Formula is a tool. It reads the market structure for you, maps the hig
    Gold Trend Coach MT5
    Cristhian Alexander Gaibor Cuasquer
    4.27 (11)
    Non-repainting buy and sell signals for gold (XAUUSD) on MetaTrader 5. Every signal comes with a stop loss and three take profits. A Smart Money Concepts filter with BOS and CHoCH, so you trade with the structure, not against it. A live Mentor on your panel that guides every step from the entry to TP3. And alerts straight to your phone and your own Telegram channel. That is Gold Trend Coach. Never trade alone again. FREE BUYER KIT with your purchase: 1. Telegram Alert Bridge: your signals go to
    Boba Analysis Suite
    Trade Ready Solutions LLC
    5 (2)
    Boba Analysis Suite Boba Analysis Suite is an analytical indicator for MetaTrader 5. It brings market structure, relevant price zones and broader market context together in a single chart view. Developed through practical experience as a trader and trading coach, it supports a structured analysis process: assessing market direction, identifying important levels and considering multiple timeframes together. Analysis in Context Individual signals gain meaning through context. Boba Analysis Suite h
    FX Power MT5 NG
    Daniel Stein
    5 (33)
    FX Power: Analyze Currency Strength for Smarter Trading Decisions Overview FX Power is your go-to tool for understanding the real strength of currencies and Gold in any market condition. By identifying strong currencies to buy and weak ones to sell, FX Power simplifies trading decisions and uncovers high-probability opportunities. Whether you’re looking to follow trends or anticipate reversals using extreme delta values, this tool adapts seamlessly to your trading style. Don’t just trade—trade
    FiboSniper Pro
    Van Minh Nguyen
    5 (4)
    FiboSniper Pro - Multi-Filter Fibonacci System with Auto SL/TP and Control Panel FiboSniper Pro is a technical indicator that combines dynamic Fibonacci Envelopes with multiple confirmation filters to generate selective Buy and Sell signals. Fibonacci levels are calculated from Moving Average and ATR, then filtered by ADX, EMA, RSI, ATR, Volume, Time and Candle structure. The indicator displays automatic ATR-based Stop Loss and Take Profit levels directly on the chart, along with an interactive
    M1 Sniper MT5
    Oleg Rodin
    5 (7)
    M1 SNIPER  is an easy to use trading indicator system. It is an arrow indicator which is designed for M1 time frame. The indicator can be used as a standalone system for scalping on M1 time frame and it can be used as a part of your existing trading system. Though this trading system was designed specifically for short-term trading, it still can be helpful for all traders. This trading system can be used with any forex pair and time frame, though lower time frames are recommended from M1 up to M
    Apex Patterns PRO Buy Indicator - Get Expert Advisor Based on it for FREE. Self-Optimizing Chart Pattern & Breakout Intelligence Traditional pattern scanners rely on fixed inputs, often underperforming when market volatility and structures shift. Apex Patterns PRO is designed to adapt to changing market conditions by combining structural chart pattern recognition, momentum filtering, and statistical self-optimization into one analytical framework. Adaptive Scanning Engine Self-Optimizing Patter
    SQN Max indicator for MT5 by ITC
    Renaud Herve Francois Candel
    Sqn Max Indicator Sqn Max is an exclusive indicator to trade the market with high effectiveness. The indicator is based on price action, volatility and trend. This indicator is as simple as possible but not too simple. The indicator can generate alerts to ease the trading process. You don't have to stay all day in front of your screen. The indicator can be used with any class of assets and with any time frame. It is possible to achieve better results trading our list of selected assets. We achi
    Adaptive Price Action Engine Buy Indicator- Get EA Based on it for FREE. Self-Optimizing Multi-Timeframe Trend & Candlestick Intelligence Markets do not behave the same way all the time—and not every price-action pattern has the same value in every market regime. Adaptive Price Action Engine is designed to adapt to changing market conditions by combining trend structure, multi-timeframe analysis, candlestick patterns, and statistical optimization into one analytical framework. Two Adaptive Mode
    Tokyo mt5 Indicator
    Vasiliy Strukov
    5 (15)
    Tokyo Indicator provides a clear visual overview of trend direction, potential trading signals, and market conditions. Its colour-coded, stepped trend line distinguishes bullish phases in blue from bearish phases in magenta. Matching directional arrows highlight potential buying and selling opportunities when the displayed trend changes. An integrated dashboard brings together the current signal, market bias, momentum, volatility, and signal quality in one convenient view. This allows traders t
    Welcome to Entry In The Zone & SMC Multi Timeframe —  COMPLETE SMC ANALYSIS SYSTEM — ALL IN ONE INDICATOR Entry In The Zone & SMC Multi Timeframe  An indicator designed for market analysis based on Smart Money Concepts (SMC), displaying Market Structure, Key Zones (Order Blocks, Supply & Demand Zones, and Fair Value Gaps), Liquidity, and real-time BUY / SELL signals. It supports both Single-Timeframe and Multi-Timeframe analysis, along with the Confluence at Zone feature, which helps you evaluat
    Divergence Bomber
    Ihor Otkydach
    4.89 (94)
    Each buyer of this indicator also receives the following for free: The custom utility "Bomber Utility", which automatically manages every trade, sets Stop Loss and Take Profit levels, and closes trades according to the rules of this strategy Set files for configuring the indicator for various assets Set files for configuring Bomber Utility in the following modes: "Minimum Risk", "Balanced Risk", and "Wait-and-See Strategy" A step-by-step video manual to help you quickly install, configure, and
    Power Candles MT5
    Daniel Stein
    4.58 (12)
    Power Candles - Self-Optimizing Strength Indicator Strength usually lives in a sub-window. The line runs below, the candle above, and your eye keeps connecting the two. Power Candles puts the strength into the candle itself, colored from dark red to dark green, so the chart reads at a glance and the sub-window stays closed. The indicator also finds its own settings for the symbol and timeframe in front of you. One click on [ Apply Best ] draws entry, Stop Loss and Take Profit at the exact prices
    Currency Strength Wizard   is a very powerful indicator that provides you with all-in-one solution for successful trading. The indicator calculates the power of this or that forex pair using the data of all currencies on multiple time frames. This data is represented in a form of easy to use currency index and currency power lines which you can use to see the power of this or that currency. All you need is attach the indicator to the chart you want to trade and the indicator will show you real s
    Crystal Heikin Ashi Signals
    Muhammad Jawad Shabir
    5 (5)
    Crystal Heikin Ashi Signals—Professional Trend & Signal Detection Indicator Advanced Heikin Ashi Visualization with Intelligent Signal System for Manual & Automated Trading Final Price: $149 ---------> Price goes up $10 after every 10 sales . Limited slots available — act fast . Overview User Guide PDF Crystal Heikin Ashi Signals is a professional-grade MetaTrader 5 indicator that combines pure Heikin Ashi candle visualization with an advanced momentum-shift detection system. Designed for both m
    Auto Optimized SpeedAngle is an institutional-grade momentum vectoring system that eliminates curve-fitting through continuous Walk-Forward Optimization (WFO). Rather than relying on static inputs that degrade when market regimes shift, the indicator dynamically recalibrates its parameters using Out-of-Sample (OOS) validation, ensuring the displayed signals represent genuine statistical edges rather than historical anomalies. By shifting the focus from subjective visual angles to normalized, qua
    Multi Currency Strength and Momentum Indicator MT5 Dynamic Forex28 Navigator is the evolution of our long-time, popular indicators, combining the power of five in one: Advanced Currency Strength28 Indicator (700 reviews) Advanced Currency IMPULSE with ALERT (530 reviews) Currency Strength EXOTICS GOLD Impulse with Alert CS28 Combo Signals (recent Bonus) No need to buy four indicators and stack them on your charts. All of it is merged into one powerful indicator: the strength of the 28 Forex pair
    Azimuth Pro
    Ottaviano De Cicco
    5 (7)
    Azimuth Pro V2: Synthetic Fractal Structure and Confirmed Entries for MT5 Overview Azimuth Pro is a multi-level swing structure indicator by Merkava Labs . Four nested swing layers, swing-anchored VWAP, ABC pattern detection, three-timeframe structural filtering, and closed-bar confirmed entries — one chart, one workflow from micro-swings to macro-cycles. This is not a blind signal product. It is a structure-first workflow for traders who care about location, context, and timing. 1. What Change
    DayTrader PRO
    Davit Beridze
    5 (4)
    DayTrader PRO (Buy DayTrader PRO and get Another Paid Self Optimizing indicator for FREE as BONUS!) DayTrader PRO is an advanced trading indicator that combines John Ehlers' Laguerre Filter with a powerful Auto-Optimization Engine. Instead of using fixed parameters, the indicator automatically searches for the best settings based on recent market conditions, helping you adapt to changing volatility without constant manual adjustments. The indicator generates clear BUY and SELL signals together
    ARICoins
    Temirlan Kdyrkhan
    ARICoin is a powerful trading companion designed to generate high-probability entry signals with dynamic TP/SL/DP levels based on volatility. Built-in performance tracking shows win/loss stats, PP1/PP2 hits, and success rates all updated live. Key Features: Buy/Sell signals with adaptive volatility bands Real-time TP/SL/DP levels based on ATR Built-in MA Filter with optional ATR/StdDev volatility Performance stats panel (Success, Profit/Loss, PP1/PP2) Alerts via popup, sound, push, or email Cust
    FX Trend MT5 NG
    Daniel Stein
    5 (6)
    FX Trend NG: The Next Generation Multi-Market Trend Intelligence Overview FX Trend NG is a professional multi-timeframe trend and market monitoring tool designed to give you a complete structural overview of the market in seconds. Instead of switching between dozens of charts, you instantly see which symbols are trending, where momentum is fading, and where strong alignment exists across timeframes. This tool is part of the Stein Investments ecosystem: setup guides, videos, workshops and Max,
    PZ Swing Trading MT5
    PZ TRADING SLU
    5 (5)
    Protect against whipsaws: revolutionize your swing trading approach Swing Trading is the first indicator designed to detect swings in the direction of the trend and possible reversal swings. It uses the baseline swing trading approach, widely described in trading literature. The indicator studies several price and time vectors to track the aggregate trend direction and detects situations in which the market is oversold or overbought and ready to correct. [ Installation Guide | Update Guide | Tro
    FX Volume MT5
    Daniel Stein
    4.79 (24)
    FX Volume: Experience Genuine Market Sentiment from a Broker’s Perspective Quick Overview Looking to elevate your trading approach? FX Volume provides real-time insights into how retail traders and brokers are positioned—long before delayed reports like the COT. Whether you’re aiming for consistent gains or simply want a deeper edge in the markets, FX Volume helps you spot major imbalances, confirm breakouts, and refine your risk management. Get started now and see how genuine volume data can
    More from author
    KD HTF Candles
    Dien Du Khanh Duong
    KD HTF Candles projects transparent higher-timeframe candle bodies and wicks (e.g. M15/H1) directly onto your lower-timeframe chart, allowing you to view higher-timeframe candlestick patterns while trading a lower timeframe. Reviewing a higher-timeframe candle typically requires switching charts, which can interrupt focus on the execution timeframe. This tool displays the higher-timeframe candle directly on the lower-timeframe chart. Key Features Transparent HTF Overlay: Semi-transparent higher-
    FREE
    KD MTF Candle Timer
    Dien Du Khanh Duong
    KD MTF Candle Timer — Multi-Timeframe Candle Countdown & Synchronized Clocks for MetaTrader 5 Have you ever entered a trade prematurely on the lower timeframe, only to watch a Higher Timeframe (H1 or H4) candle wick violently against you before closing as a rejection pinbar? Or entered right before the candle close and suffered severe slippage during the transition? In discretionary trading and prop firm challenges, entry timing relative to candle closure is just as critical as your price level
    FREE
    KD MTF Dashboard
    Dien Du Khanh Duong
    KD MTF Dashboard displays ADX, RSI, MACD and EMA trend readings for the current chart's symbol across any combination of timeframes from M1 to D1 (up to 6 at once, M1/M5/M15/H1 by default), in a single table. It is designed to show whether a symbol's timeframes agree with each other, without needing to switch between charts. Key Features Multi-Timeframe Indicator Table: Displays ADX(14), RSI(14), MACD Main/Signal comparison, and EMA(20)/EMA(200) comparison for the current symbol, one column per
    FREE
    KD Ultimate SMC
    Dien Du Khanh Duong
    KD Ultimate SMC is an automated institutional order-flow indicator for MetaTrader 5, designed to map market structure — BOS/CHoCH shifts, Order Blocks, Fair Value Gaps and Liquidity Pools — across multiple timeframes on a single chart. It is intended as the structural reference the other six tools in the KD Trading System are designed to work alongside. This structure map is intended to serve as a reference point for other tools in the system — including VWAP reactions, mini-chart confirmations
    KD SMC Mini Charts
    Dien Du Khanh Duong
    KD SMC MiniCharts is a multi-timeframe analysis tool for MetaTrader 5 that displays up to four synchronized mini charts directly inside your main chart. Each mini chart can use its own timeframe and display SMC and Price Action information independently. This allows you to monitor lower- and higher-timeframe structure without repeatedly switching the timeframe of your main chart or opening multiple chart windows. Key Capabilities 1. Up to 4 Multi-Timeframe Mini Charts Display up to four mini cha
    KD Auto SLTP and Custom Price Alerts is a trade planning and risk management indicator for MetaTrader 5. It calculates Stop Loss levels from nearby swing structure, provides multiple Take Profit methods, calculates position size according to a selected percentage of account balance, and includes up to nine user-defined price alert lines. The indicator uses a configurable ZigZag structure engine together with an Average True Range (ATR) buffer to determine structural Stop Loss levels. Swing struc
    KD Trade Panel
    Dien Du Khanh Duong
    KD Trade Panel — Precision Trade Execution & Dynamic Risk Management for MetaTrader 5 Have you ever missed a high-probability trade setup because you spent precious seconds calculating your position size manually? Or worse, suffered an accidental drawdown breach on your prop firm account due to a miscalculated lot size or a delayed stop loss placement? In fast-moving financial markets, execution latency and manual calculation errors are among the primary causes of avoidable trading losses.   KD
    Filter:
    No reviews
    Reply to review