KD Ultimate SMC
- Indicators
-
Dien Du Khanh Duong
 KD Trading System: Trade with context. Read structure. Confirm across timeframes. Plan the risk.
==================================================================================== - Version: 1.0
- Activations: 10
KD Ultimate SMC is an automated institutional order-flow indicator for MetaTrader 5, designed to map market structure — BOS/CHoCH shifts, Order Blocks, Fair Value Gaps and Liquidity Pools — across multiple timeframes on a single chart. It is intended as the structural reference the other six tools in the KD Trading System are designed to work alongside.
This structure map is intended to serve as a reference point for other tools in the system — including VWAP reactions, mini-chart confirmations and structure-based stops.
Key Features
Four multi-timeframe capabilities are the main differentiators of KD Ultimate SMC compared to single-timeframe SMC indicators:
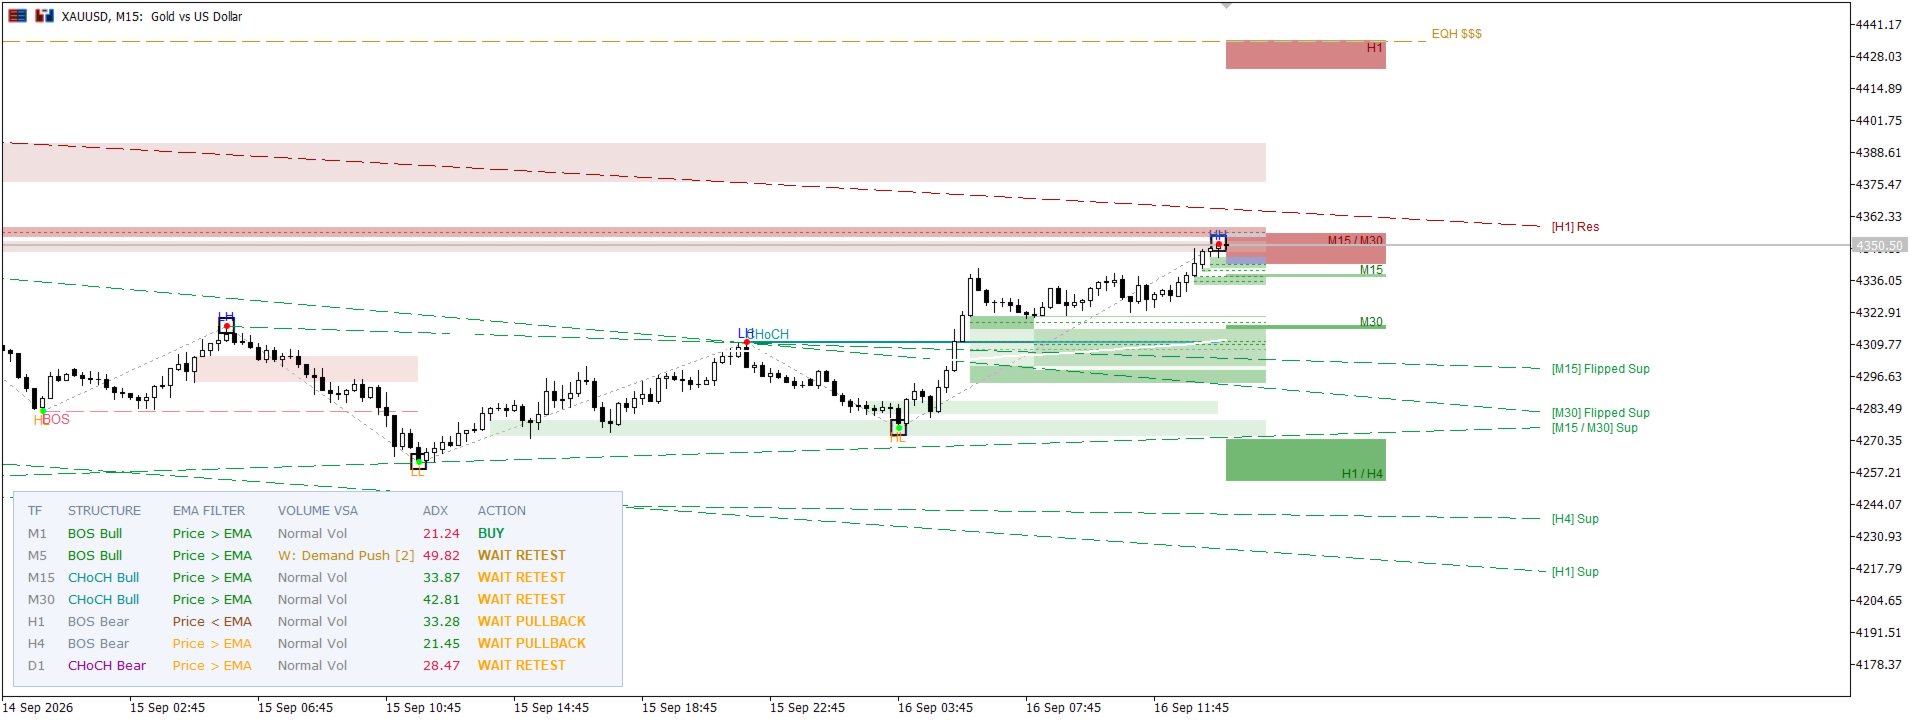
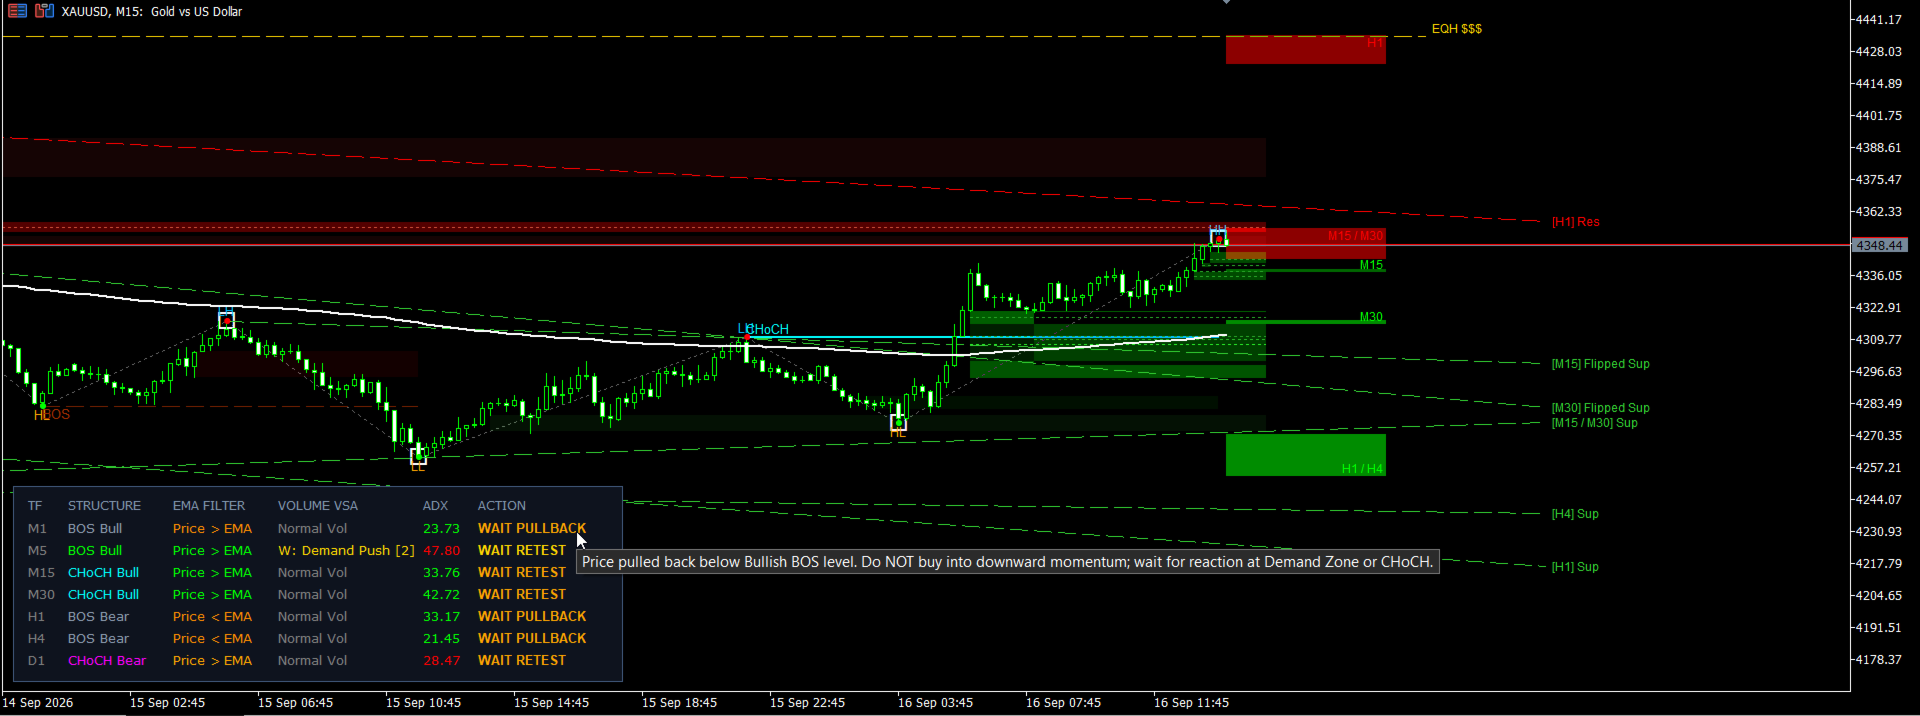
- Multi-Timeframe Supply/Demand Zones: Scans your current chart timeframe plus every higher timeframe you select for untested zones and flip zones automatically — not a fixed blanket range — so you can see which levels are relevant on the timeframes you trade.
- Multi-Timeframe Trendlines: Automatically draws and updates trendlines from valid swing points on both the current chart timeframe and a selected higher timeframe.
- Multi-Timeframe Fair Value Gaps (FVG) with 50% CE: Detects FVGs across every timeframe you select — not just the chart you're on — each with its 50% Consequent Encroachment line; hover any gap to see its source timeframe, top/bottom and mitigation status.
- Multi-Timeframe Confluence Dashboard: A single table covering every timeframe you select (M1–D1), showing Structure bias (BOS/CHoCH Bull or Bear), EMA trend filter (price above/below EMA), Volume/VSA reading (normal volume vs. buy/sell exhaustion with count), ADX trend strength, and a suggested Action (Buy, Caution Buy, Sell, Wait Retest, Wait Pullback) — a consolidated view instead of checking each timeframe individually.
The core structure engine underneath these features includes:
- Automated Structure Labeling: Detects major swing highs/lows and tags HH / LL / HL / LH without manual drawing.
- BOS & CHoCH Detection: Flags trend continuation and reversal signals as they form, with a color system to distinguish active from historical structure.
- Liquidity Sweep & Reclaim Alerts: Highlights stop-hunt-and-reverse patterns as they form.
- Order Blocks with Mitigation Status: Shows which OBs are still valid and which have already been used.
- Adaptive EQH/EQL Detection: ATR-scaled per instrument so equal-highs/lows logic can be applied consistently to Gold, majors and BTC.
Synergy with the KD Trading System
KD Ultimate SMC is the 1st pillar — a structure reference other tools in the system can use:
- KD Ultimate SMC (This Tool): Maps structure shifts, Order Blocks, FVGs and Liquidity Pools.
- KD SMC Mini Charts: Displays this same structure across an additional higher/lower timeframe.
- KD Auto SLTP: Places stops relative to the structural levels this tool identifies.
- KD MTF VWAP: Can be used alongside this tool to check whether price is reacting at institutional volume levels within these zones.
- KD MTF Candle Timer: Can help time entries into these zones to confirmed candle closes.
- KD HTF Candles: Overlays higher-timeframe candle patterns on top of the structure map.
- KD MTF Dashboard: Can be used to check whether the trend across this tool's timeframes supports the structure being observed.
Practical Use Cases
Use Case 1: The Dashboard Confluence Entry
- Setup: Review the Multi-Timeframe Confluence Dashboard for a row where Structure, EMA Filter and Volume/VSA agree in the same direction (e.g., M15 shows BOS Bull, Price > EMA, and Normal Vol with no exhaustion).
- In practice: ADX on that row is rising and the Action column reads "Buy" rather than "Caution Buy" or "Wait Retest."
- Purpose: Gives a trader a consolidated reference — the nearest unmitigated Order Block or FVG on that timeframe, and the next liquidity pool — to consider alongside the dashboard's reading.
Use Case 2: The Multi-Timeframe Trendline Break & Retest
- Setup: Price breaks the higher-timeframe trendline plotted by the Multi-Timeframe Trendlines feature while the current-timeframe trendline is still intact.
- In practice: Price retests the broken higher-timeframe trendline from the other side, and the Dashboard shows the higher timeframe changing from "Wait Retest" to "Buy"/"Sell."
- Purpose: Provides a reference point — the retest — and the next Supply/Demand zone on that higher timeframe as an additional level to consider.
Use Case 3: The Multi-Timeframe FVG Stack
- Setup: Look for two or more Fair Value Gaps from different timeframes (e.g., M15 and H1) overlapping in the same price region.
- In practice: Price reacts at or near the lower-timeframe FVG's 50% CE line, with the Dashboard's Volume/VSA column showing normal volume.
- Purpose: Highlights a multi-timeframe overlap and the far edge of the higher-timeframe FVG or the next liquidity pool as reference levels.
Use Case 4: The Liquidity Sweep Reversal
- Setup: Price moves beyond an Equal-High/Equal-Low (EQH/EQL) liquidity pool and then reclaims the level.
- In practice: A CHoCH forms on the same or next candle, and the Dashboard shows that timeframe's Structure and Action changing direction.
- Purpose: Flags this pattern and the opposing Supply/Demand zone as a reference level, for the trader to evaluate.
User Settings & Customization
- Toggle historical vs. active structure visibility and color palette (bright/muted).
- Select which higher timeframes to scan for zones, trendlines and FVGs.
- Enable/disable EQH/EQL detection per instrument type.
- Choose which timeframes appear as rows on the Confluence Dashboard and customize its EMA, ADX and VSA thresholds.
- Configure alert types (popup/push/email) for BOS, CHoCH and liquidity sweeps.