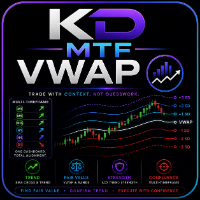
KD Mtf VWAP

🎯 KD MTF VWAP — Multi-Timeframe Anchored VWAP Projector & Trend Dashboard

See the entire market structure across EVERY timeframe — in a single indicator.

Have you ever opened 6 charts on 6 different timeframes (M1, M5, M15, H1, H4, D1) just to confirm the trend before placing a trade? KD MTF VWAP bundles all that work into one dashboard, combining Anchored VWAP, multi-layer EMA, and ADX trend-strength measurement — all automatic, all real-time.

⚙️ Key Features

  • Smart, non-fixed anchoring — automatically locates the nearest EMA crossover → traces back to find a suitable price high/low as the VWAP anchor, instead of rigidly anchoring to a fixed session open like most standard VWAPs (still falls back to session/week/month/year anchors when no crossover is found)
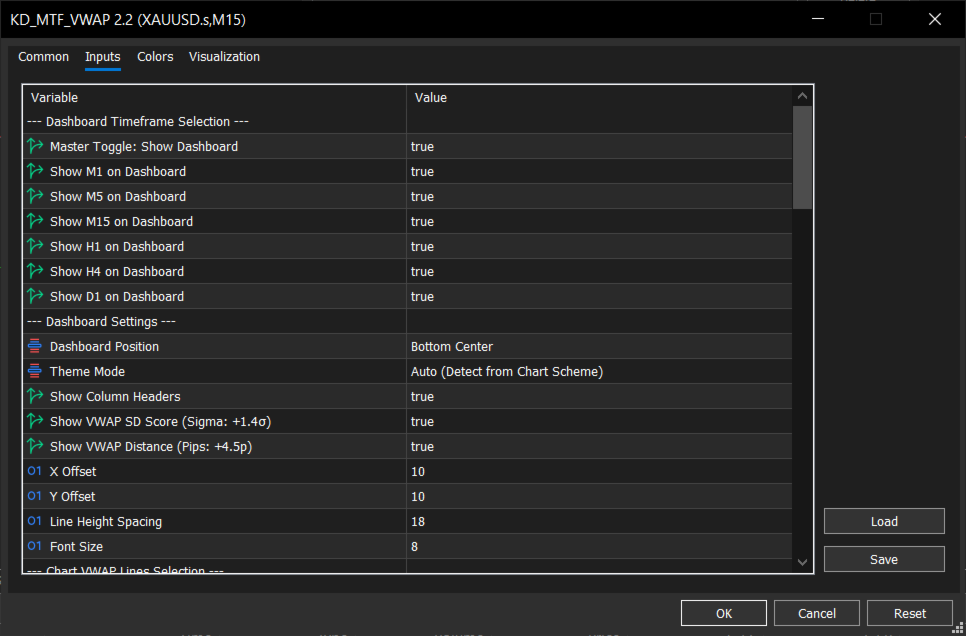
  • 6 timeframes at once — M1, M5, M15, H1, H4, D1 — enable/disable freely
  • Built-in ADX — measures real trend strength, filtering out false signals in weak markets
  • Fully customizable — color, width, and line style for every Band, EMA, and ATR line; Dashboard position and font size
  • Lightweight, no lag — recalculates only when a new bar closes on each timeframe, while the display updates smoothly on every tick

🔍 VWAP is NOT a "buy the bottom, sell the top" line

This is important to understand before using KD MTF VWAP.

VWAP (Volume Weighted Average Price) and its Standard Deviation Bands represent the volume-weighted average price measured from an anchor point — for example the most recent EMA crossover, a significant swing high/low, or the session/week/month/year open. They tell you:

  • 📍 Whether price is expensive or cheap relative to the average trading range
  • 📊 What standard-deviation level (SD) price currently sits at — 1x, 2x, or 3x deviation

But price touching Band 2 or Band 3 does NOT mean "reverse immediately." In a strong trending market, price can "ride" along the upper/lower bands for an extended period — if you short every time price touches +2SD in a strong uptrend, you will blow your account. Bands only carry reversal significance when the market is ranging (sideways) — and that condition can only be confirmed through the Dashboard, not from the VWAP line itself.

➡️ The correct rule of use: VWAP Bands tell you "where price is," the Dashboard tells you "what the market is doing." You should only trade a band reversal when the Dashboard confirms the market is RANGING or the trend is WEAK — never when the trend is STRONG.

🖥️ Dashboard — the "brain" that confirms multi-timeframe trend

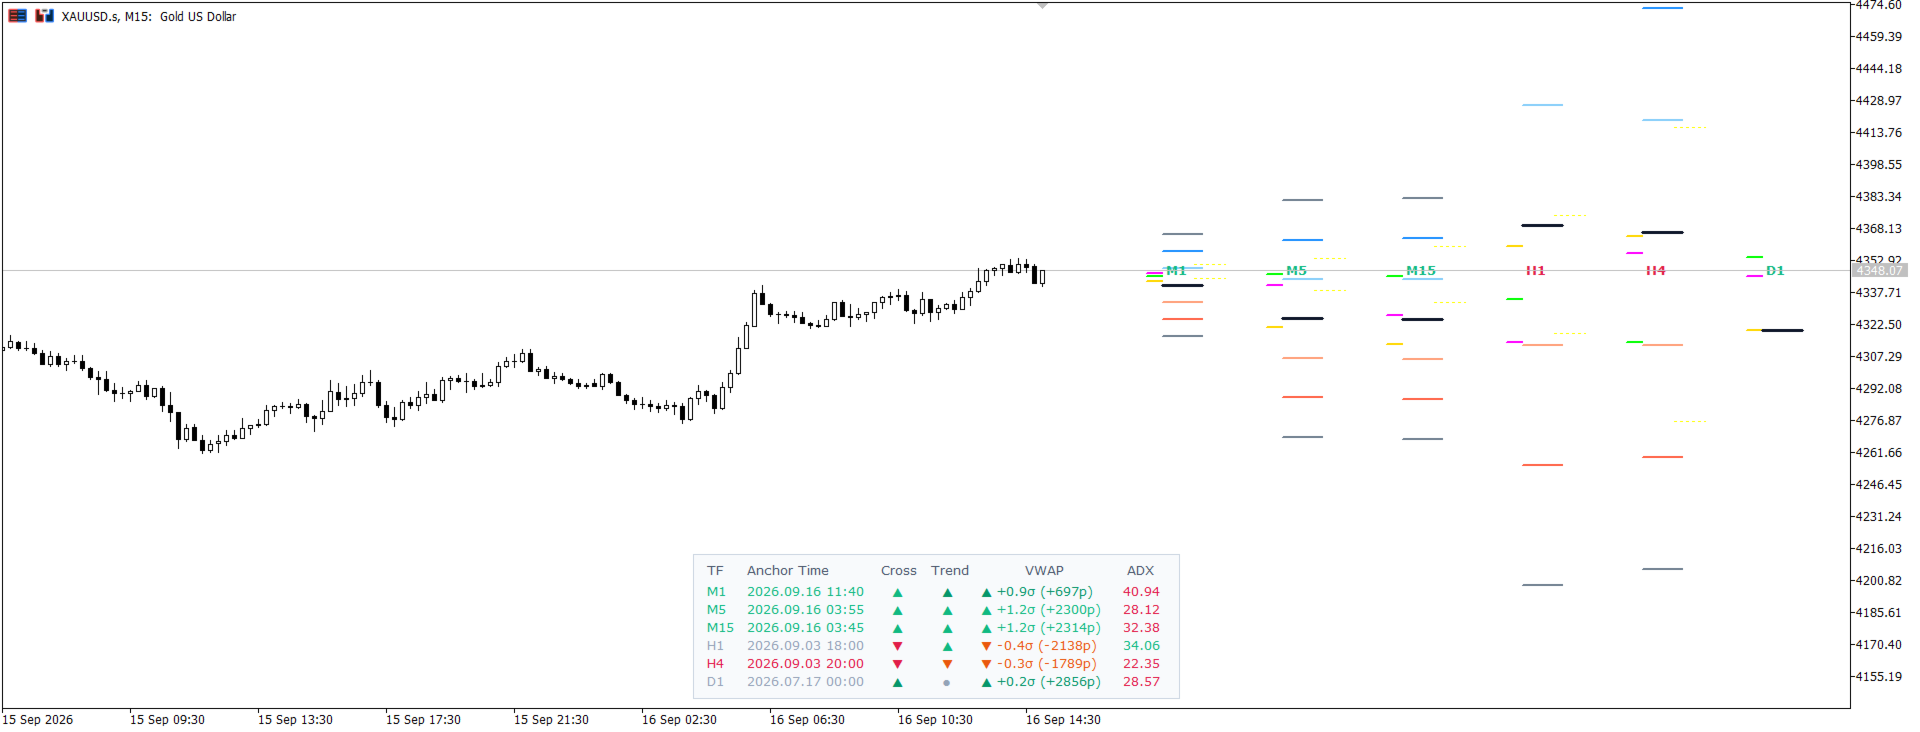
The Dashboard displays real-time data for each timeframe (M1 → D1) across 3 signal columns plus ADX:

Column Meaning Icon
EMA Cross Crossover state of Fast EMA (9) vs Slow EMA (200) ▲ Bullish / ▼ Bearish / ● Sideways
EMA Trend Price position relative to the base EMA (50) ▲ Bullish / ▼ Bearish / ● Choppy
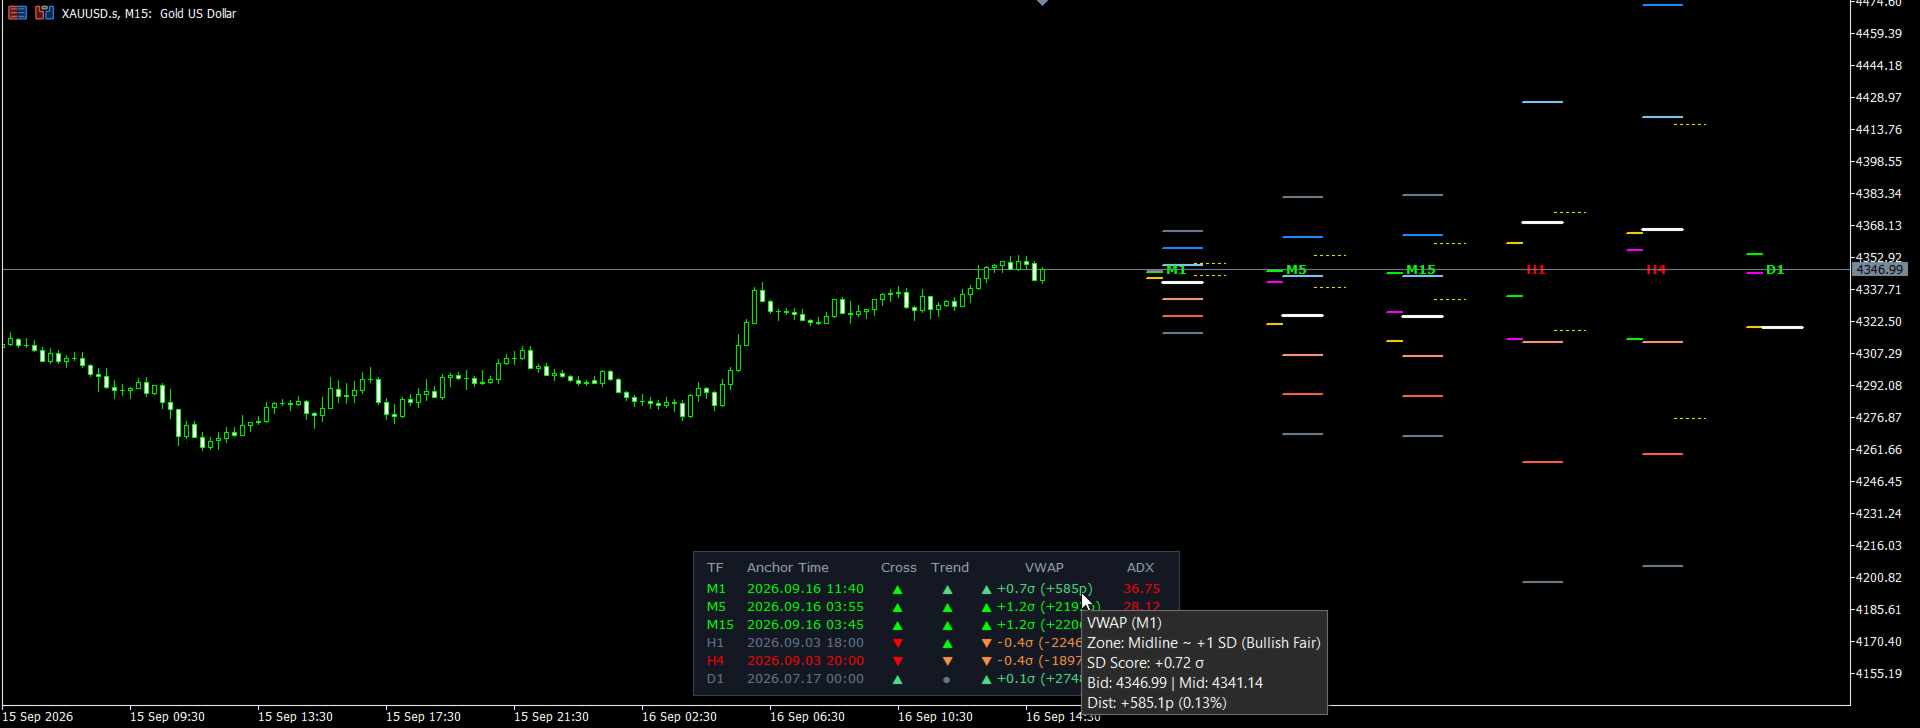
VWAP Trend Price position relative to VWAP Mid ▲ Above VWAP / ▼ Below VWAP / ● Neutral
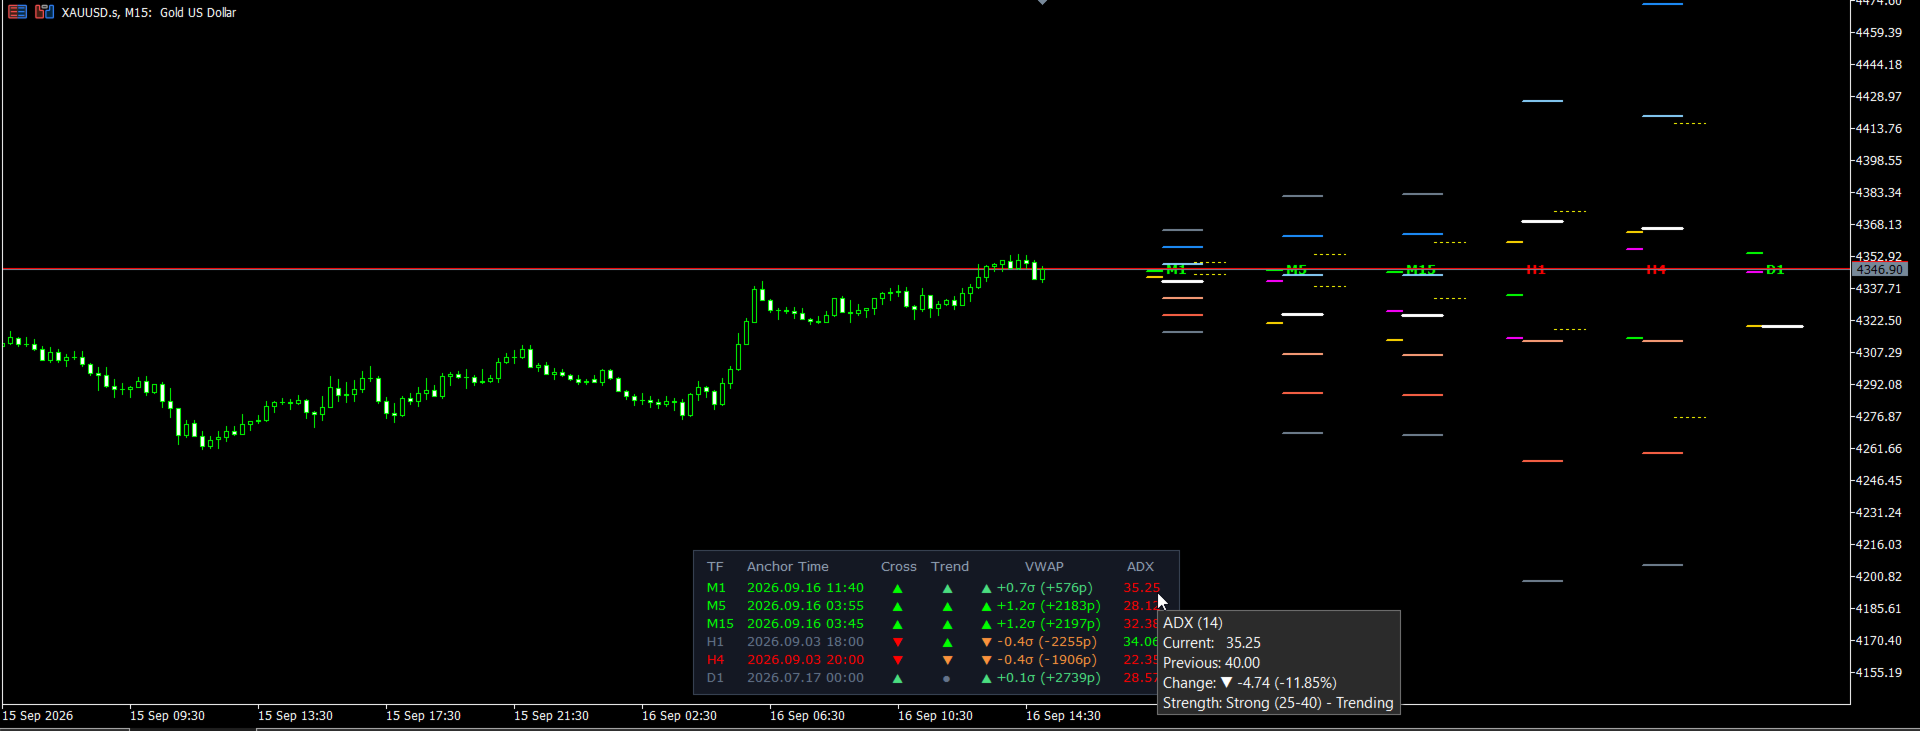
ADX Current trend strength, with an up/down arrow vs the previous bar Number + colored ▲/▼

🎨 Visual color code — read it at a glance

Color Meaning
🟢 Lime (bright green) STRONG bullish trend
🟩 Green (dark green) Bullish trend, still WEAK
🔴 Red STRONG bearish trend
🟠 Orange Bearish trend, still WEAK
⚪ Gray RANGING / SIDEWAYS — no clear direction
💡 Timeframe label turns Lime All 3 signals (Cross + Trend + VWAP) agree bullish
💡 Timeframe label turns Red All 3 signals agree bearish
💡 Timeframe label turns light gray Signals are conflicting — better to stay out

👉 When you see M15/H1/H4 all light up Lime at once, that's a multi-timeframe confluence signal to BUY with the trend — not a signal to sell just because price touched the upper band.

📐 Visual structure on the chart

For every enabled timeframe, the indicator draws a dedicated projection column to the right of the chart, consisting of:

  • VWAP Mid line (white, thick) — the central axis
  • 3 pairs of SD Bands (1x, 2x, 3x standard deviation) — the farther from Mid, the darker/deeper the color, marking increasingly "rare" price zones
  • 3 EMA lines (Fast/Trend/Slow) — shown compactly above each column
  • ATR ±2 band (yellow dotted line) — expected volatility range
  • Timeframe label that automatically changes color by trend (Lime/Red/Gray) right above the current price

Every line includes a hover tooltip showing the exact value — no need to eyeball it.

📋 Quick usage guide

  1. Check the Dashboard first — see whether the higher timeframes (H4, D1) are Lime or Red to identify the dominant trend.
  2. Check ADX — ADX rising and above 25 → the trend is strong, favor trading WITH the trend (buy on pullbacks to VWAP/Band 1 in an uptrend). ADX low/falling → the market is ranging, and a reversal at Band 2/3 may be considered.
  3. Use the VWAP projection column on the chart to define entry zones and take-profit zones (Band 1, 2, 3) with a sound risk-to-reward ratio.
  4. Never take a reversal trade just because price touched a band — always confirm with that timeframe's Dashboard color and ADX before deciding.

🧩 Part of the KD Trading Suite

KD MTF VWAP is not a standalone gimmick — it's one module in a structured toolkit built around a single idea: Trade with Context. Not Guesswork. The suite isn't meant to be stacked all at once — running every tool together buries your chart. Instead, KD MTF VWAP anchors one clear workflow:

🔹 The VWAP Flow — for traders who think in terms of fair value and mean-reversion:

  1. KD_MTFCandleTimer — know when the current candle closes so you're not reacting to a still-forming bar
  2. KD_MTF_VWAP — locate the fair-value zone and SD bands to define entries, stops, and targets
  3. KD_HTFCandles — see the higher-timeframe candle that shaped the current VWAP anchor, without leaving your entry chart
  4. KD_TradePanel (coming soon) — execute the confirmed setup with proper risk sizing, no manual math

If your style leans toward institutional order-flow instead of volume-weighted value, KD_SMC (coming soon) can take VWAP's place in that same 4-tool structure — Timer → SMC → HTFCandles → TradePanel — without needing both approaches running side by side.

KD_MTFDashboard is a separate, optional layer — it confirms whether the trend behind a band touch is strong or fading, which this indicator's own usage guide recommends checking before treating a band as a reversal zone. Add it if you want that extra confirmation; leave it off if you'd rather keep the chart lean and lean on VWAP + structure alone.

Check the author's product page for the full KD Trading Suite line-up and upcoming releases.

💬 Who is this for?

Traders who follow VWAP trading, multi-timeframe (MTF) analysis, or anyone who wants a complete overview of market structure without juggling multiple charts at once.

KD MTF VWAP — not just lines on a chart, but a way to read the market.

⭐⭐⭐⭐⭐ If it's helped you spot a band touch that was worth trading versus one you should have skipped, a comment on which timeframe and Dashboard reading you were checking is always welcome — it helps other traders read it right, and helps shape what's built next.

추천 제품
Power Bank mt5
Sergey Kasirenko
Power Bank EA는 CCI 채널 지표 기반의 추세 추종 시스템으로, 채널 밴드를 사용하여 추세 방향, 과매수/과매도 영역, 잠재적 돌파 영역을 파악하는 데 도움을 줍니다. 이 EA는 상승 및 하락 추세의 시작을 정확하게 감지하고, 목표가(TP)에 도달할 때까지 마틴게일/그리드 방식으로 미결제 거래를 관리합니다. 추천 통화쌍: EURUSD, AUDUSD, GBPUSD, NZUSD 등 주요 통화쌍과 AUDCAD, NZDCAD, EURNZD, EURCAD, XAUUSD 등 마이너 통화쌍(15분봉 기준) 설정: 시작 시간 - EA의 시작 시간 시작 분 - EA의 시작 분 종료 시간 - EA의 종료 시간 종료 분 - EA의 종료 분 Lot - 거래를 시작할 초기 Lot 가변 Lot 사용 - True/False - 자금 관리 사용 True/False 0.01 Lot당 무료 마진 - 0.01 Lot당 무료 마진 Multiplication - 1.5와 같은 승수 계수 최대 Lot - 허용
=================================================================================== PRODUCT DESCRIPTION: KRYPTON TREND KINETIC PRO BY VERITASALGO =================================================================================== Krypton Trend Kinetic Pro (KTK) is a high-performance mathematical model and trend-following system designed exclusively for the MetaTrader 5 platform. Engineered specifically to meet the strict listing requirements of the MQL5 Market, this premium analytical tool offe
HedgingMonitor: Visual Control for Hedging Operations HedgingMonitor: Professional Order Visualization for MT5 HedgingMonitor is a professional indicator for MetaTrader 5 that displays detailed information about all your open and pending orders in an organized and customizable visual panel. Ideal for traders who use hedging strategies or manage multiple orders simultaneously. Key Features: Intuitive Visual Interface: View all your orders in a single panel, with color coding to quickly identify b
This system is good at identifying short term reversals in the market. It is based on a machine learning study on market structure, and can be a great tool to scan the market or direct trades. With everything, there isn't a 100% win-rate, but this indicator is sometimes always accurate.   When it thinks a reversal will happen, it will color the candle a specific color, draw an arrow and then alert you on whether to buy or sell the upcoming candle.   Simple Setup Drag and drop onto any chart, at
RSImaxmin
Carlos Andrés Moya Erazo
4.5 (10)
The indicator shows when there are overprice and divergences on the RSI. In addition, it has configurable alerts, dynamic overprice levels and a special “RSI cleaner” function. The indicator that automatically calculates the premium rates! RSImaxmin is an indicator based on the Relative Strength Index (RSI) oscillator that effectively identifies changes in price trends as it reflects the relative strength of bullish movements compared to bearish movements. It is widely used by traders to measur
MA Horizon MTF
Bunsatoru Kikuchi
This indicator allows you to display specified Moving Averages (MAs) across multiple timeframes on a single chart. By defining your desired MAs in the settings, they will be consistently displayed in multi-timeframe (MTF) regardless of the current chart timeframe you switch to. You can freely customize the timeframe for each MA and toggle their visibility individually via the settings. When an MA goes off-screen, its label is pinned to the top or bottom edge of the chart. This allows you to ins
Martingale Osw MT5
William Oswaldo Mayorga Urduy
사용자 설명서: 고급 마틴게일 관리 및 위험 제어 시스템 본 전문 설명서는 MetaTrader에서 포지션 복구 및 위험 관리를 자동화하도록 설계된 고급 마틴게일 주문 관리 시스템의 작동 방식, 설정 방법 및 사용자 인터페이스에 대해 설명합니다. 1. 소개 및 목적 이 도구는 비용 평균화를 핵심 논리로 하는 고정밀 주문 관리 시스템입니다. 초기 방향과 반대로 움직이는 거래를 보호하고 복구하기 위해, 평균 청산 가격을 높이는 미결 주문 네트워크를 구축하는 것을 목표로 합니다. 기본 시스템과 달리, 이 소프트웨어는 동적 손익분기점 및 트레일링 스톱 알고리즘과 신속한 수동 개입을 위한 화면 제어 인터페이스를 통합하여 자본 관리를 최우선으로 고려합니다. 2. 매개변수 안내 (입력 메뉴) 마틴게일 설정 및 거리 마틴게일 개수: 초기 거래 후 시스템에서 허용하는 최대 헤징 주문 개수를 정의합니다. 거리 유형: 포인트 단위의 고정 거리 또는 ATR(평균 실제 범위) 지표 기반의 동적 거리
Session Volume Profile — Daily + Weekly Know where the volume is. Trade with the market, not against it. What It Does Session Volume Profile maps exactly where volume was traded across price — for the current day and optionally the full trading week. Updated in real time, directly on your chart. At a glance you can see where the market accepted price, where it rejected it, and where the key reference levels are for the session ahead. No repainting. No clutter. Just clean, actionable levels. Key
The trend filter
Vincent Albert Feugier
Trend Filter By HYPOLITE MAKER (v3.00) Trend Filter is a visual indicator for MetaTrader 5 designed to clean up your charts and display the market's true trend. It eliminates market noise and visual traps to help you stay on the right side of the market, with significantly less lag than standard moving averages. Visuals & Key Features The Central Line: It changes color to give you the market direction at a glance. Green for an uptrend, Red for a downtrend, and Yellow when the market is hesitatin
# SSL ST Strategy MT5 Indicator - Korean Version SSL ST Strategy MT5 지표는 거래자가 거래 차트에서 매수 및 매도 신호를 명확하게 식별하도록 도와주기 위해 설계된 기술 분석 도구입니다. 선과 화살표 같은 시각적 지표, 음성, 팝업 및 푸시 알림을 제공하여 거래 기회가 발생할 때 거래자에게 즉시 알립니다. ## 주요 장점 - 색상이 지정된 선(SSL1 및 기준선)과 매수(녹색 삼각형) 및 매도(빨간색 삼각형) 신호를 위한 화살표를 사용하여 차트에서 직접 명확한 시각 신호를 제공합니다. - 음성 알림, 팝업 알림 및 모바일 푸시 알림을 지원하여 거래자가 화면에서 멀리 있어도 중요한 신호를 놓치지 않도록 합니다. - 신호 로직 반전을 허용하여 다양한 거래 전략이나 시장 조건에 적응할 수 있습니다. - 고가, 저가 및 종가를 기반으로 한 지수 이동 평균(EMA)을 사용하여 보다 반응성 높고 부드러운 신호 생성을 제공합니다. - 동
FREE
SourcePoint是一个很好的中长线交易指示器,他能独立使用,也可以去其他趋势型指标独立使用,可以很好的指出最佳的buy和sell位置,指标不含有未来函数,不会重新绘制,不仅能够应用到自己的手动交易过程中,还能完全可以写入到自己的EA中。建议配合BS TrendLine( https://www.mql5.com/zh/market/product/96476?source=Site+Market+My+Products+Page ) 一起使用。 (如果你感觉到这个指标能够帮助你进行更准确的交易,请帮忙给个好评,希望我的作品能够帮助更多有需要的人) ===================参数列表===================== fastP: 12 slowP:26 avgP:9 =================参考使用方法=================== 此指标可以适用于任何交易品种,能够用在任何周期。 每次形成一个交点,就是一个交易机会,同时也是一个持仓平仓点位。建议配合大小周期一起使用,这样更容易让你找到更精准的入场位置和出场位置
Equivalent MA
Yuya Kogoshi
THE NUMBER CHANGES. THE MEANING DOESN’T. Change timeframes. Keep your reference. SAME PERIOD. DIFFERENT MEANING. Change the timeframe, and the MA you trusted is no longer measuring the same market horizon. The problem The same MA period measures a different amount of market time when the chart timeframe changes. The solution Equivalent MA changes the number — so your reference keeps the same meaning. H4 EMA 50 = H1 EMA 200 = M15 EMA 800 USER MANUAL Complete setup instructions, feature details,
Sniper PRO Alert System
Amanda Vitoria De Paula Pereira
RSI Price Action Breakout is a technical indicator designed to filter market noise and identify high-probability reversal points. Unlike standard oscillators, this tool does not signal immediately upon overbought/oversold conditions; instead, it waits for a Price Action confirmation (Breakout/Engulfing) to validate the entry. NEW:   Mobile Push Notifications included! Engineering Logic The algorithm operates on a strict two-step validation process: 1. Condition A (Setup): The RSI (Relative S
Utilities
Douglas Lucio De Araujo
Indicator with 3 features - Clock : Clock independent of the chart, counting continues even when the market is closed. - Template : After setting up a configuration in any graphic, be it color patterns, indicators, zoom ... The configuration will be copied to all active graphics. - TimeFrame : Set the TimeFrame on a chart, and with just one click all the active charts will be changed to the same TimeFrame.
Momentum waves oscillator
Vincent Albert Feugier
The Momentum Waves Oscillator is an indicator designed for traders who want to declutter their charts. It does not generate "magic" signals; instead, it structures market data to provide an immediate, noise-free reading of momentum and volatility. This tool transforms price action into an organized visual grid, facilitating rapid and confident decision-making. Key Features: "Snap-to-Grid" Points: Prices are normalized on a scale of -100 to +100 with a step of 5. This eliminates chart "jitter" an
Nasdaq Future is a Semi Automated Trading Expert.  How does it work ? Simply Identify a strong trend, Up trend on Nasdaq for Example.  Click Buy, the Expert will open 9 trades 1. Market Execution  3. Buy Stop at Higher prices distanced space 0.5X from eachother 5. Buy limits orders below the Market price distanced 1X What is X ? X is the distance between two orders, for example in nasdaq, recomended to use between 50-70 points.  Can I control X ? Yes, in the control panel there is
EMA Trinity Pulse
Jonatan Gergo Schmal
EMA Trinity Pulse: Advanced Institutional-Grade Trend Alignment Engine Welcome to EMA Trinity Pulse , a state-of-the-art algorithmic trading system engineered for traders who demand precision, strict capital preservation, and uncompromising performance. Developed through thousands of hours of quantitative research, rigorous tick-data backtesting and live market validation. This EA represents the pinnacle of automated trading technology. Unlike generic grid or martingale systems that expose you
AngleMeter Pro
Gabriel Balbino De Oliveira
Turn market slope into your greatest trading advantage! Tired of lagging and subjective indicators? AngleMeter Pro is here to revolutionize your chart analysis in MetaTrader 5. Powered by advanced trigonometry and statistical linear regression, it measures the exact trend angle in real time using a striking visual protractor with a continuous color gradient. Featuring dual-timeframe support for macro context analysis, dynamic bisection channels, an embedded normalized mini-chart, and an interact
이 다중 시간 프레임 및 다중 기호 표시기는 핀 막대, 아침/저녁 별, 인글핑, 핀셋, 쓰리 라인 스트라이크, 내부 막대 및 페넌트 및 삼각형을 스캔합니다.   지표는 단일 차트 모드에서도 사용할 수 있습니다. 이 옵션에 대한 자세한 내용은 제품의       블로그   .       고유한 규칙 및 기술과 결합하여 이 표시기를 사용하면 자신만의 강력한 시스템을 생성(또는 강화)할 수 있습니다. 특징 Market Watch 창에 표시되는 모든 기호를 동시에 모니터링할 수 있습니다. 하나의 차트에만 지표를 적용하고 전체 시장을 즉시 모니터링하십시오. M1에서 MN까지 모든 시간대를 모니터링하고 패턴이 식별되면 실시간 경고(팝업, 푸시 또는 메일)를 보냅니다. RSI 및 볼린저 밴드를 핀 바, 아침/저녁 별   , 인글프잉 및 핀셋 형성   에 대한 필터로 사용하여 잠재적 반전을 적절하게 식별할 수 있습니다. 이동 평균을 주요 추세 필터로 사용하고 ADX를 변동성 필터로 사용할 수 있습니
Brilliant Reversals MultiCurrency Scanner MT5는 여러 통화 쌍에서 잠재적인 반전 포인트를 식별하려는 트레이더를 위해 설계된 최첨단 거래 지표입니다. 고급 알고리즘을 활용하여 이 도구는 즉각적인 통찰력을 제공하며, 거래 전략을 최적화하려는 초보자와 경험자 모두에게 귀중한 도구입니다. 이 지표는 시장 상황에 따라 실시간 매수 및 매도 신호를 제공하여 트레이더의 결정을 지원하고 거래 성과를 향상시킵니다. 포괄적인 대시보드와 알림 기능을 통해 주요 통화 쌍을 쉽게 모니터링하고 시장 기회에 신속하게 대응할 수 있습니다. MQL 제품 설치 가이드 | 구매한 MQL 제품 업데이트 MT4/MT5 | 일반 문제 해결 가이드 | 지표 설정 / 가이드 주요 기능 버퍼 통합: 신호 기반 거래를 효과적으로 활용할 수 있도록 지표 값을 접근 가능한 버퍼로 노출합니다. 시각적 화살표 신호: 차트에 직접 매수/매도 화살표를 명확하게 표시하여 거래 기회를 쉽게 포착할 수 있습니
MQL5 블로그: https://www.mql5.com/en/blogs/post/772035 MT4 버전: https://www.mql5.com/en/market/product/183506 MT5 버전: https://www.mql5.com/en/market/product/183507 LIQUIDITY MAGNET [tambangEA]은 트레이더가 고품질 유동성 영역을 식별하고, 영역의 강도를 모니터링하며, 반대되는 시장 영역 간의 잠재적인 방향성 "자석"을 파악하는 데 도움을 주기 위해 설계된 전문적인 수요 및 공급 시각화 지표입니다. 이 지표는 중요한 일중 수요 및 공급 영역을 차트에 직접 표시하고, 반응 품질에 따라 각 영역에 점수를 매기며, 영역 상태, 가격 범위, 점수, 최신성, 무효화 상태 및 활성 자석 끌어당김 방향을 보여주는 깔끔한 대시보드를 제공합니다. 이 도구는 수동 의사 결정 지원을 위해 설계되었습니다. 거래를 자동으로 시작, 종료 또는 관리하지 않습니다.
Trend Fusion MTF
Elham Afsharpour
Trend Fusion MTF Trend Fusion MTF는 MetaTrader 5용 멀티 타임프레임 추세 및 시장 구조 분석 지표입니다. 최대 6개의 선택된 타임프레임을 독립적으로 분석하고 현재 방향을 깔끔한 차트 패널에 표시합니다. 각 타임프레임에 서로 다른 가중치를 설정할 수 있어 상위 타임프레임이 최종 추세 강도에 더 큰 영향을 주도록 구성할 수 있습니다. 이 지표는 확정된 가격 피벗과 BOS 및 CHOCH를 포함한 시장 구조 패턴을 사용하여 각 타임프레임을 다음 상태로 분류합니다. 상승 추세 하락 추세 중립 확인 대기 작동 방식 Trend Fusion MTF는 활성화된 각 타임프레임에서 자동으로 다음 작업을 수행합니다. 이전 캔들을 분석합니다. 초기 유효 고점 및 저점 피벗을 찾습니다. 새롭게 확정된 피벗을 감지합니다. 중요한 시장 구조 레벨의 돌파를 모니터링합니다. 상승, 하락 또는 중립 추세 상태를 확인합니다. 각 타임프레임의 결과를 전체 가중 추세 강도에 반영합니다.
The main purpose of this indicator is to determine the moments of entries and exits from transactions, so the Trend Factorial indicator displays only the trend line and entry points, i.e. it displays market entry points. Despite the apparent simplicity of the indicator, it has complex analytical algorithms inside, with the help of which the system determines the moments of entries. The indicator gives accurate and timely signals to enter and exit a trade that appear on the current candle. Us
IK Trendz Trading
Md Iqbal Kaiser
iK Trendz Trading: The Ultimate Multi-Asset Trend Intelligence iK Trendz Trading is a professional-grade trend following indicator designed to provide traders with a crystal-clear view of market direction across multiple symbols and timeframes simultaneously. By combining advanced volatility-based logic with an intuitive Multi-Timeframe (MTF) dashboard, it eliminates the noise and identifies high-probability trading zones. Whether you are a scalper, day trader, or swing trader, this tool is desi
FREE
SuperTrendCCI
Volkan Mustafaoglu
The best quality application of the famous Super Trend indicator that requires no introduction. It is completely faithful to the original algorithm and powered by the CCI indicator. - easy to trade - It implements all kinds of warnings. - It implements a multi-timezone dashboard. - It cannot be repainted or backpainted. Input parameters - ATR Period – This is the average true range period. - ATR Multiplier - The ATR multiplier that defines the trend. - CCI - Makes trend following powerful. - M
ICT Institutional Zones Pro
Celestine Anyango Wabomba
ICT Institutional Zones Pro — Trade with Institutional Precision Stop wasting time manually drawing key ICT levels every day. ICT Institutional Zones Pro is a professional-grade MT5 indicator built for traders who use ICT (Inner Circle Trader) and Smart Money Concepts (SMC) to read market structure with precision. This indicator automatically maps the most important institutional levels directly on your chart, helping you instantly identify where smart money is likely accumulating, distributing
An all‑in‑one trading assistant that blends AI candle synthesis with a 15‑pattern Heat Map, ATR‑scaled S/R & pivots, and a Vigilant risk monitor (LOC/TF/SR/PAT gates, Ready%, EM points, SR‑distance bar). The Opportunity Advisor adds ETAs, checklists and gate status; Multi‑TF Confluence confirms alignment from M1–D1. The Professional Trade Suggestion panel shows regime, session filter, R:R presets, Partials and Quality Pause. Clean, readable UI with one‑click S/R toggles, scanners and a built‑in,
TrendCore Adaptive FX — Smart Expert Advisor for Confident and Adaptive Forex Trading TrendCore Adaptive FX   is a powerful, fully automated trading robot designed for consistent performance in the Forex market. It combines trend-based technical analysis, adaptive lot management, and solid capital protection strategies to ensure robust and efficient trading under real market conditions. Whether you're a professional trader or a long-term investor, this EA offers an intelligent solution to a
Fabulous Four FAB4 Indicator
Daniel Raimundo De Oliveira
The Exclusivissimo FAB4 (Fabulous Four) Indicator is an institutional-grade chart analysis tool designed for MetaTrader 5. Built for professional traders who demand precision, this indicator automatically maps the most critical liquidity zones and momentum shifts in the market, keeping your chart clean and your entries surgical. Whether you are trading Forex, Indices, or Stocks, the FAB4 Indicator provides a complete institutional roadmap right on your screen, highlighting true market intent wit
Checkpoints
Tatiana Savkevych
The Checkpoints indicator implements an advanced algorithm for visualizing the market trend. The main application of the indicator is to generate buy and sell signals. Determining the market trend is an important task for traders. Probably, almost every trader has dreamed of non-lagging MAs at least once. I have embodied this dream in my indicator. With this indicator, you can predict future values.  The indicator is designed to determine either a trend or short-term buy or sell signals. The
이 제품의 구매자들이 또한 구매함
이 제품은 2026년 시장에 맞게 업데이트되었으며 최신 MT5 빌드에 최적화되었습니다. 가격 업데이트 안내: Smart Trend Trading System은 현재 $99 에 제공됩니다. 다음 30회 구매 후 가격은 $199 로 인상됩니다. 특별 혜택: Smart Trend Trading System 구매 후 저에게 개인 메시지를 보내시면 Smart Universal EA를 무료 로 받을 수 있으며, Smart Trend 신호를 자동 거래로 전환할 수 있습니다. Smart Trend Trading System은 리페인트 없음, 재그리기 없음, 지연 없음의 완전한 트레이딩 시스템으로, 더 깨끗한 신호, 더 나은 추세 방향, 그리고 더 체계적인 시장 거래 방식을 원하는 트레이더를 위해 제작되었습니다.   [User Manual]   ,  [PDF]  ,   [Installation manual]   and  [Online course] 이 시스템은 추세 감지, 반전 구간, Smart
Superhero
Ihor Otkydach
5 (2)
SUPERHERO 지표는 “올인원” 방식으로 설계된 다중 통화 거래 시스템입니다. 이 지표는 시장을 독자적으로 분석하여 포지션을 개설하고 청산할 시점에 대한 신호를 제공합니다. 손절매(Stop Loss) 및 익절(Take Profit) 주문을 활용하며, 위험 대비 수익 비율(R:R)은 1:1입니다. 가끔 저는 이 시스템의 신호를 바탕으로 직접 거래를 하는데, 그 결과는 다음과 같습니다— 실시간 신호 이 시스템은 스마트폰으로 푸시 알림을 전송할 수 있으므로, PC에 묶여 있을 필요 없이 “이동 중에도” 매매를 할 수 있습니다. 이는 자체 거래 전문 회사에 안성맞춤입니다. 모든 고객님께 드리는 특별 혜택: 이 지표를 구매하시는 모든 분께는 제가 특별히 준비한 유틸리티를 선물로 드릴 예정이며, 이 유틸리티는 다음과 같은 기능을 제공합니다: 손절매 및 익절 주문을 자동으로 설정합니다 가격이 목표 수준에 도달하면 자동으로 포지션을 청산합니다 미결제 주문 거래를 지원합니다 평균화 거래 모드를
Trend Sniper X
Sarvarbek Abduvoxobov
5 (9)
Trend Sniper X 는 MetaTrader 5용 멀티 타임프레임 추세 추종 지표로, 트레이더가 추세 방향과 잠재적 반전 지점을 명확하고 정확하게 식별하도록 돕습니다. 가격 정보: 현재 가격은 프로모션 가격이며, 향후 업데이트 및 새로운 기능 출시 시 변경될 수 있습니다. Code2Profit 채널 멀티 타임프레임 분석으로 시장을 마스터하세요! 기술 사양 플랫폼 MetaTrader 5 지표 유형 멀티 타임프레임 추세 지표 운용 타임프레임 모든 차트 타임프레임 지원, 독립적으로 선택 가능한 상위 타임프레임(M1–MN1) 주요 상품 외환, 금(XAUUSD) 및 기타 CFD 권장 계좌 모든 계좌 유형 시각화 색상별 추세 캔들(매수/매도/약세/변경) + 매수/매도 화살표 추가 모듈 세션 시장 박스(시드니, 도쿄, 런던, 뉴욕) 주요 기능 멀티 타임프레임 추세 분석: 상위 타임프레임의 추세 방향을 현재 차트에 직접 투영하여 명확한 매크로 관점을 제공합니다. 약세/불확실한 바 감지: 추세
Welcome to ENTRY IN THE ZONE AND SMC MULTI TIMEFRAME Entry In The Zone and SMC Multi Timeframe is a real-time market analysis tool based on Smart Money Concepts (SMC), designed to analyze market structure, price direction, and key trading zones. It supports both Single-Timeframe Analysis and Multi-Timeframe Analysis, providing a clearer view of the overall market structure across multiple timeframes, with real-time BUY / SELL signals that do not repaint. It is designed to help filter trading opp
SuperScalp Pro
Van Minh Nguyen
4.6 (30)
SuperScalp Pro – 전문 멀티 레이어 컨플루언스 스캘핑 시스템 SuperScalp Pro 는 다중 컨플루언스를 기반으로 한 전문 스캘핑 시스템으로, 트레이더가 더 높은 확률의 매매 기회를 식별할 수 있도록 설계되었습니다. 명확한 진입 신호 확인, ATR 기반 손절(Stop Loss) 및 목표가(Take Profit), 그리고 XAUUSD, BTCUSD 및 주요 외환 통화쌍에 대한 유연한 신호 필터링 기능을 제공합니다. 전체 문서는 제품 블로그에서 확인할 수 있습니다:   [User Guide] SuperScalp Pro Auto Trader EA를 통해 자동 매매를 지원합니다:   [Auto Trader] SuperScalp Pro 의 거래 로직을 기반으로 개발된 골드 자동 스캘핑 EA: [SuperScalp Gold] SuperScalp Pro 는 Supertrend, VWAP, EMA, RSI, ADX, 거래량 분석, 볼린저 밴드 및 MACD 다이버전스를 결합하여
SMC Intraday Formula
Kareem Abbas
5 (21)
먼저 솔직하게 말하겠습니다. 어떤 인디케이터도 단독으로 당신을 수익성 있게 만들어주지 않습니다. 누군가 그렇게 말한다면, 그는 당신에게 꿈을 파는 것입니다. 완벽한 매수/매도 화살표를 보여주는 모든 인디케이터는 완벽하게 보이도록 만들 수 있습니다 — 단지 올바른 과거 구간을 확대하고 승리한 거래만 캡처하면 됩니다. 우리는 그렇게 하지 않습니다.  SMC Intraday Formula는 도구입니다. 시장 구조를 읽고, 가장 높은 확률의 가격 구간을 표시하며, 현재 스마트 머니의 흐름이 어떻게 보이는지 아주 단순한 언어로 보여줍니다. 최종 결정은 여전히 당신이 합니다. 실행도 당신이 합니다. 하지만 이제는 희망이 아니라 정확성으로 거래하게 됩니다. 우리는 이 인디케이터를 지난 약 3년 동안 골드(XAUUSD) 및 주요 외환 통화쌍의 데이 트레이딩 스캘핑에 사용해 왔습니다. M1, M5, M15, M30에서 우리의 핵심 도구입니다. 이 도구는 미래를 예측하려 하지 않습니다 — 지금 형성
M1 Sniper MT5
Oleg Rodin
5 (4)
M1 SNIPER 는 사용하기 쉬운 거래 지표 시스템입니다. M1 시간대에 맞춰 설계된 화살표 지표입니다. 이 지표는 M1 시간대 스캘핑을 위한 단독 시스템으로 사용할 수 있으며, 기존 거래 시스템의 일부로도 사용할 수 있습니다. 이 거래 시스템은 M1 시간대 거래용으로 특별히 설계되었지만, 다른 시간대에도 사용할 수 있습니다. 원래는 XAUUSD와 BTCUSD 거래를 위해 이 방법을 설계했지만, 다른 시장 거래에도 유용하다는 것을 알게 되었습니다. 이 지표의 신호는 추세 방향과 반대로 거래될 수 있습니다. 저는 지표의 신호를 활용하여 양방향으로 거래할 수 있도록 돕는 특별한 거래 기법을 알려드립니다. 이 방법은 특별한 동적 지지선과 저항선 가격 영역을 활용하는 것을 기반으로 합니다. 구매하시면 M1 SNIPER 화살표 지표를 바로 다운로드하실 수 있습니다. 또한, 아래 스크린샷에 표시된 Apollo Dynamic SR 지표는 M1 SNIPER 도구를 사용하는 모든 사용자에게 무료로
Entry Points Pro for MT5
Yury Orlov
4.51 (148)
전설이 돌아왔습니다: Entry Points Pro 10. MQL5 마켓 Top-3 자리를 3년간 지켜온 전설적인 지표의 재출시입니다. 수백 개의 호평 리뷰(두 버전 합산 589개), 매일 이 지표로 거래하는 수천 명의 트레이더, 31,000회 이상의 데모 다운로드   MT4+MT5 . 지난 5년간 여러분이 남긴 리뷰를 하나도 빠짐없이 읽었고, 약속 대신 그 답을 버전 10에 담았습니다. 1999년부터 시장에서 활동하며 정직함과 자신의 평판, 그리고 고객을 소중히 여기는 개발자가 만들었습니다. Entry Points Pro의 진입 시그널은 절대 리페인팅되지 않습니다. 그리고 이번에는 개발자의 말뿐이 아니라 검증 가능한 사실입니다: 확정 시그널은 캔들 종가에서만 표시되며, 자동화 테스트에서 리페인팅 0건 이 확인되었습니다(EURUSD, XAUUSD, BTCUSD에서 2,486,568회의 불변조건 검사 — 위반 0건). 검증 방법은 공개되어 있으니 전략 테스터에서 직접 재현해 보실 수
Neuro Poseidon MT5
Daria Rezueva
4.85 (54)
Neuro Poseidon is a new indicator by Daria Rezueva. It combines precise trading signals with adaptive TP/SL levels - creating best possible trades as a result! Message me and get  Neuro Poseidon Assistant  as a gift to automize your trading process! What makes it stand out? 1. Proven profitability on all assets and timeframes 2. Only confirmed BUY and SELL signals present on the chart 3. Adaptive TP & SL levels generated by the software for each trade 4. Easy to understand - suitable for al
Atomic Analyst MT5
Issam Kassas
4.41 (49)
이 제품은 2026년 시장에 맞게 업데이트되었으며 최신 MT5 빌드에 최적화되었습니다. 가격 업데이트 안내: Atomic Analyst는 현재 $99 에 제공됩니다. 다음 30회 구매 후 가격은 $199 로 인상됩니다. 특별 혜택: Atomic Analyst 구매 후 저에게 개인 메시지를 보내시면 Smart Universal EA를 무료 로 받을 수 있으며, Atomic Analyst 신호를 자동 거래로 전환할 수 있습니다. Atomic Analyst는 리페인트 없음, 재그리기 없음, 지연 없음의 Price Action 거래 인디케이터로, 수동 거래, 신호 명확성, EA 자동화를 위해 설계되었습니다. User manual: settings, inputs and strategy.   &   User Manual PDF . 가격 움직임, 강도, 모멘텀, 다중 시간대 방향 및 고급 필터를 분석하여 트레이더가 노이즈를 줄이고 약한 세팅을 피하며 더 체계적인 거래 결정을 내릴 수 있도록
UZFX {SSS} 스캘핑 스마트 시그널 v4.0 MT5는 급변하는 시장에서 정확한 실시간 시그널을 필요로 하는 스캘퍼, 데이 트레이더, 스윙 트레이더를 위해 설계된 리페인팅이 없는 고성능 트레이딩 지표입니다. (UZFX-LABS)에서 개발한 이 지표는 가격 움직임 분석, 추세 확인 및 스마트 필터링을 결합하여 모든 통화 쌍과 시간대에서 높은 확률의 매수 및 매도 신호, 경고 신호, 추세 지속 기회를 생성합니다. 거래에 대한 의구심을 떨쳐버리고, 명확성, 정밀성, 그리고 규율 있는 시장 실행을 원하는 트레이더를 위해 설계된 체계적인 신호 시스템을 따르기 시작하세요. 제 추천* 최적의 시간대: 15분 이상. {H1}이 제가 가장 선호하는 시간대입니다. 그리고 그 결과는 정말 놀라울 정도입니다...!! 주요 기능 업데이트 • 자동 매수 및 매도 신호 감지 • 고급 반전 인식 로직 • 잠재적인 시장 반전 전 조기 경고 신호 • 추세 지속 확인 신호 • 진입, 손절, TP1, TP2,
Gann Made Easy MT5
Oleg Rodin
5 (9)
Gann Made Easy 는 mr.의 이론을 사용하여 최고의 거래 원칙을 기반으로 하는 전문적이고 사용하기 쉬운 Forex 거래 시스템입니다. W.D. 간. 이 표시기는 Stop Loss 및 Take Profit Levels를 포함하여 정확한 BUY 및 SELL 신호를 제공합니다. PUSH 알림을 사용하여 이동 중에도 거래할 수 있습니다. 구매 후 거래 방법 안내 및 유용한 추가 지표를 무료로 받으시려면 저에게 연락주세요! 아마도 Gann 거래 방법에 대해 이미 여러 번 들었을 것입니다. 일반적으로 Gann의 이론은 초보자 거래자뿐만 아니라 이미 거래 경험이 있는 사람들에게도 매우 복잡한 것입니다. Gann의 거래 방식은 이론적으로 적용하기 쉽지 않기 때문입니다. 나는 그 지식을 연마하고 Forex 지표에 최고의 원칙을 적용하기 위해 몇 년을 보냈습니다. 표시기는 적용하기가 매우 쉽습니다. 차트에 첨부하고 간단한 거래 권장 사항을 따르기만 하면 됩니다. 지표는 지속적으로 시장 분석
Divergence Bomber
Ihor Otkydach
4.89 (93)
가끔은 제가 직접 이 시스템을 이용해 거래를 하곤 합니다. 실계좌에서 제가 직접 수행하는 BOMBER 트레이딩을 확인해 보세요 - LIVE SIGNAL 이 지표를 구매하신 분께는 다음과 같은 혜택이 무료로 제공됩니다: 각 거래를 자동으로 관리하고, 손절/익절 수준을 설정하며, 전략 규칙에 따라 거래를 종료하는 전용 도우미 툴 "Bomber Utility" 다양한 자산에 맞게 지표를 설정할 수 있는 셋업 파일(Set Files) "최소 위험", "균형 잡힌 위험", "관망 전략" 모드로 설정 가능한 Bomber Utility의 셋업 파일 이 전략을 빠르게 설치, 설정, 시작할 수 있도록 돕는 단계별 영상 매뉴얼 주의: 위의 모든 보너스를 받기 위해서는 MQL5 개인 메시지 시스템을 통해 판매자에게 연락해 주세요. 독창적인 커스텀 지표인 “Divergence Bomber(다이버전스 봄버)”를 소개합니다. 이 지표는 MACD 다이버전스(괴리) 전략을 기반으로 한 올인원(All-in-On
Trend Catcher ind mt5
Ramil Minniakhmetov
5 (18)
트렌드 캐처 인디케이터 트렌드 캐처 인디케이터는 개발자가 자체 개발한 맞춤형 적응형 트렌드 분석 지표들을 조합하여 시장 가격 움직임을 분석합니다. 단기적인 노이즈를 제거하고 근본적인 모멘텀 강도, 변동성 확대, 가격 구조 움직임에 집중하여 진정한 시장 방향을 파악합니다. 또한 이동 평균, RSI, 변동성 필터와 같은 맞춤형 지표들을 활용하여 가격을 평활화하고 트렌드를 필터링합니다. 실제 운영 모니터링 및 기타 제품은 다음 링크에서 확인하실 수 있습니다:   https://www.mql5.com/en/users/mechanic/seller 텔레그램에서는 EA나 설정 파일을 판매하지 않습니다. 사기이니 주의하세요. 모든 설정 파일은 블로그에서 무료로 제공됩니다. 중요! 구매 후 즉시 연락 주시면 사용 방법 및 보너스를 드립니다!
Crystal Heikin Ashi Signals
Muhammad Jawad Shabir
5 (3)
Crystal Heikin Ashi Signals - Professional Trend & Signal Detection Indicator Advanced Heikin Ashi Visualization with Intelligent Signal System for Manual & Automated Trading Final Price: $149 ---------> Price goes up $10 after every 10 sales . Limited slots available — act fast . Overview Crystal Heikin Ashi Signals is a professional-grade MetaTrader 5 indicator that combines pure Heikin Ashi candle visualization with an advanced momentum-shift detection system. Designed for both manual traders
Power Candles MT5
Daniel Stein
5 (9)
Power Candles V3 - 자체 최적화 강도 지표 파워 캔들 V3는 적용된 모든 차트에서 통화 및 상품의 강세를 실행 가능한 거래 계획으로 전환합니다. 단순히 캔들에 색상을 입히는 대신, 백그라운드에서 실시간 자동 최적화를 수행하여 현재 보고 있는 종목에 대한 최적의 손절매, 익절 및 신호 임계값을 제공합니다. 한 번의 클릭으로 실시간 거래에 적용할 수 있으며, 진입점, 손절매 및 익절 선이 정확한 가격에 맞춰 차트에 표시되고, 방향과 함께 알림이 발령됩니다. 이 도구는 Stein Investments 에코시스템의 일부입니다. 18개 이상의 도구와 함께 당신의 1대1 AI 트레이딩 멘토 Max.  항상 대기 중, 모든 인디케이터를 깊이 있게 이해, 무언가를 차근차근 생각해보고 싶은 순간에 도움을 줍니다.  https://stein.investments 에서 만나보세요 매 종가 바마다 3,000회 이상의 트레이딩 시뮬레이션. 9가지 강도 상태. 2가지 전략을 병렬로 테스트.
이 제품은 2026년 시장에 맞게 업데이트되었으며 최신 MT5 빌드에 최적화되었습니다. 가격 업데이트 안내: Smart Price Action Concepts는 현재 $200 에 제공됩니다. 다음 30회 구매 후 가격은 $299 로 인상됩니다. 특별 혜택: 구매 후 저에게 개인 메시지를 보내시면 무료 보너스 + 선물 을 받을 수 있습니다. 먼저, 이 트레이딩 도구는 리페인트 없음, 재그리기 없음, 지연 없음의 인디케이터이므로 전문적인 트레이딩에 적합하다는 점을 강조하고 싶습니다. Online course , and manual Smart Price Action Concepts Indicator는 초보자와 경험 많은 트레이더 모두에게 매우 강력한 도구입니다. 20개 이상의 유용한 인디케이터를 하나로 결합하고, Inner Circle Trader Analysis와 Smart Money Concepts Trading Strategies 같은 고급 트레이딩 아이디어를 통합합니다. 이 인디
M1 Quantum MT5
Hamed Dehgani
4.27 (11)
M1 Quantum을 이용한 실시간 트레이딩 신호 : 신호   ( Quantum Trade Assistant 에 의해 거래가 자동으로 실행되며, 이 제품에 무료 로 포함되어 있습니다.) 최신 소식: 버전 1.64가 출시되었습니다. 이제 모든 거래에는 해당 지지/저항 구간 뒤에 Stop Loss가 설정됩니다. 또한 이번 버전에서는 EA의 성능을 향상시키기 위해 Smart Close 기능이 개선되었습니다. 8월 9일부터 라이브 신호는 버전 1.64로 운영되고 있습니다. 가격 계획: 현재 가격: $169 (얼리 어답터 혜택) 다음 예정 가격: $189 예정 소매 가격: $299 개발자 안내: 구매 후 저에게 연락하시면 최신 권장 설정 파일(Set File) , 사용 팁, 그리고 다른 M1 Quantum 사용자들과 소통할 수 있는 VIP 지원 그룹 초대장을 받으실 수 있습니다. 자주 묻는 질문 - 설정 파일 - 설치 가이드 M1 Quantum 은 M1 전용 전문 트레이딩 시스템으로, 손
Atbot
Zaha Feiz
4.69 (55)
AtBot: 작동 방식 및 사용 방법 ### 작동 방식 MT5 플랫폼용 "AtBot" 지표는 기술 분석 도구의 조합을 사용하여 매수 및 매도 신호를 생성합니다. 01:37 단순 이동 평균(SMA), 지수 이동 평균(EMA), 평균 진폭 범위(ATR) 지수를 통합하여 거래 기회를 식별합니다. 또한 Heikin Ashi 캔들을 사용하여 신호의 정확성을 향상시킬 수 있습니다. 구매 후 리뷰를 남기면 특별 보너스 선물을 받게 됩니다. ### 주요 기능: - 비재표시: 신호는 플로팅 후 변경되지 않습니다. - 비재작성: 신호는 일관되며 변경되지 않습니다. - 지연 없음: 지연 없이 시기적절한 신호를 제공합니다. - 다양한 시간대: 거래 전략에 맞게 모든 시간대에서 사용할 수 있습니다. ### 운영 단계: #### 입력 및 설정: - firstkey (TrendValue): 추세 감지의 민감도를 조정합니다. - Secondkey (SignalValue): 매수/매도 신호 생성의 민감도를 정의
Azimuth Pro
Ottaviano De Cicco
5 (7)
Azimuth Pro V2: Synthetic Fractal Structure and Confirmed Entries for MT5 Overview Azimuth Pro is a multi-level swing structure indicator by Merkava Labs . Four nested swing layers, swing-anchored VWAP, ABC pattern detection, three-timeframe structural filtering, and closed-bar confirmed entries — one chart, one workflow from micro-swings to macro-cycles. This is not a blind signal product. It is a structure-first workflow for traders who care about location, context, and timing. ️ Summer Sale
Reversion King Indicator
Eugen-alexandru Zibileanu
5 (5)
새로운 왕의 등장 - 인디케이터 + 주문 관리 표시(TP1 + TP2 + TP3) + 선택형 텔레그램 시그널 전송 기능 포함 (무료) (완전한 트레이딩 및 시그널 시스템) 골드를 위한 최고의 EA: Gold Slayer 이 인디케이터는 고급 전략, 사용자 지정 가능한 주문 관리 시스템, 그리고 엔벨로프 확장을 결합한 평균 회귀(mean reversion) 시스템을 포함하고 있습니다. 또한 RSI와 같은 여러 지능형 확인 필터를 통해 높은 확률의 반전 진입 구간을 포착하여 BUY 및 SELL 시그널을 제공합니다. 단순히 거래 방법만 배우는 것이 아니라, 여러 포지션을 효과적으로 관리하고 이전에 수익 중인 오픈 포지션으로 손실 거래를 커버하는 방법까지 익힐 수 있습니다. M5 전용으로 설계 및 최적화되었으며, 유동성이 풍부해 시그널이 더 깔끔하고 신뢰도 높은 BTCUSD와 XAUUSD에서 뛰어난 성능을 발휘합니다. 이 인디케이터는 ATR 기반으로 자동 계산된 진입가, 손절가, 익절가와
Btmm state engine pro
Garry James Goodchild
5 (4)
BTMM State Engine Pro by G-Labs — Beat The Market Maker indicator for MetaTrader 5. Asian session range, London and New York kill zones, level progression (L1/L2/L3), peak formation detection (PFH/PFL), entry signals, and a multi-pair scanner from one chart. Stop scanning charts one pair at a time. The State Engine tracks the BTMM daily cycle automatically — Asian box, room boundaries, level blocks, peak formations, and filtered entries — while the scanner dashboard shows level, peak status, d
The Oracle Pro
Ottaviano De Cicco
5 (1)
The Oracle Pro: Synthetic Multi-Timeframe Bias Engine for MT5 ️ Summer Launch Offer — Get The Oracle Pro for USD 199 (early buyers). Price rises with traction; final price USD 399. The Oracle Pro is a premium multi-timeframe bias engine for MetaTrader 5, built for demanding and professional traders. It answers one question with discipline: what is the directional bias on each timeframe right now, how strong is it, and how much do the timeframes agree? Everything is computed on closed bars only
SkyHammer Signal Pro
Shengzu Zhong
5 (4)
SkyHammer Signal Pro Entry, SL, TP 레벨이 고정되는 전문 No-Repaint 추세 신호 인디케이터 SkyHammer Signal Pro는 명확하고 고정되며 검증 가능한 신호를 원하는 트레이더를 위해 설계된 구조적인 추세 및 모멘텀 신호 인디케이터입니다. 특히 M1 및 M5 같은 낮은 시간대에서 가장 효과적으로 작동합니다. 이 인디케이터는 시장의 고점이나 저점을 예측하려고 하지 않습니다. 대신 신호를 생성하기 전에 확인된 시장 구조, 추세 방향, 모멘텀 강도, 건강한 변동성, 그리고 목표까지의 충분한 공간을 기다립니다. 주요 기능 고정 신호 메커니즘 신호가 확인되면 화살표, Entry, Stop Loss, TP1, TP2 레벨이 차트에 영구적으로 고정됩니다. 이후 캔들 움직임 때문에 신호가 사라지거나, 이동하거나, 변경되지 않습니다. 이를 통해 트레이더는 각 신호를 명확하게 검토할 수 있으며, 실시간 시장에서 신호가 사라지는 일반적인 문제를 피할 수 있습니다
Trade smarter, not harder: Empower your trading with Harmonacci Patterns This is arguably the most complete harmonic price formation auto-recognition indicator you can find for the MetaTrader Platform. It detects 19 different patterns, takes fibonacci projections as seriously as you do, displays the Potential Reversal Zone (PRZ) and finds suitable stop-loss and take-profit levels. [ Installation Guide | Update Guide | Troubleshooting | FAQ | All Products  ] It detects 19 different harmonic pric
Quantum TrendPulse
Bogdan Ion Puscasu
5 (25)
SuperTrend   ,   RSI   ,   Stochastic   의 힘을 하나의 포괄적인 지표로 결합하여 트레이딩 잠재력을 극대화하는 궁극의 트레이딩 도구   인 Quantum TrendPulse를   소개합니다. 정밀성과 효율성을 추구하는 트레이더를 위해 설계된 이 지표는 시장 추세, 모멘텀 변화, 최적의 진입 및 종료 지점을 자신 있게 식별하는 데 도움이 됩니다. 주요 특징: SuperTrend 통합:   주요 시장 추세를 쉽게 따라가고 수익성의 물결을 타세요. RSI 정밀도:   매수 과다 및 매도 과다 수준을 감지하여 시장 반전 시점을 파악하는 데 적합하며 SuperTrend 필터로 사용 가능 확률적 정확도:   변동성이 큰 시장에서 숨겨진 기회를 찾기 위해 확률적 진동   을 활용하고 SuperTrend의 필터로 사용 다중 시간대 분석:   M5부터 H1 또는 H4까지 다양한 시간대에 걸쳐 시장을 최신 상태로 유지하세요. 맞춤형 알림:   맞춤형 거래 조건이 충족되면
FX Power MT5 NG
Daniel Stein
5 (33)
FX Power: 통화 강세 분석으로 더 스마트한 거래 결정을 개요 FX Power 는 어떤 시장 상황에서도 주요 통화와 금의 실제 강세를 이해하기 위한 필수 도구입니다. 강한 통화를 매수하고 약한 통화를 매도함으로써 FX Power 는 거래 결정을 단순화하고 높은 확률의 기회를 발견합니다. 트렌드를 따르거나 극단적인 델타 값을 사용해 반전을 예측하고자 한다면, 이 도구는 귀하의 거래 스타일에 완벽히 적응합니다. 단순히 거래하지 말고, FX Power 로 더 스마트하게 거래하세요. 1. FX Power가 거래자에게 매우 유용한 이유 통화와 금의 실시간 강세 분석 • FX Power 는 주요 통화와 금의 상대적 강세를 계산하고 표시하여 시장 역학에 대한 명확한 통찰력을 제공합니다. • 어떤 자산이 앞서고 있고 어떤 자산이 뒤처지는지 모니터링하여 보다 현명한 거래 결정을 내릴 수 있습니다. 포괄적인 멀티 타임프레임 뷰 • 단기, 중기 및 장기 타임프레임에서 통화와 금의 강세를
Axiom Matrix
Issam Kassas
5 (5)
AXIOM MATRIX MT5 출시 가격: $99 Axiom Matrix는 출시 가격 $99에 제공됩니다. 첫 30회 구매 이후 가격은 $199로 인상됩니다. 구매 후, 안내 사항을 받고 독점 선물 보너스를 받기 위해 저에게 직접 DM을 보내주세요. Axiom Matrix는 MetaTrader 5용 전문 멀티 심볼, 멀티 타임프레임 시장 스캐너이자 의사결정 대시보드입니다. Axiom Matrix는 사용자의 Market Watch를 스캔하고, 여러 타임프레임을 분석하며, 여러 근거 엔진을 읽고, 가장 강한 기회를 비교하여 하나의 깔끔한 매트릭스 대시보드 안에서 최적의 BUY, SELL, WAIT 또는 차단 상태를 보여줍니다. 저는 무거운 시장 스캔 작업을 대신 처리해 줄 수 있는 하나의 도구가 필요했기 때문에 Axiom Matrix를 만들었습니다. 저는 RSI만 따로 확인하고 싶지 않았습니다. 그다음 MACD만 따로 확인하고. 그다음 이동평균. 그다음 거래량. 그다음 변동성. 그다음
FX Trend MT5 NG
Daniel Stein
5 (6)
FX Trend NG: 차세대 멀티 마켓 트렌드 인텔리전스 개요 FX Trend NG 는 다중 시간 프레임 기반의 전문 트렌드 분석 및 시장 모니터링 도구입니다. 몇 초 만에 전체 시장 구조를 파악할 수 있도록 설계되었습니다. 여러 차트를 일일이 전환할 필요 없이, 어떤 종목이 추세에 있는지, 어디에서 모멘텀이 약화되고 있는지, 그리고 어떤 시간 프레임이 서로 정렬되어 있는지 즉시 확인할 수 있습니다. 출시 기념 특별 혜택 – FX Trend NG 를 $30 (6개월) 또는 $80 평생 라이선스 로 이용할 수 있습니다. 이미 Stein Investments 고객이신가요? -> 메시지를 보내 전용 고객 그룹에 참여하세요. 설정이나 사용 방법이 필요하신가요? -> Stein Investments 공식 페이지 를 방문하세요. 1. FX Trend NG가 특별한 이유 3단계 추세 로직 – 단순한 Buy / Sell이 아닙니다 • 대부분의 지표는 Buy 또는 Sell 두 가지 상태만 제
SR Liquidity 는 시장 유동성이 집중되고 가격이 가장 강력하게 반응하는 숨겨진 구간을 포착하도록 설계된 트레이딩 지표입니다. 이러한 특수 유동성 구간은 강력한 지지 및 저항선 역할을 하며, 시장 반전 가능성이 가장 높은 지점을 명확하게 보여주는 지도가 되어 줍니다. SR Liquidity는 일반적인 지지 및 저항선을 단순히 그리는 대신, 실제 가격 움직임을 분석하여 매수 및 매도 압력이 집중되는 구간을 포착합니다. 이러한 구간은 실질적인 시장의 흐름을 주도하는 유동성 풀(liquidity pools)에 해당합니다. 이 지표는 해당 구간을 차트에 직접 시각화하여, 가격 반응이 실제로 나타나기 전에 이를 미리 예측할 수 있도록 돕습니다. 즉, 가격 추세가 전환될 가능성을 사전에 파악하게 해주는 것입니다. 결과적으로 이 지표는 가공되지 않은 가격 움직임(price action)을 시장의 핵심 가격대, 다시 말해 추세 전환점이 될 수 있는 지점들을 보여주는 명확하고 실용적인 로드맵
제작자의 제품 더 보기
KD HTF Candles
Dien Du Khanh Duong
KD_HTFCandles — See Higher Timeframe Structure Without Leaving Your Chart Part of the KD Trading Suite — Trade with Context. Not Guesswork. The Problem Every effective trader knows the rule: check the higher timeframe to know where the real trend is. Multiple monitors and extra chart windows help — but every switch still breaks your focus, and by the time you've checked the HTF chart and come back, you've lost the read you were building on your entry timeframe. What KD_HTFCandles Does KD_HTFCand
FREE
KD MTF Dashboard
Dien Du Khanh Duong
KD_MTFDashboard — Multi-Timeframe Indicator Confirmation, One Glance Part of KD Trading Suite — Trade with Context. Not Guesswork. Purpose Trend and momentum rarely tell the full story on just one timeframe. A bullish signal on M15 means a lot more — or a lot less — depending on what H1 and H4 are showing. Most traders know this, but checking it manually means flipping between charts and trying to hold five numbers in your head at once. KD_MTFDashboard exists to remove that friction: one tabl
FREE
KD MTF Candle Timer
Dien Du Khanh Duong
KD_MTFCandleTimer — Multi-Timeframe Candle Countdown & UTC Clock Part of KD Trading Suite — Trade with Context. Not Guesswork. Know Exactly When Every Candle Closes One clean list on your chart. Countdowns for every timeframe that matters — M1, M5, M15, H1, H4, D1 — plus Server Time & Local Time (auto UTC offset). No more guessing, no more switching charts. Color Tells You When to Pay Attention Time Left Color Meaning > 75% Green Relax 50–75% Yellow Getting closer 25–50% Orange Sta
FREE
필터:
리뷰 없음
리뷰 답변