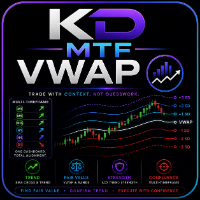
KD Mtf VWAP
- 指标
-
Dien Du Khanh Duong
 KD Trading System: Trade with context. Read structure. Confirm across timeframes. Plan the risk.
==================================================================================== - 版本: 2.2
- 更新: 16 九月 2026
- 激活: 10
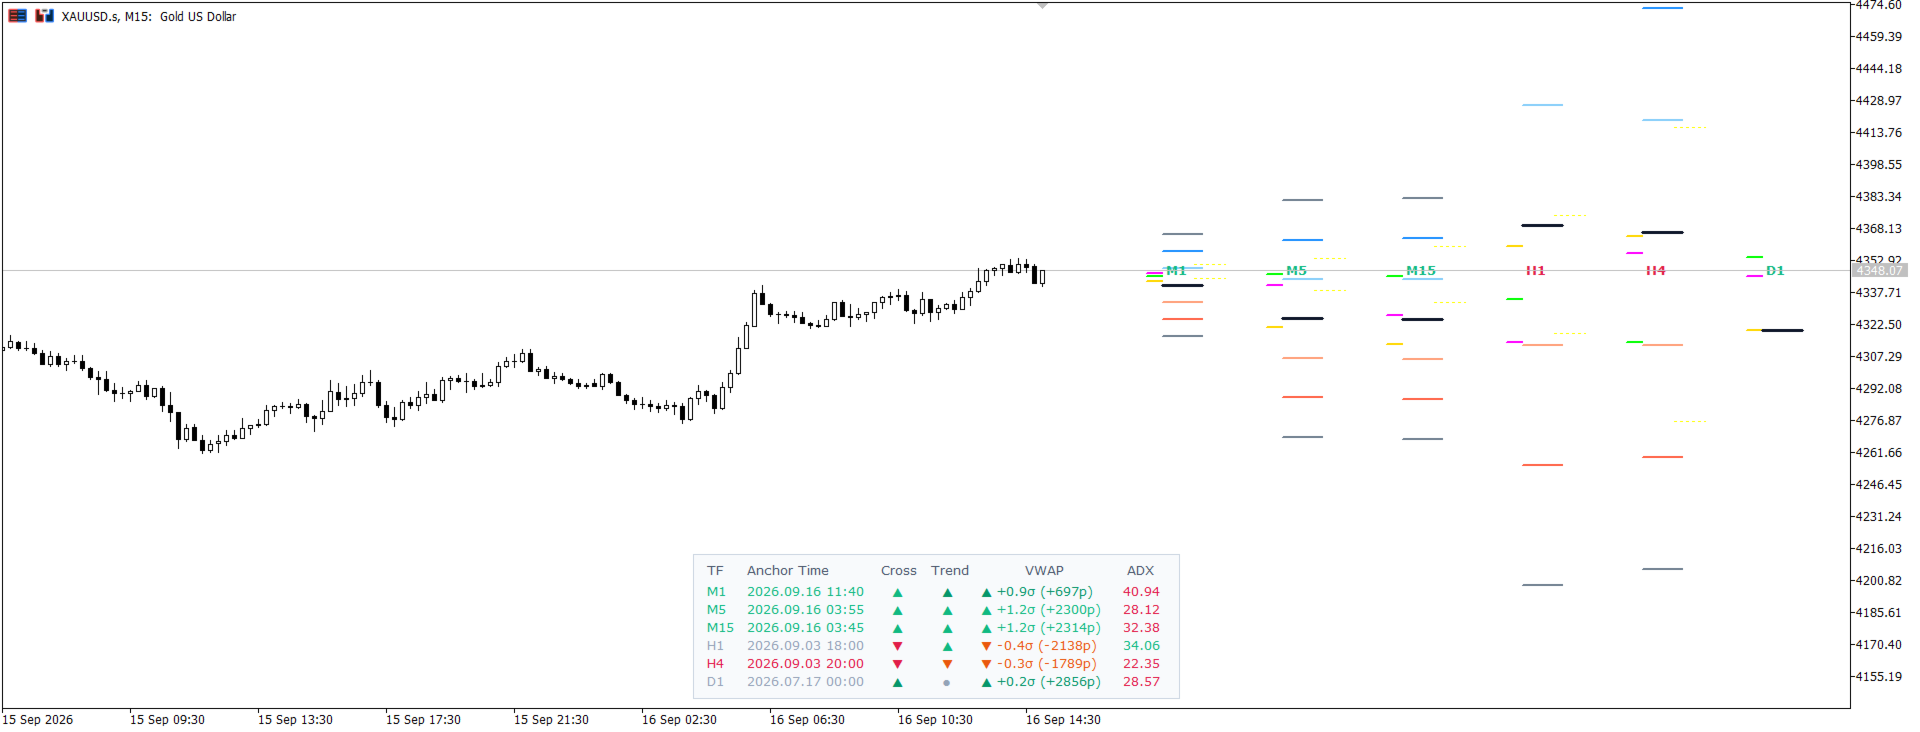
KD MTF VWAP is a Volume Weighted Average Price (VWAP) indicator for MetaTrader 5, designed for lower-timeframe traders (M1, M5, M15) and intraday momentum trading. It projects multi-timeframe Anchored VWAPs, 3-Tier Standard Deviation Bands (±1σ, ±2σ, ±3σ), EMA trend filters, and a Sigma & Pip Distance HUD onto a single chart.
VWAP is a benchmark commonly referenced in institutional and algorithmic trading. Combining multi-timeframe VWAP projections with standard deviation bands can help identify statistically extended price conditions and areas where liquidity may rebalance.
Key Features
- Multi-Timeframe VWAP Projection: Plot and project M1, M5, M15, H1, H4, and Daily VWAP lines directly on your execution chart without switching tabs.
- Dynamic 3-Tier Standard Deviation Bands (±1σ, ±2σ, ±3σ): Identify statistical extremes where price is mathematically overbought/oversold relative to VWAP.
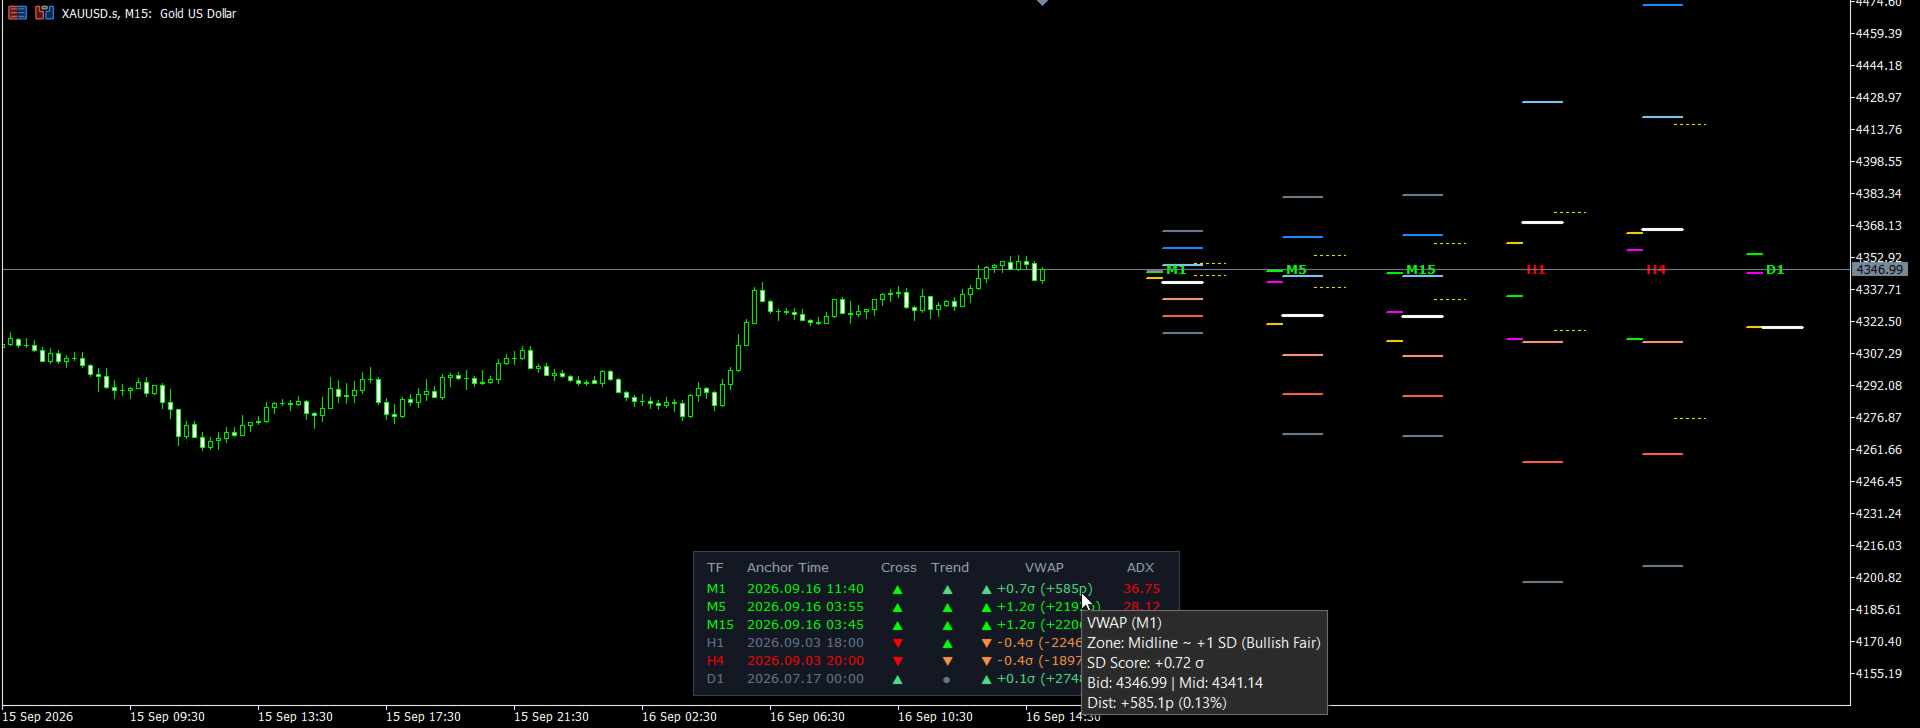
- On-Chart Heads-Up Display (HUD): A dashboard showing VWAP Standard Deviation scores (Sigma: e.g. +2.1σ ) and pip distance from VWAP across timeframes.
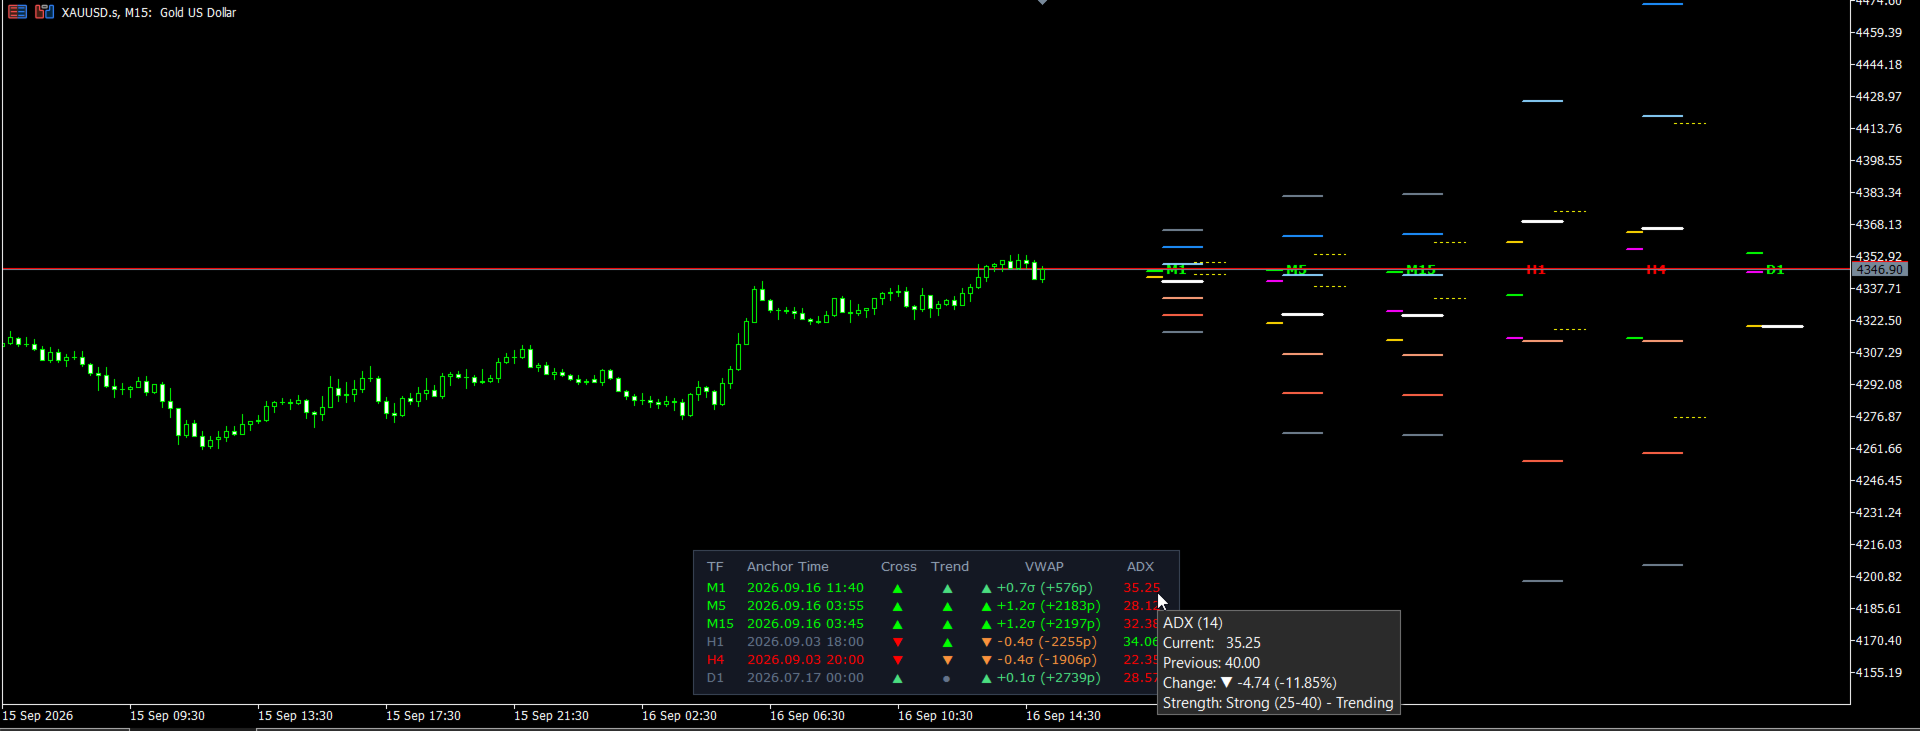
- Triple EMA & ADX Trend Filter: Built-in EMA 9, 50, 200 crossover logic and ADX trend strength filtering to help assess the prevailing trend before trading.
- ZigZag Structure Integration: Identifies swing highs/lows aligned with VWAP reactions.
- Adaptive Theme System: Supports Dark Slate, Light Slate, Custom, and Auto-Detect color schemes with 6 flexible screen anchor positions.
- Optimized Performance: Buffer caching is used to reduce lag during fast market conditions.
Synergy with the KD Trading System
KD MTF VWAP is the 4th pillar — a volume and fair-value reference within the system:
- KD Ultimate SMC: Maps structure shifts (BOS/CHoCH), Order Blocks and Liquidity Pools that this tool's VWAP reactions can be compared against.
- KD SMC Mini Charts: Displays higher/lower-timeframe structural context alongside this tool's VWAP lines.
- KD Auto SLTP: Can set a Stop Loss and Take Profit once this tool's reading supports an entry.
- KD MTF VWAP (This Tool): Provides institutional volume benchmark levels and Standard Deviation reference points for M1/M5 entries.
- KD MTF Candle Timer: Can be used to wait for bar closure before acting on this tool's bands.
- KD HTF Candles: Higher-timeframe candlestick context around VWAP reactions.
- KD MTF Dashboard: Can be used to check whether the trend is strong or ranging before treating a Standard Deviation Band touch as a reversal zone.
Practical Use Cases
Use Case 1: The Mean Reversion Reading (M1 / M5)
- Setup: Price moves away from the Session VWAP and reaches the +2.0σ or +3.0σ Standard Deviation Band while inside a KD Ultimate SMC Bearish Order Block.
- In practice: The Sigma HUD shows ≥ +2.0σ with ADX showing momentum weakening.
- Purpose: Highlights a statistically extended price condition, with the central VWAP line (Mean) and a stop level from KD Auto SLTP as reference points for a trader to evaluate.
Use Case 2: The VWAP Trend Pullback (M5 / M15)
- Setup: Price is above EMA 50 & 200 (an uptrend). Price pulls back to the M15/H1 VWAP line or -1.0σ Band resting inside a bullish Fair Value Gap.
- In practice: A bullish wick forms at the VWAP line.
- Purpose: Highlights a pullback to a reference level within an existing uptrend, with the +2.0σ upper band and the previous Swing High as additional reference points.
User Settings & Customization
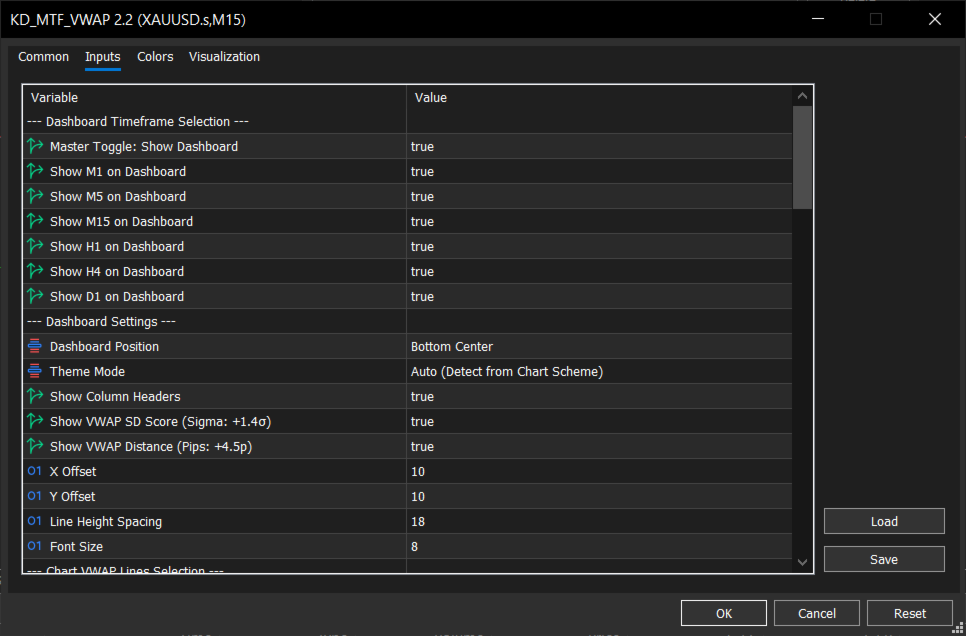
- Dashboard Timeframes: Freely toggle M1, M5, M15, H1, H4, D1 on the HUD.
- Chart VWAP Lines: Select which timeframe VWAP projection lines to display on the chart.
- SD Band Multipliers: Customize Band 1 (1.0σ), Band 2 (2.0σ), and Band 3 (3.0σ).
- Strategy Filters: Adjust EMA Fast (9), EMA Trend (50), EMA Slow (200), ATR Period (14), and ADX Period (14).
- Visuals & HUD: Customize HUD corner anchor, theme mode, font size, line thickness, and color scheme.