Volume Trio Multi

  • Indicators
  • Seckin Erkut
    Seckin Erkut
    Algo Trading Systems Developer. I develop strategies and portfolios not by hypes but from solid academic literature.

    I put my money where my mouth is, be sure to check the performance of my EAs through my signals.
  • Version: 1.42
  • Updated: 7 August 2026
  • Activations: 10

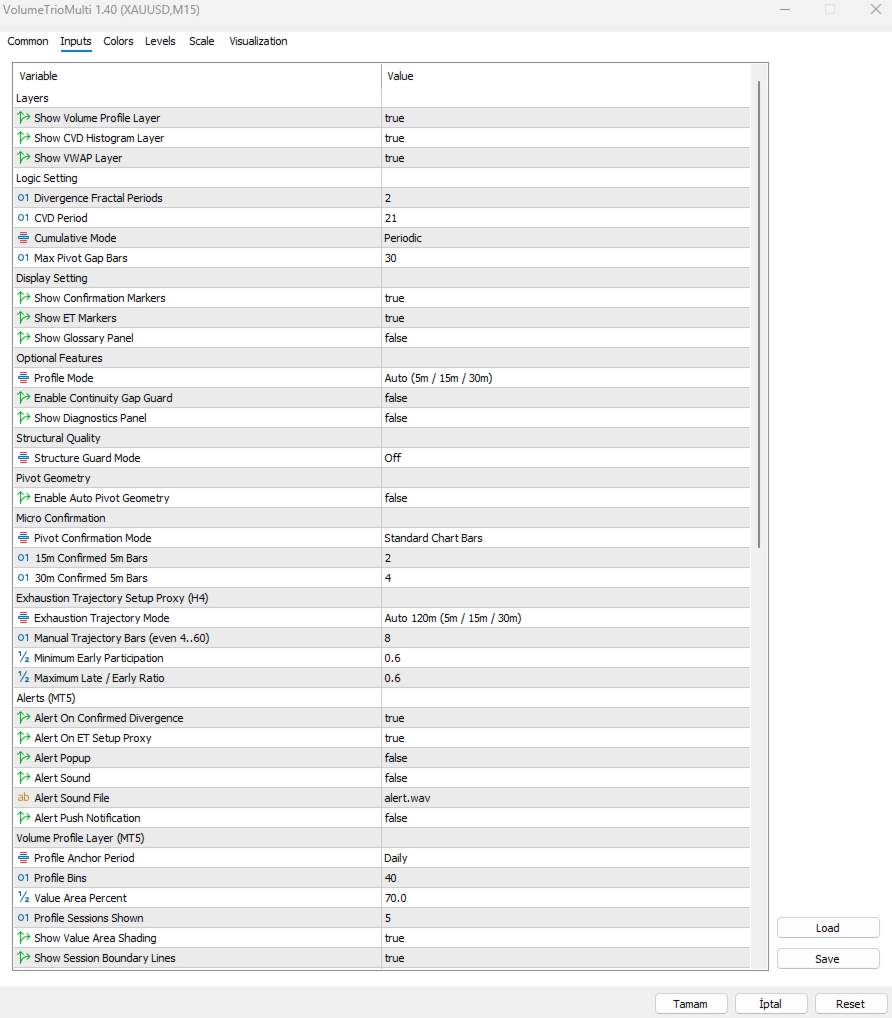
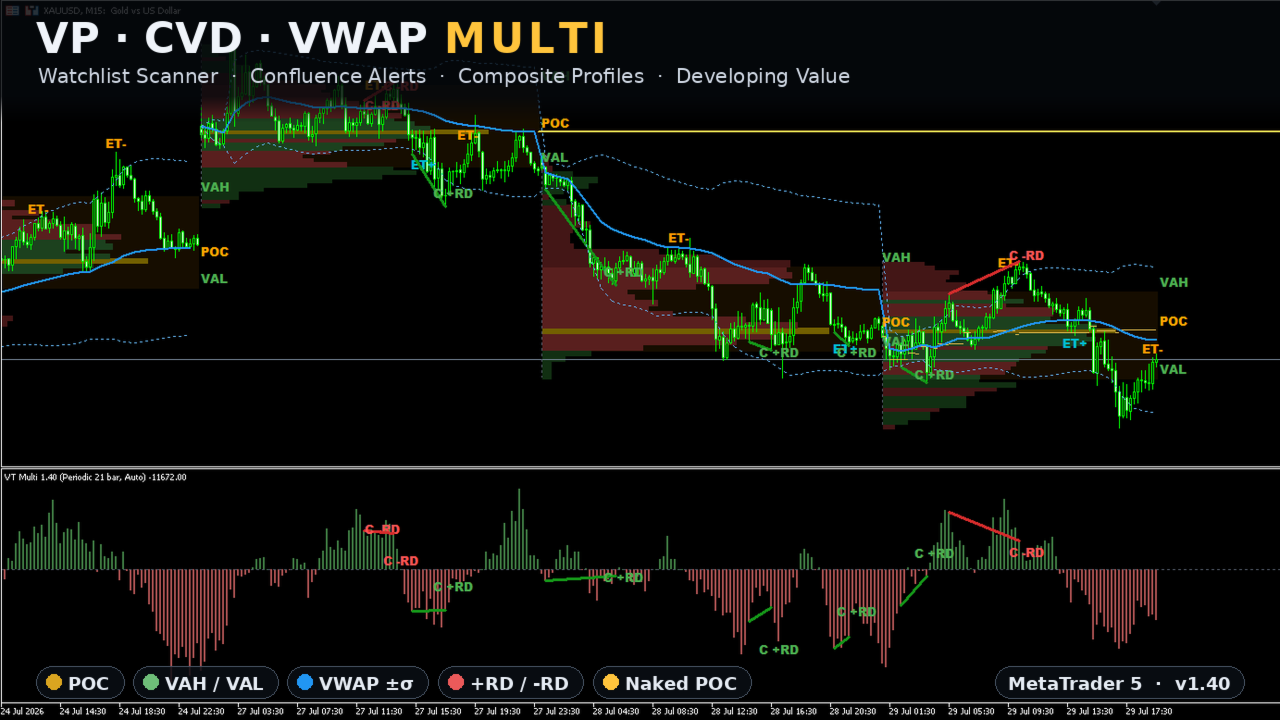
Volume Trio Multi is a three-layer market-structure tool for MetaTrader 5: session Volume Profile (POC, VAH/VAL, Value Area), a CVD volume-pressure histogram with a strict Regular divergence engine, and anchored VWAP with standard-deviation bands — extended with a watchlist scanner that runs all three across the symbols in your Market Watch.

This is the Pro edition of my free indicator, Volume Trio. The base engine is identical, so this page describes only what Pro adds. For the three layers themselves, every chart abbreviation, the WHERE / WHEN / HOW FAR reading framework and the complete input reference, please see the free product page:

https://www.mql5.com/en/market/product/187983

What Pro adds

1. Watchlist scanner and dashboard

The free edition reads the chart it is attached to. Multi runs the same three-layer logic across the symbols already in your Market Watch and tells you which one deserves a look by alerting you — no symbol list to type, no broker suffixes to match, no configuration beyond two settings: how many symbols to cover (up to 50) and which timeframe to scan. A custom comma-separated list is available if you want a different subset.

Each symbol is recomputed from a fresh closed-bar window whenever that symbol prints a new bar, in a staggered pass that keeps the terminal responsive. Nothing is carried between passes, so scrolling, reloading or reattaching reproduces the identical state.

The on-chart dashboard shows every scanned symbol in aligned columns: band state, divergence state, key-zone state, the resulting signal and the last close. Click any row and that symbol opens on the scan timeframe.

This feature promises time, not profit. You cannot watch thirty charts at once; this watches them for you.


2. Confluence alerts

The free page suggests two ways to read the three layers together — a reversal at stretch and a continuation at VWAP. The scanner turns both into monitored conditions.

Reversals — alerts fire on two independent, divergence-anchored pairs:

  • Sigma-band tag plus a confirmed divergence in the same direction.
  • Key zone plus a confirmed divergence, where a key zone is a session POC, VAH, VAL or an untouched prior POC within an ATR-scaled tolerance of the event price.

Either pair alerts on its own; when both align on the same bar, one alert reports all three components. The alert text names the legs that fired, for example: Scanner Confluence, BULL, EURUSD, M5, -2.0s tag + RD + key zone.

The band multiplier is inherited from your VWAP setting by default, so if you work at 3 sigma the scanner triggers at 3 sigma. It can also be overridden independently if you want to watch the chart at one distance and be alerted at another. Recency windows and the zone tolerance are adjustable.

Continuations — one alert for the day's trend defending its average:

- One side of VWAP has held most of the session's closes (the accepted side), and price has stretched away from the line on that side. - Price returns to VWAP and a confirmed divergence prints back in the accepted direction: "Scanner Continuation" fires, once per touch of VWAP, with its own on/off switch. It is context, not a trigger.


3. Composite profiles

Merge the last N sessions, or any custom date range, into one profile with its own POC, VAH and VAL (labelled cPOC, cVAH, cVAL). This is a genuine re-binning across the merged range, not a sum of session profiles, so the composite POC is the true high-activity price of the whole period.

Three display modes: Sessions as before, Composite alone, or Both — with the composite rendered behind the session profiles at reduced opacity.

4. Developing POC and Value Area, and VPOC migration

Watch value form in real time. For every closed bar of the active session, the profile is rebuilt over the range seen so far and the POC and Value Area of that moment are recorded, drawn as a step trace. You see where the POC has migrated during the session rather than only where it ended.

A separate migration line connects the final POC of each session to the next, showing how the centre of value has travelled across sessions. The POC trace is on by default; the Value Area traces and the migration line are off by default to keep the chart clean.

5. Naked POC tracking

Every completed session POC that price has not returned to is projected forward as a ray until it is touched. These untouched levels are the unfinished business of the profile: prices where the market once accepted heavily and has not revisited.

The touch rule is inclusive and immune to the session that created the level. Touched levels can be shown as faded history or hidden entirely, and an optional alert fires the moment price reaches one.

6. Hover tooltips on every line

Every line on the chart identifies itself. Session boundaries, developing traces, migration links, naked POC rays, divergence lines and the profile labels all carry a hover tooltip. Hovering a POC label gives the full session summary; hovering a divergence line tells you which pivots it joins. Nothing on the chart is left unexplained.

7. Granular visibility and alert control

Thirteen independent visibility switches let you build the chart you want, from a bare profile to the full picture. Alert sources are separated as well: divergence, ET, naked POC touch, scanner confluence and scanner continuation each have their own switch, sharing the popup, sound and push delivery channels. If you want only scanner alerts, turn the others off.

Honest scope

All readings derive from provider-local volume and OHLC. This is a pressure proxy, not centralised order flow, and the output is analytical context — never a buy or sell instruction. No profitability is claimed or implied.

Everything is deterministic on closed bars. The scanner is off by default and costs nothing until you enable it.

Quick start

  1. Attach to a 5m or 15m chart with defaults. The engine behaves exactly as the free edition until you enable the Pro layers.
  2. Turn on the watchlist scanner. The dashboard fills as each symbol prints its next bar, usually within a minute.
  3. Enable Alert On Scanner Confluence together with at least one delivery channel (popup, sound or push).
Support is handled in the Comments section of this page and through mql5.com private messages.
Recommended products
WAPV Weis Wave Chart Forex
Eduardo Da Costa Custodio Santos
The Weis Wave Chart Forex for MT5 is a Price and Volume indicator. The Price and Volume reading was widely disseminated through Richard Demille Wyckoff based on the three laws created by him: Supply and Demand, Cause and Effect and Effort vs. Result. In 1900 R.Wyckoff already used the wave chart in his analyses. Many years later, around 1990, David Weis Automated R. Wyckoff's wave chart and today we bring you the evolution of David Weis' wave chart. It shows the amount of Volume and the amount o
Desi Bulls PA King Pro
Muhammad Bilal Hussain Khan Muhammad
Desi Bulls PA King Pro — Pure Naked Price Action Sniper Indicator Desi Bulls PA King Pro is an institutional-grade, 100% NON-REPAINTING Naked Price Action indicator designed for precision scalping on Gold (XAUUSD) and Bitcoin (BTCUSD) on the M5 and M15 timeframes. Unlike conventional indicators that clutter your chart with lagging moving averages, RSI, or stochastics, PA King Pro uses pure candlestick geometry, fractal liquidity sweeps, and macro trend flow to identify high-probability instit
Weis Wave Double Side
Eduardo Da Costa Custodio Santos
The Weis Wave Bouble Side Indicator for MT5 is part of the toolkit (Wyckoff Academy Wave Market) The Weis Wave Bouble side Indicator for MT5 was created based on the already established Weis Wave created by David Weis. The Weis Wave Double Side indicator reads the market in waves as it was done by R. Wyckoff in 1900. It helps in the identification of effort x result, cause and effect, and Supply and demand Its differential is that it can be used below the zero axis, further improving plus operat
Breakout Boxes with Volume Pressure This indicator automates the identification of key consolidation zones (Supply and Demand) based on Market Pivots and Volatility (ATR). Unlike standard support/resistance tools, this indicator provides a unique   Volume Pressure Analysis   inside every box, giving you insight into the battle between Buyers and Sellers before a breakout occurs. Key Features Automated Supply & Demand Zones:   Automatically detects significant Pivot Highs and Lows to draw dyna

Introduction The Wave Trend Oscillator Indicator for MT5 is one of the well known indicators in the market, helping traders find strong entry points into the market. Like any other MetaTrader 5 indicator , it can produce both good and bad signals, but the number of accurate buy/sell signals is significantly higher than the weak ones. This makes it a powerful tool for improving your forex trading strategy , whether you are a beginner or an advanced trader. How does this indicator work? This indic
WAPV Weis Wave Chart MT5
Eduardo Da Costa Custodio Santos
The Weis Wave Chart for MT5 is a Price and Volume indicator. The Price and Volume reading was widely disseminated through Richard Demille Wyckoff based on the three laws created by him: Supply and Demand, Cause and Effect and Effort vs. Result. In 1900 R.Wyckoff already used the wave chart in his analyses. Many years later, around 1990, David Weis Automated R. Wyckoff's wave chart and today we bring you the evolution of David Weis' wave chart. It shows the amount of Volume and the amount of pips
True Weis Wave
Atila Goncalves Firmino
A version based on David Waves' description in his book 'Trade About to Happen' of his adaptation of the Wyckoff wave chart. The indicator directionally accumulates volume, adding to each brick or candle close, with color indication for up and down. it can be used it with tick or real volume, it also changes color when the accumulated value of the previous wave is exceeded, being the trade signal. Yellow color is used for doji candlestick, it will continue with accumulation without zero the sum
-  Real price is 70$ - 50% Discount (It is 35$ now) Contact me for instruction, any questions! - New Update - Lifetime update free - Non-repaint - I just sell my products in Elif Kaya Profile, any other websites are stolen old versions, So no any new updates or support. Introduction Breakout Trend Scanner indicator works based on the Elliott Wave in technical analysis describes price movements in the financial market that are related to changes in trader sentiment and psychology and finds end o
The Accumulation / Distribution is an indicator which was essentially designed to measure underlying supply and demand. It accomplishes this by trying to determine whether traders are actually accumulating (buying) or distributing (selling). This indicator should be more accurate than other default MT5 AD indicator for measuring buy/sell pressure by volume, identifying trend change through divergence and calculating Accumulation/Distribution (A/D) level. Application: - Buy/sell pressure: above
RSI Bollinger Bands Arrow Strategy is a clean and effective technical indicator designed to identify high-probability reversal points using the combination of RSI and Bollinger Bands . This strategy uses the RSI indicator together with the Bollinger Bands to: Sell when the price is above the upper Bollinger Band Buy when the price is below the lower Bollinger Band Signals are generated only when both indicators confirm the same market condition , ensuring higher accuracy and reduced false entrie
Rgt Cluster Footprint shows what regular candles hide: where volume traded inside each candle and which side dominated at every price level. Each candle is drawn as a footprint column: one bar per price level with its number, longer and stronger where more volume traded. Features Per-candle footprint: volume by price level, green when buyers dominated, red when sellers dominated. Candle POC: the highest-volume level, highlighted with a white frame and bold number. Diagonal imbalances: green (buy
CvdDeltaVolumes
Parasbhai N Patel
Delta + CVD & CVD Candles Order-flow indicator combining Delta (Ask–Bid), Cumulative Volume Delta (CVD), and a unique CVD-based synthetic candle system. Shows buy/sell pressure, volume aggressiveness, and momentum shifts with optional Delta histogram, CVD line, and CVD+Delta combined candles. Useful for scalping, intraday trading, divergence detection, and understanding buyer/seller dominance. Overview The Delta + CVD & CVD Candles Indicator combines multiple order-flow tools into one clean
Optimized Trend Tracker OTT is an indicator that provides traders to find an existing trend or in another words to ser which side of the current trend we are on. We are under the effect of the uptrend in cases where the prices are above OTT , under the influence of a downward trend, when prices are below OTT it is possible to say that we are. The first parameter in the OTT indicator set by the two parameters is the period/length. OTT will be much sensitive to trend movements if it is sma
The WaveTrend Oscillator MT5 is a powerful trading indicator designed to enhance your market analysis by identifying momentum shifts and potential trend reversals. Ideal for traders of all levels, this tool offers valuable insights into overbought and oversold conditions across various markets, including forex, cryptocurrencies, and commodities. With its ability to generate accurate buy and sell signals, the WaveTrend Oscillator MT5 empowers traders to make informed decisions, effectively increa
Weis Wave Scouter
Jean Carlos Martins Roso
Discover the power of advanced volume analysis with Weis Wave Scouter, a revolutionary indicator for MetaTrader 5 that combines the proven principles of the Wyckoff method and Volume Spread Analysis (VSA). Designed for traders seeking precision and depth in their operations, this indicator offers a tactical reading of the market through cumulative volume wave analysis, helping to identify key points of trend reversals and continuations. Weis Wave Scouter features a clear visual interface with co
Waves PRO
Flavio Javier Jarabeck
For those who appreciate Richard Wyckoff approach for reading the markets, we at Minions Labs designed a tool derived - yes, derived, we put our own vision and sauce into this indicator - which we called Waves PRO . This indicator provides a ZigZag controlled by the market volatility (ATR) to build its legs, AND on each ZigZag leg, we present the vital data statistics about it. Simple and objective. This indicator is also derived from the great book called " The Secret Science of Price and Volum
Scanner and Dashboard for Money Flow Index MT5 The Money Flow Index (MFI) is a technical oscillator that uses price and volume data for identifying overbought or oversold signals in an asset. It can also be used to spot divergences which warn of a trend change in price. The oscillator moves between 0 and 100. Advantages of the Scanner: - Full Alert Options. - Multi Timefrare  - Works for all instruments including Currencies, Indices, Commodities, Cryptocurrencies and Stocks. - Fully customisabl
Cumulative Delta Volume Indicator for MT5
Mohammad Taher Halimi Tabrizi
4.67 (3)
Cumulative Delta Volume is a technical indicator for MetaTrader 5. It calculates a volume delta value for each bar and accumulates the calculated values over time. The indicator estimates bullish and bearish volume components using the volume data available in MetaTrader 5. The difference between these components forms the delta value. The result can be displayed as candles or as a line in a separate indicator window. An optional Heikin Ashi calculation can be applied to the indicator candles. D
Wapv Price and volume
Eduardo Da Costa Custodio Santos
The WAPV Price and Volume Indicator for MT5 is part of the ( Wyckoff Academy Wave Market ) and (Wyckoff Academy Price and Volume) toolset. The WAPV Price and Volume Indicator for MT5 was created to make it easy to visualize the volume movement on the chart in an intuitive way. With it you can observe the moments of peak volume and moments when the market has no professional interest Identify moments when the market is moving by inertia and not by movement of "smart money". It consists of 4 color
Weis Wave Volume Indicator for MT5
Mohammad Taher Halimi Tabrizi
Weis Wave Volume Indicator for MetaTrader 5 (MT5) Check all of our products here: All Products Specifications Platform: MetaTrader 5 (MT5) Type: Custom Technical Trading Indicator Level: Intermediate Timeframes: All Timeframes (Multi-Timeframe Support) Trading Styles: Scalping, Day Trading, Swing Trading, Position Trading Markets: Forex, Stocks, Commodities, Indices, and Cryptocurrencies What Does This Indicator Do? The Weis Wave Volume Indicator for MT5 is a powerful Price Action + V
HVK Auto MIDAS
Julio Monteiro
4 (1)
Automatic MIDAS positioning, the indicator allows the placement of two MIDAS, each one have 3 lines that can be calculated using Open/High/Low/Close/Median/Typical or Weighted prices, you can attach each MIDAS to the Open/High/Low or Close bars of any day, including the current day, once attached, if the price of this bar changes or you change the time frame, the indicator will do the repositioning and recalculation. You can also do a manual repositioning of the two MIDAS by moving its start lab
Mini Indice Composition
Thalles Nascimento De Carvalho
Mini Índice Composition: A Revolução na Análise do Mini Índice! O Mini Índice Composition é um indicador inovador que monitora em tempo real as principais ações que compõem o mini índice, trazendo uma visão quantitativa poderosa sobre o fluxo de ordens do mercado! Como Funciona? Diferente de outros indicadores que utilizam apenas dados históricos, o Mini Índice Composition faz uma leitura ao vivo das ordens que entram e saem das ações, pesando o impacto direto no mini índice. Com
Gm Vwap Point
Antonio Augusto Barreto De Melo
VWAP is an intraday calculation used primarily by algorithms and institutional traders to assess where a stock is trading in relation to its weighted average volume for the day. Day traders also use VWAP to assess market direction and filter out trading signals. This indicator is used to analyze and calculate the Vwap from a certain point on the graph, which is widely used to analyze the beginning of a movement of the price relationship with the volume. - Multi Vwaps on the same chart, placed
Zones Supply and Demand
Jose Antonio Rojas Amaricua
Indicator Title: Supply and Demand Zones Short Description: This indicator for MetaTrader 5 automatically identifies and draws supply and demand zones on the price chart, providing key visual information for trading decisions. Based on the analysis of price action and candle structure, the indicator highlights areas where the price is likely to react. Detailed Description: The Supply and Demand Zones indicator analyzes price history to identify specific candlestick patterns that suggest the pres
AROON PRO MARKET SCANNER v12.0 Detect strong trend opportunities instantly Aroon PRO Market Scanner is not just a signal generator — it analyzes, filters, and prioritizes signals to help you focus only on the highest-quality trading opportunities. Designed for traders who monitor multiple symbols, this system saves time and improves decision quality. SMART SIGNAL ENGINE Advanced Aroon-based signal detection Signal strength calculation RSI confirmation filter EMA trend validation
The indicator is the advanced form of the MetaTrader 4 standard Fibonacci tool. It is unique and very reasonable for serious Fibonacci traders. Key Features Drawing of Fibonacci retracement and expansion levels in a few seconds by using hotkeys. Auto adjusting of retracement levels once the market makes new highs/lows. Ability to edit/remove any retracement & expansion levels on chart. Auto snap to exact high and low of bars while plotting on chart. Getting very clear charts even though many ret
No Demand No Supply MT5
Trade The Volume Waves Single Member P.C.
No Demand No Supply   This indicator identifies   No Demand –No Supply candles to your chart and plots volume bars colored according to the signal. It can be applied to all timeframes or to a specific one only. It can also be used as regular volume indicator  with exceptional future of WEIGHTED VOLUME. Furthermore is has an alert notification, sound and email when a signals occurs. The indicator does not repaint but the alert will come on two candles back due to the definition of No Demand No Su
Better RSI With Tester
Mohammad Taher Halimi Tabrizi
Category: Trend Indicator Platform: MetaTrader 5 Type: Entry Indicator Timeframes: All Trader Styles: Scalping, Day Trading, Swing Trading, Binary Options Markets: All Description This indicator is an enhanced version of the Relative Strength Index (RSI) with additional features for visual clarity and cycle detection. It is designed to provide traders with a clearer view of momentum conditions and potential turning points. Main features: Improved RSI Visualization – The indicator displays RSI va
Market Structure, Liquidity and Price Action Analysis for MetaTrader 5 A chart can contain plenty of information and still leave a trader without a clear decision. A BOS label may appear, liquidity may be nearby, and an order block may remain active, yet the real challenge is understanding how those elements relate to one another. ICT Yoshi Pro organizes that process into a cleaner, more disciplined MetaTrader 5 workflow. What ICT Yoshi Pro Does ICT Yoshi Pro is a manual decision-support indicat
Anchored VWAP with Alert MT5
Trade The Volume Waves Single Member P.C.
5 (1)
What is the Volume Weighted Average Price (VWAP)? The volume weighted average price (VWAP) is a trading benchmark used by traders that gives the average price an instrument has traded at throughout the day, based on both volume and price.  It is important because it provides traders with insight into both the trend and value of the instrument. What is the Difference between VWAP and AVWAP? While VWAP is having as starting point the beggining of the day,week,month etc. in the AVWAP you can pla
Buyers of this product also purchase
Trend Sniper X
Sarvarbek Abduvoxobov
4.86 (43)
Trend Sniper X is a multi-timeframe trend-following indicator for MetaTrader 5 that helps traders identify trend direction and potential reversal points with clarity and precision. for MT4: https://www.mql5.com/en/market/product/193245 Price Information: The current price is promotional and is subject to change as upcoming updates and new features are released. Bonus Offer: To get the FREE Auto-Trade Assistant EA for this indicator, please message the author after purchasing. Code2Profit Channe
In 2019 I showed the whole world what this indicator can do. I traded its signals by hand, on a real account, in the open — the account was monitored live on Myfxbook, and I covered my experiment in detail on Facebook. The result: $10,000 became $941,411 in four months. The risk was deliberately extreme — the drawdown reached 54%, because in our profession profit and risk always go hand in hand. The Myfxbook screenshot is the first picture in the gallery. Looks like congratulations are in order:
ULTRA is a technical indicator that operates on an “all-in-one” basis—it independently analyzes the market, generates trading signals, displays levels for setting stop-loss orders, and suggests when to close trades to lock in profits or minimize losses. In other words, it doesn't matter if you don't know how to analyze the market, determine levels—where to set your stop-loss—or struggle with money management. ULTRA will do all of that for you! BUYER BONUS: After purchasing the ULTRA indicator, s
Gann Made Easy   is a professional and easy to use Forex trading system which is based on the best principles of trading using the theory of W.D. Gann. The indicator provides accurate BUY and SELL signals including Stop Loss and Take Profit levels. You can trade even on the go using PUSH notifications. PLEASE CONTACT ME AFTER PURCHASE TO GET TRADING  INSTRUCTIONS   AND GREAT EXTRA INDICATORS  FOR FREE! Probably you already heard about the Gann trading methods before. Usually the Gann theory is a
M1 Sniper MT5
Oleg Rodin
5 (7)
M1 SNIPER  is an easy to use trading indicator system. It is an arrow indicator which is designed for M1 time frame. The indicator can be used as a standalone system for scalping on M1 time frame and it can be used as a part of your existing trading system. Though this trading system was designed specifically for short-term trading, it still can be helpful for all traders. This trading system can be used with any forex pair and time frame, though lower time frames are recommended from M1 up to M
Auto Optimized SpeedAngle is an institutional-grade momentum vectoring system that eliminates curve-fitting through continuous Walk-Forward Optimization (WFO). Rather than relying on static inputs that degrade when market regimes shift, the indicator dynamically recalibrates its parameters using Out-of-Sample (OOS) validation, ensuring the displayed signals represent genuine statistical edges rather than historical anomalies. By shifting the focus from subjective visual angles to normalized, qua
Boba Analysis Suite
Trade Ready Solutions LLC
5 (2)
Boba Analysis Suite Boba Analysis Suite is an analytical indicator for MetaTrader 5. It brings market structure, relevant price zones and broader market context together in a single chart view. Developed through practical experience as a trader and trading coach, it supports a structured analysis process: assessing market direction, identifying important levels and considering multiple timeframes together. Analysis in Context Individual signals gain meaning through context. Boba Analysis Suite h
Azimuth Pro
Ottaviano De Cicco
5 (7)
Azimuth Pro V2: Synthetic Fractal Structure and Confirmed Entries for MT5 Overview Azimuth Pro is a multi-level swing structure indicator by Merkava Labs . Four nested swing layers, swing-anchored VWAP, ABC pattern detection, three-timeframe structural filtering, and closed-bar confirmed entries — one chart, one workflow from micro-swings to macro-cycles. This is not a blind signal product. It is a structure-first workflow for traders who care about location, context, and timing. Halloween P
Zain Gold Scalping
Ahmed Gamal Abdel Nasser Mohamed
A complete price-action analysis tool built around dual independent entry logic, each confirmed against a volatility band, combined with a configurable set of nine optional confirmation filters that let you shape exactly how conservative or aggressive the tool's signals behave. Core Strategy Two independent entry setups, each triggering only when price moves outside a dynamic volatility band — giving two distinct ways to spot potential reversal points, which can be used together or separately.
Quantum TrendPulse
Bogdan Ion Puscasu
5 (26)
Introducing Quantum TrendPulse , the ultimate trading tool that combines the power of SuperTrend , RSI , and Stochastic into one comprehensive indicator to maximize your trading potential. Designed for traders who seek precision and efficiency, this indicator helps you identify market trends, momentum shifts, and optimal entry and exit points with confidence. Key Features: SuperTrend Integration: Easily follow the prevailing market trend and ride the wave of profitability. RSI Precision: Detect
Adaptive Price Action Engine Buy Indicator- Get EA Based on it for FREE. Self-Optimizing Multi-Timeframe Trend & Candlestick Intelligence Markets do not behave the same way all the time—and not every price-action pattern has the same value in every market regime. Adaptive Price Action Engine is designed to adapt to changing market conditions by combining trend structure, multi-timeframe analysis, candlestick patterns, and statistical optimization into one analytical framework. Two Adaptive Mode
Superhero
Ihor Otkydach
5 (3)
The SUPERHERO indicator is a multi-currency trading system designed on an "all-inclusive" basis. The indicator independently analyzes the market and provides signals on when to open and close trades. It uses Stop Loss and Take Profit orders. The R:R ratio is 1:1. This system can send push notifications to your smartphone, so you can place trades "on the go" without needing to be tied to a PC. It's perfect for proprietary trading firms. A BONUS FOR EVERY CUSTOMER: Every buyer of this indicator wi
Multi Currency Strength and Momentum Indicator MT5 Dynamic Forex28 Navigator is the evolution of our long-time, popular indicators, combining the power of three into one: Advanced Currency Strength28 Indicator (700 reviews) Advanced Currency IMPULSE with ALERT (530 reviews) CS28 Combo Signals (recent Bonus) The two predecessor indicators together have received more than 1,200 reviews on the MQL5 Market and have been a staple in the MT4 community since 2016. Dynamic Forex28 Navigator MT5 carries
Apex Patterns PRO Buy Indicator - Get Expert Advisor Based on it for FREE. Self-Optimizing Chart Pattern & Breakout Intelligence Traditional pattern scanners rely on fixed inputs, often underperforming when market volatility and structures shift. Apex Patterns PRO is designed to adapt to changing market conditions by combining structural chart pattern recognition, momentum filtering, and statistical self-optimization into one analytical framework. Adaptive Scanning Engine Self-Optimizing Patter
Neuro Poseidon MT5
Daria Rezueva
4.75 (52)
Neuro Poseidon is a new indicator by Daria Rezueva. It combines precise trading signals with adaptive TP/SL levels - creating best possible trades as a result! Message me and get  Neuro Poseidon Assistant  as a gift to automize your trading process! What makes it stand out? 1. Proven profitability on all assets and timeframes 2. Only confirmed BUY and SELL signals present on the chart 3. Adaptive TP & SL levels generated by the software for each trade 4. Easy to understand - suitable for al
CGE Trading Suite
Carl Gustav Johan Ekstrom
5 (3)
Institutional-Grade Analytics for MT5 The full analytical edge of a professional trading desk, built into your MT5 chart. A full guided tour walks you through every feature step by step. Standard retail platforms lack the depth required for professional market analysis. The CGE Trading Suite bridges this gap, transforming MetaTrader 5 into a comprehensive workspace. By integrating 18 proprietary modules into a single, unified chart interface, the suite eliminates fragmented analysis. It provide
Scalper Vault is a powerful, fully-equipped trading system designed for traders who want to achieve consistency in intraday trading . This high-precision indicator serves as a complete, standalone trading system that delivers institutional-grade analysis for both Forex and Binary Options traders. PLEASE CONTACT ME AFTER PURCHASE TO GET MY TRADING TIPS PLUS A GREAT BONUS! By eliminating the guesswork and complex manual analysis, Scalper Vault allows you to focus purely on execution using easy to
Divergence Bomber
Ihor Otkydach
4.89 (94)
Each buyer of this indicator also receives the following for free: The custom utility "Bomber Utility", which automatically manages every trade, sets Stop Loss and Take Profit levels, and closes trades according to the rules of this strategy Set files for configuring the indicator for various assets Set files for configuring Bomber Utility in the following modes: "Minimum Risk", "Balanced Risk", and "Wait-and-See Strategy" A step-by-step video manual to help you quickly install, configure, and
PZ Divergence Trading MT5
PZ TRADING SLU
3.71 (7)
Unlock hidden profits: accurate divergence trading for all markets Tricky to find and scarce in frequency, divergences are one of the most reliable trading scenarios. This indicator finds and scans for regular and hidden divergences automatically using your favourite oscillator. [ Installation Guide | Update Guide | Troubleshooting | FAQ | All Products  ] Easy to trade Finds regular and hidden divergences Supports many well known oscillators Implements trading signals based on breakouts Displays
FX Analysis is an all-in-one MT5 indicator dashboard that combines eight analytical tools in a single panel, helping traders identify high-probability setups without switching between charts or indicators. Designed for standard forex pairs on MetaTrader 5. Best results on M15 - H4 timeframes when all components are used together as part of the included workflow. Components Volatility Analyzer Displays historical average movement by hour and by day of the week. A real-time Pip Balance shows the
PainX GainX Blue Spike Fusion AI Synthetic Index Spike Analysis Indicator for MetaTrader 5 Overview PainX GainX Blue Spike Fusion AI is a technical analysis indicator for MetaTrader 5, designed to help traders monitor potential spike setups on compatible synthetic indices. The indicator combines signal monitoring, market-condition analysis, chart markers, notifications, and an on-chart information panel. It presents relevant market information in an organized format to help traders evaluate pote
The Oracle Pro
Ottaviano De Cicco
5 (1)
The Oracle Pro: Synthetic Multi-Timeframe Bias Engine for MT5 Halloween Promo — 35% OFF The market gets spooky. Your edge stays sharp. Save 35% before this offer fades into the mist. The Oracle Pro is now USD 194 (regular USD 299). The Oracle Pro is a premium multi-timeframe bias engine for MetaTrader 5, built for demanding and professional traders. It answers one question with discipline: what is the directional bias on each timeframe right now, how strong is it, and how much do the timefra
Hi Trader, Most retail traders rely on lagging, web-based scripts. To trade with a true edge, you need institutional architecture. The Astro AI Indicator is not a standard chart overlay. It is a compiled, dual-agent neural network running directly on your terminal. Here is the exact technology driving the system: 1. Agent 1: The Analyst (Graph Neural Networks - GNN) Markets are not just isolated price bars; they are interconnected networks of data. The Function: Agent 1 utilizes a Graph Neural
ARIPoint
Temirlan Kdyrkhan
1 (4)
ARIPoint is a powerful trading companion designed to generate high-probability entry signals with dynamic TP/SL/DP levels based on volatility. Built-in performance tracking shows win/loss stats, PP1/PP2 hits, and success rates all updated live. Key Features: Buy/Sell signals with adaptive volatility bands Real-time TP/SL/DP levels based on ATR Built-in MA Filter with optional ATR/StdDev volatility Performance stats panel (Success, Profit/Loss, PP1/PP2) Alerts via popup, sound, push, or email Cu
Best Solution for any Newbie or Expert Trader! This Indicator is a unique, high quality and affordable trading tool because we have incorporated a number of proprietary features and a new formula. With only ONE chart you can read Currency Strength for 28 Forex pairs! Imagine how your trading will improve because you are able to pinpoint the exact trigger point of a new trend or scalping opportunity? User manual:   click here That's the first one, the original! Don't buy a worthless wannabe clone
KURAMA GOLD SIGNAL PRO (MT5) — 7-Layer Filter, Auto TP/SL, Quality Score & Signal History Save | Complete XAUUSD Trading System No repaint in real time. The moment a signal appears, the arrow, entry, TP and SL are locked on the spot and never move afterward. What you trade is this real-time signal. And in v7.20, every signal that is actually sent is auto-saved and restored exactly after restart. BUYER BONUS Buy the lifetime license and receive AI Zone Radar (
Advanced Supply Demand MT5
Bernhard Schweigert
4.53 (15)
Best Solution for any Newbie or Expert Trader! This indicator is a unique, high quality and affordable trading tool because we have incorporated a number of proprietary features and a new formula. With this update, you will be able to show double timeframe zones. You will not only be able to show a higher TF but to show both, the chart TF, PLUS the higher TF: SHOWING NESTED ZONES. All Supply Demand traders will love it. :) Important Information Revealed Maximize the potential of Advanced Supply
DELTA FUSION PRO  is a professional MetaTrader indicator dedicated to real-time order flow analysis and institutional pressure (Ask/Bid difference). Main Features Smart Auto-Tuning: Automatically calibrates based on the market (Forex, Crypto, Indices, Commodities, Stocks, Futures), timeframe, and volatility (ATR). Operational Functionality: NetDelta & Cumulative Delta: Tracking directional pressure with EMA smoothing. Price/Volume Divergences: Detects regular/hidden divergences (classified as St
Introducing   Quantum Breakout PRO , the groundbreaking MQL5 Indicator that's transforming the way you trade Breakout Zones! Developed by a team of experienced traders with trading experience of over 13 years,   Quantum Breakout PRO   is designed to propel your trading journey to new heights with its innovative and dynamic breakout zone strategy. Quantum Breakout Indicator will give you signal arrows on breakout zones with 5 profit target zones and stop loss suggestion based on the breakout b
Volatility Master for MetaTrader is a real-time dashboard tool that scans up to  50 symbols  to identify high-volatility , trending markets instantly. With bullish/bearish signals, customizable alerts, and a user-friendly interface, it helps you avoid range-bound conditions and focus on high-probability trades. Clarity leads to confidence. Trade confidently and protect your capital effectively with this powerful dashboard. We don't offer free or bonus indicators in exchange of reviews from you.
More from author
Three institutional lenses. One deterministic engine. Most tools show you one dimension of the market. This indicator fuses the three that professionals cross-check constantly — and makes them talk to each other on a single chart: WHERE — Session Volume Profile. Per-session horizontal profiles with POC, VAH/VAL and a shaded Value Area, split into buying vs. selling pressure. You see the levels the market has actually accepted — and the thin air pockets it hasn't. WHEN — CVD Pressure Divergence.
FREE
Hard limits for prop firm and challenge accounts Prop firm rules are not suggestions. Breach the daily loss limit by one dollar and the account is gone, whatever the equity curve looked like an hour earlier. The problem is that the rule lives on the firm's server while your positions live in your terminal, and nothing in MetaTrader 5 connects the two. Prop Firm Circuit Breaker sits on one chart and watches the whole account. The name is literal: an exchange halts trading when a threshold is bre
FREE
Read-only analytics for accounts running several EAs. Groups your closed trades by magic number and measures how much of their combined risk actually cancels out. Free measurement edition. The monitoring and alerting edition is Portfolio Command Desk:  https://www.mql5.com/en/market/product/188884 The problem You run five Expert Advisors. Each backtest looked fine on its own. But the account does not trade five systems, it trades one portfolio, and no report in MetaTrader tells you how those sys
FREE
Start with the loss, not the profit. First decide how deep a drawdown you are willing to sit through — and then let the system go after returns inside that limit. That is the order Veteran Army Gold works in. And because gold does not move the way currencies move, it works the market one price level at a time, buying and selling, instead of betting the account on a single idea. The same discipline behind Veteran Army FX, applied to a single market that behaves like nothing else. At a glance Mark
Envelope monitoring for multi-EA accounts. Each magic number is watched against its own backtest; you get a traffic light on the chart and an alert only when a state changes. Includes the full free measurement layer. What it is You run several Expert Advisors on one account. This utility reads their closed history, groups it by magic number, and watches every system against its own backtest: a traffic light on the chart, and an alert only when a state actually changes. Underneath sits a full mea
Start with the loss, not the profit. First decide how deep a drawdown you are willing to sit through — 5-10%, 20-30%, or more — and then let the system go after returns inside that limit. That is the order Veteran Army Nasdaq works in. And because no one knows when the index will make its next real move — or in which direction — it stands ready on both sides of one market, with many independent systems instead of one confident bet. At a glance Market: US Tech 100 index, long and short, on the H1
Filter:
No reviews
Reply to review